

Abstract
Near‐infrared optical topography (NIROT) signals and event‐related potentials (ERPs) were measured simultaneously during a semantic processing task to evaluate the ability of these techniques to detect hemodynamic and electrophysiologic responses generated by semantic anomalies and to compare these results to earlier independent functional magnetic resonance imaging (fMRI) and ERP measurements. Candidate brain regions were first identified from activations detected by NIROT during a simple block‐design task (in this case reading sentences vs. passive viewing), and defined regions (corresponding to Broca's and Wernicke's areas) were used for guiding the localization of optodes and electrodes for recording during tasks involving semantic anomalies. In five of six subjects, ERP measurements showed the characteristic N400 wave, whereas event‐related NIROT showed results that agreed with previous fMRI studies. There were transient hemodynamic signals recorded in specific optodes that corresponded to activation in Broca's area, but slightly anterior to the region activated during the simple reading task, and in Wernicke's area, but slightly inferior to that for the simple reading task. A between‐subject correlation of the ERP and NIRS data was also employed to identify areas of activation. The highest correlations were obtained in Broca's area, centered more anterior than for the reading task and in Wernicke's area, slightly inferior to that for the reading task. This study confirms that event‐related studies are feasible using NIROT and produce results similar to those obtained with fMRI. Even though the spatial resolution is lower in NIROT than in fMRI, small differences in the locations of activation centers could be detected with NIROT. This, together with the feasibility of simultaneous ERP recording, makes NIROT attractive as a new approach to studying language function in healthy subjects as well as in those with functional abnormalities. Hum. Brain Mapping 22:112–117, 2004. © 2004 Wiley‐Liss, Inc.
Keywords: NIRS, NIROT, ERP, N400, semantic anomaly, neuroimaging
INTRODUCTION
Semantic priming has been used to assess language comprehension in normal subjects [Just et al., 1996; Kutas and Hillyard, 1980], as well as in several neurologic disorders [Ford, 2001; Goldberg et al., 2000]. The N400 wave is the characteristic response to an anomalous sequence of words measured with event‐related potentials (ERPs); the less likely a word matches with the previous one, the larger the area of the N400 component. Such mismatches may be semantic or syntactic in nature. The scalp distributions of such signals vary among different neurologic disorders.
ERPs are sensitive to changes in neuronal activity, and the time resolution of such signals is of the order of milliseconds. The spatial resolution is poor, however, and the origins of the signal within the brain cannot be identified easily from surface recordings, whereas the amplitude of the signal has little absolute significance and depends on many technical factors. Even when the N400 to semantic anomalies is sometimes larger on the right side, the primary source of generation is believed to be located in the left hemisphere [Kutas and Petten, 1994]. Hence, combining ERP recordings with a technique capable of localizing activity would likely assist studies that use one or the other method to understand aspects of brain function.
Functional magnetic resonance imaging (fMRI) has become well established for studies designed to localize neural activity [Bandettini et al., 1992]. The first fMRI studies were block‐design paradigms, allowing for localization of areas of activation [e.g., Deyoe et al., 1994]. Soon after, event‐related paradigms began to be used [McCarthy et al., 1997]. Although fMRI and ERP provide complementary information, most researchers use only one or the other technique at a time, mainly because of the difficulties of recording low‐level signals within an MRI scanner. In recent years, their simultaneous recording has been developed [Kruggel et al., 2000], but the quality of the ERPs recorded during an fMRI session is degraded by the electromagnetic interference produced by the magnet, radiofrequency coils, and field gradients.
Milliken [1933] showed that hemoglobin concentration and oxygenation state could be measured in living tissue by detecting changes in light absorbance and transmission. It was only in the late 1980s, however, that near‐infrared illumination was first used to measure cortical activity through the skull [Frostig et al., 1990; Grinvald et al., 1988]. Soon after, NIRS was used for measuring brain function [Villringer et al., 1993] and it has become recognized as an alternative technology for noninvasive studies of brain activity.
In the current work, a multi‐optode NIROT system (ETG‐100; Hitachi Medical) was used. The system is composed of emitter‐detector pairs. Each emitter is composed of two continuous laser diodes (power 0.5 mW) with different wavelengths (780 and 830 nm) and amplitude modulation (0.6 and 1.5 kHz). These signals are mixed and then transmitted through an optical fiber that is placed on the scalp. Another optical fiber carries the scattered signal picked up by the optical sensor to a photodiode. This signal is amplified, demodulated, and then digitized. Using the modified Beer‐Lambert Law, the detected signals can be converted to chromophore concentrations. An inter‐fiber spacing of approximately 2.7 cm produces a light penetration close to 20 mm, which is sufficient to ensure the optical path includes cortical tissue while maintaining good sensitivity [Hebden, 1997; McCormick, 1992].
In principle, NIRS is able to measure actual chromophore concentrations, but because the path length of the light in tissue is not measured by the ETG‐100 system, only differences in concentrations can be estimated using this instrument. As in conventional fMRI, two conditions must therefore be compared to detect activation.
To obtain a topographic map, a series of detector‐emitter pairs are arranged spatially. Figure 1 shows the arrangement of the eight incident and eight detection fibers on the surface of the scalp. Fibers are mounted on a plastic helmet, which is fitted to the subject and held by adjustable straps. Each pair of adjacent transmission and detection fibers defines a single optode unit. Black circles denote incident fibers, white circles denote detection fibers and numbers refer to the effective measurement position for each fiber pairing, which yields 24 optodes in this configuration. Once data are collected from the 24 locations, they may be interpolated so that topographic maps can be constructed.
Figure 1.

Layout and photograph of one set of 24 optodes used for NIROT. FZ, CZ, and PZ indicate location of EEG electrodes. Numbers 1 and 2 on the photograph indicate the relative position of those optodes.
NIROT has been used previously for the assessment of language lateralization in block‐design paradigms [e.g., Watanabe et al., 1998], but data often show low‐frequency oscillations [Obrig et al., 2000a] that can make it difficult to measure event‐related activity. Obrig et al. [2000] have recorded single events in a motor task, however, and our group and others [Kennan et al., 2002; Schroeter et al., 2002] have shown it is possible also during cognitive tasks. We have also shown previously that it is possible to measure ERP and NIROT simultaneously in an oddball paradigm [Kennan et al., 2002]. The ERP wave detected after auditory oddballs, the so‐called P300, is a much larger component than the N400 wave generated by semantic anomalies. We evaluated whether NIRS can be used to complement the information provided by ERP, whether the N400 can be measured while simultaneously acquiring NIRS data, and, the relationship between the two measurements.
SUBJECTS AND METHODS
Subjects
Six native English‐speaking volunteers (three right‐handed males, two right‐handed females and one left‐handed female; age range, 21–45 years) participated in this study. Informed consent was obtained from each subject in accordance with a protocol reviewed and approved by the Human Investigation Committee of Yale University School of Medicine.
Stimuli
Subjects were informed they would see a word followed by a second one, and that those words would comprise a phrase, followed by a fixation mark. They were instructed to read the phrases silently. Verbal phrases (verb + noun, VPs) in which the verbs were irregular and were always in the past tense, and the nouns were plural (e.g., “grew plants”) were presented. The timing and order of stimuli presentation was verb (350 msec), noun (350 msec), and then by fixation mark (800 msec). A trigger was sent to the EEG recording system and the NIRS data acquisition system to be able to sort the timing of the signals in event‐related fashion. In each run, we presented 174 stimuli, of which 14 were anomalous “target” VPs. The anomalies were semantic (“heard shirts”), as in Kang et al. [1999]. Four runs were presented to four subjects (for a total of 56 targets), and two runs (28 targets) to the other two subjects.
To locate Broca's and Wernicke's areas, NIROT was also carried out while subjects completed a block‐design silent reading task in which text from a technical manual was presented for 20‐sec periods, interleaved with 20 sec of blank screen, with four to six blocks of each.
ERP
Data acquisition
Electrical signals were measured from the scalp using Ag/AgCl electrodes and Synamps amplifiers (Neuroscan, El Paso, TX) at locations of FZ, CZ, and PZ the International 10/20 system, with the left earlobe as reference and the forehead as ground. The electrooculogram (EOG) was also monitored with an electrode placed below the eye. Data were sampled at 500 Hz, using a bandpass filter from 0.05–100 Hz.
Data analysis
Data were processed using Scan4.2 software (Neuroscan). First, a third‐order drift correction was applied. Second, the ocular artifact was removed. Finally, for each subject the data were arranged into epochs, linearly de‐trended, baseline‐corrected (assuming zero mean for the 100‐msec prestimulus), and the target epochs were averaged. The amplitude and latency of the peak signal in the interval 300–500 msec were measured for each subject [Neville et al., 1992]. One‐tailed, paired Student's t‐tests were carried out for the amplitude of signal for normal versus anomalous phrases at electrode PZ.
Optical Topography
Data acquisition
Near‐infrared optical topography was carried out using a 48‐channel 780/830 nm spectrometer (ETG‐100 system; Hitachi Medical Corp.). Signals were acquired at a sample rate of 10 Hz from 24 cortical regions on the left hemisphere of the head of each volunteer, as shown in Figure 1.
Data analysis
Absorbance data were processed with Matlab (The Math Works). The first stage was to filter the data in the temporal domain to remove artifacts due to respiration and cardiac variations (using a bandpass filter with range 0.02–0.3 Hz; Fig. 2). Data were then converted to measurements of hemoglobin levels according to the modified Beer‐Lambert Law, arranged into epochs, and an average time course was obtained for each subject at each location. The time courses were fit to a γ variate function. For the control task, for each subject, the average block was correlated with a boxcar function, beginning 2 sec after the onset of the start of the task and lasting for 20 sec. For the semantic processing task, the differences between the mean values in the interval −5 to −1 and 2–6 seconds (relative to the onset of the anomalous word) were evaluated.
Figure 2.
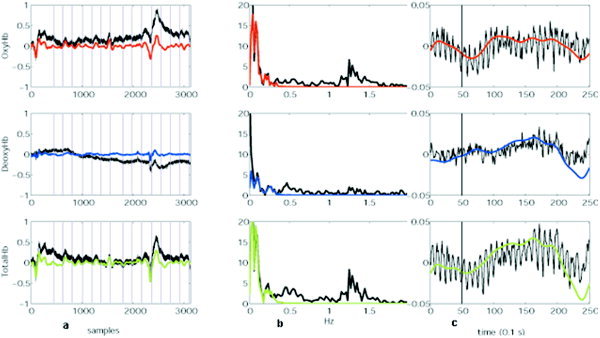
Effect of filtering (data from one subject). Black traces are non‐filtered data and color traces indicate data after a 0.02–0.3 Hz bandpass filter was applied. a: Continuous hemoglobin data: Vertical lines indicate where targets were presented. b: After Fourier transform. c: Average data.
Direct Comparison Between ERP and NIRS Data
To evaluate if the modulation in the NIROT and ERP signals are related, we carried out a correlation of the signal changes between the normal and anomalous condition in both modalities and identified the more active regions in which electrical and hemodynamic variations were coupled more strongly.
RESULTS
Control Task
It is well established that during a reading task both Broca's and Wernicke's areas are activated, and these correspond to separate cortical volumes, usually in the left hemisphere. In five of six subjects, activations were observed in two separate regions on the topographic maps, the more frontal one presumably corresponding to Broca's area, and the more posterior one to Wernicke's area (Fig. 3). Correlation values with the boxcar fit are indicated in Table I. The observed correlation values for Subject 1 were much smaller than for the other subjects. The total hemoglobin time courses for the optodes indicated in Table I can be observed in Figure 4. These results were used as landmarks for the other activation measurements.
Figure 3.
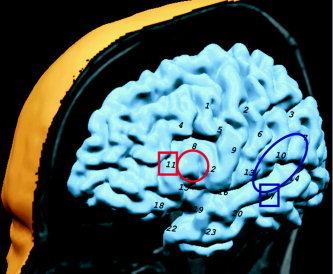
Relative location of optodes, overlaid on schematic of a brain. Red circle indicates Broca's area. Blue circle indicates Wernicke's area. These areas were used as landmarks to locate the probes. Squares represent the location of the most active optodes, which are also the ones with higher correlation with the ERP data.
Table I.
Correlation coefficients for total hemoglobin data with a boxcar function starting 2 seconds after stimulus onset
| Subject no. | Broca's area | Wernicke's area | ||
|---|---|---|---|---|
| Correlation value | Optode | Correlation value | Optode | |
| 1 | 0.20 | 11 | 0.23 | 6 |
| 2 | 0.85 | 15 | 0.76 | 13 |
| 3 | 0.91 | 8 | 0.89 | 6 |
| 4 | 0.86 | 12 | 0.77 | 7 |
| 5 | 0.93 | 8 | 0.95 | 14 |
| 6 | 0.62 | 15 | 0.67 | 13 |
Figure 4.

Reading task: Subject read for 20 sec (time 0–20). Traces indicate time course of total hemoglobin signal. Gray traces correspond to Subject 1. In black, Subjects 2–6; recordings from left hemisphere. Top: Broca's area. Bottom: Wernicke's (optode included in each plot as indicated in Table I).
Semantic Anomaly
Event‐related potentials
Subjects 2–6 showed an N400 wave in response to the semantic anomaly presented in the study. The difference signal recorded at electrode PZ was significant (P = 0.007). Figure 5 shows the composite average waves for five subjects, for targets and normal sentences. The subject that displayed low correlation in the reading task (Subject 1) did not show a N400 wave (Table II) and was excluded for subsequent analyses.
Figure 5.
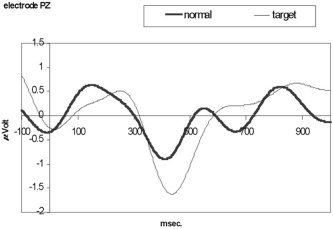
ERP recording from electrode PZ of the N400 response. Thick trace is for the normal phrases and thin trace for the anomalous (N400) phrases. Data were smoothed for display purposes.
Table II.
Results from event‐related semantic processing task
| Subject no. | ERP differences electrode PZ | Broca's area optode 11 | Wernicke's area optode 17 |
|---|---|---|---|
| 1 | 1.866 | <0.20 | <0.20 |
| 2 | −3.157 | 0.90 | 0.81 |
| 3 | −1.793 | 0.92 | 0.91 |
| 4 | −1.324 | 0.86a | 0.79b |
| 5 | −2.695 | 0.71 | 0.65 |
| 6 | −0.597 | 0.86 | 0.94 |
Event‐related potential (ERP) differences indicate the difference between the N400 peak for anomalous versus normal phrases. Broca's area indicates the correlation value for the near‐infrared spectroscopic (NIRS) data with a γ‐variate function with optode 11. Wernicke's area indicates the correlation value for the NIRS data with a γ‐variate function.
Higher correlation at optode 12.
Higher correlation at optode 7.
Optical Topography
The effect of filtering is shown in Figure 2. Table II shows the location and correlation coefficient for the γ‐function for the optodes with higher activations. In Broca's area, the activation with the semantic anomaly was observed slightly anterior to the area observed in the reading task. The activation in Wernicke's area was more inferior than was the area in the reading task for four of five subjects (see squares in Fig. 3). Subject 4 showed activations that were not significantly different in locations.
Direct Comparison Between ERP and NIRS Data
The optodes that showed the highest correlations between electrical and hemoglobin signal amplitudes were the same as described above (optodes 11 and 17). The total Hb signal change per microvolt observed at optode 11 was more than double that measured at optode 17. These regions are indicated with squares in Figure 3.
DISCUSSION
This study demonstrates that ERPs can be measured simultaneously with NIROT data even for small‐amplitude signals evoked in a semantic anomaly task. NIROT can be used to identify the regions activated in event‐related studies, and quantitative measurements can be made of the relative changes in total hemoglobin over a time course of several seconds. Oscillations often observed in the NIROT data do not represent a serious problem for block design analyses, but can become critical for event‐related analyses; however, event‐related analysis is feasible by adequate filtering of the data.
The optodes that showed the largest responses in each area were close to those that were activated in the reading control task. As expected, semantic anomalies produced activations in Wernicke's area [Binder et al., 1997]. The activation in Broca's area seen as well agrees with the results of our previous fMRI study [Kang et al., 1999]. We did not compare left and right lateralization in this study as reported by Kang et al. [1999] because we chose to measure anterior and posterior areas of the left hemisphere, rather than examining both hemispheres. Further measurements with more optodes could be carried out to compare right and left responses.
Contralateral activations have been observed in normal subjects as the demands of sentence comprehension increase [Just et al., 1996], and the levels of activation are apparently modulated by task demand. This could explain why the left‐handed subject (Subject 6) showed less activation in the left hemisphere than did the other subjects for the reading control task, but similar levels on the semantic task.
The values obtained in the direct comparison between NIRS and ERPs were smaller than those reported by Orbig et al. [2002] for oxy‐ and deoxyhemoglobin. We carried out only total Hb measurements, and the task was different: we evaluated a high‐order cognitive task whereas the study by Orbig et al. [2002] looked at visual components. To get a more definitive “coupling index,” it would be desirable to have more events and more subjects.
The combined use of NIROT and ERPs could have several practical applications. The ability to register the magnitude of a neural response with ERP while documenting brain hemodynamic changes ensures that subjects are responding to the task as required. The ability to localize sources of ERPs and compare the responses in cortical areas quantitatively to changes in task conditions (e.g., changes in degree and type of an anomaly) is a clear advantage of the combined methodology. There are clinical disorders in which such studies could also be important. For example, it has been reported that schizophrenic patients show deficits in sentence comprehension that could be due to reduced attention or to a malfunction in the network that processes the information context; for example, an overactive contralateral activation might be the cause of an anomalous priming effect. The ability to measure ERPs and localize sources of activation with NIROT simultaneously could help to understand these observed effects. In addition, Alzheimer's patients show deficits in semantic processing, whereas tasks that elicit robust activation of language areas during passive observation of stimuli may be of use for studies of aphasic subjects with speech impairments. Clearly, a more extensive study of such effects is warranted. The specificity of N400 to language anomalies has been questioned. The complementary information provided by ERPs and NIROT data could help better understand the nature of this neural signal and deficits observed in different pathologies or disorders.
Acknowledgements
We thank Hitachi Medical Systems America, Inc. for the use of their equipment and for their support on this project.
REFERENCES
- Bandettini PA, Wong EC, Hinks R, Tikofsky R, Hyde J (1992): Time course EPI of human brain function during task activation. Magn Reson Med 25: 390–397. [DOI] [PubMed] [Google Scholar]
- Binder J, Frost J, Hammeke T, Cox R, Rao S, Prieto T (1997): Human brain language areas identified by functional magnetic resonance imaging. J Neurosci 17: 353–362. [DOI] [PMC free article] [PubMed] [Google Scholar]
- Deyoe EA, Bandettini P, Neitz J, Miller D, Winans P (1994): Functional magnetic resonance imaging (fMRI) of the human brain. J Neurosci Methods 54: 171–187. [DOI] [PubMed] [Google Scholar]
- Ford JM, Mathalon DH, Kalba S, Whitfield S, Faustman WO, Roth WT (2001): Cortical responsiveness during talking and listening in schizophrenia: an event‐related brain potential study. Biol Psychiatry 50: 540–549. [DOI] [PubMed] [Google Scholar]
- Frostig RD, Lieke EE, Ts'o DY, Grinvald A (1990): Cortical functional architecture and local coupling between neuronal activity and the microcirculation revealed by in vivo high‐resolution optical imaging of intrinsic signals. Proc Natl Acad Sci USA 87: 6082–6086. [DOI] [PMC free article] [PubMed] [Google Scholar]
- Goldberg TE, Dodge M, Aloia M, Egan MF, Weinberger DR (2000): Effects of neuroleptic medications on speech disorganization in schizophrenia: biasing associative networks towards meaning. Physiol Med 30: 1123–1130. [DOI] [PubMed] [Google Scholar]
- Grinvald A, Frostig R, Lieke E, Hildesheim R (1988): Optical imaging of neuronal activity. Physiol Rev 68: 1285–1366. [DOI] [PubMed] [Google Scholar]
- Hebden JC, Delpy DT (1997): Diagnostic imaging with light. Br J Radiol 70: S206–214. [DOI] [PubMed] [Google Scholar]
- Just MA, Carpenter PA, Keller TA, Eddy WF, Thulborn KR (1996): Brain activation modulated by sentence comprehension. Science 274: 114–116. [DOI] [PubMed] [Google Scholar]
- Kang AM, Constable RT, Gore JC, Avrutin S (1999): An event‐related study of implicit phrase‐level syntactic and semantic processing. Neuroimage 10: 555–561. [DOI] [PubMed] [Google Scholar]
- Kennan RP, Horovitz SG, Maki A, Yamashita Y, Koizumi H, Gore JC (2002): Simultaneous recording of event‐related auditory oddball response using transcranial near infrared optical topography and surface EEG. Neuroimage 16: 587–592. [DOI] [PubMed] [Google Scholar]
- Kruggel F, Wiggins C, Hermann C, V Cramon D (2000): Recording of the event‐related potentials during functional MRI at 3.0 Tesla field strength. Magn Reson Med 44: 277–282. [DOI] [PubMed] [Google Scholar]
- Kutas M, Hillyard SA (1980): Reading senseless sentences: brain potentials reflect semantic incongruity. Science 207: 203–205. [DOI] [PubMed] [Google Scholar]
- Kutas M, Petten CKV (1994): Psycholinguistics electrified. Event‐related brain potential investigations. Handbook of psycholinguistics: Academic Press. [Google Scholar]
- McCarthy G, Luby M, Gore J, Goldman‐Rakic P (1997): Infrequent events transiently active human prefrontal and parietal cortex as measured by functional MRI. J Neurophysiol 77: 1630–1634. [DOI] [PubMed] [Google Scholar]
- McCormick PW, Stewart M, Lewis G, Dujovny M, Ausman JI (1992): Intracerebral penetration of infrared light [technical note]. J Neurosurg 76: 315–318. [DOI] [PubMed] [Google Scholar]
- Milliken G (1933): Simple photoelectric colorimeter. J Physiol 79: 152. [DOI] [PMC free article] [PubMed] [Google Scholar]
- Neville HJ, Mills DL, Lawson DS (1992): Fractionating language: different neuronal subsystem with different sensitive periods. Cereb Cortex 2: 244–258. [DOI] [PubMed] [Google Scholar]
- Obrig H, Israel H, Kohl‐Bareis M, Uludag K, Wenzel R, Müller B, Arnold G, Villringer A (2002): Habituation of the visual evoked potential and its vascular response: implications for neurovascular coupling in the healthy adult. Neuroimage 17: 1–18. [DOI] [PubMed] [Google Scholar]
- Obrig H, Neufang M, Wenzel R, Kohl M, Steinbrink J, Einhäupl K, Villringer A (2000a): Spontaneous low frequency oscillations of cerebral hemodynamics and metabolism in human adults. Neuroimage 12: 623–639. [DOI] [PubMed] [Google Scholar]
- Obrig H, Wenzel R, Kohl M, Horst S, Wobst P, Steinbrink J, Thomas F, Villringer A (2000b): Near‐infrared spectroscopy: does it function in functional activation studies of the adult brain? Int J Psychophysiol 35: 125–142. [DOI] [PubMed] [Google Scholar]
- Schroeter ML, Zysset S, Kupka T, Kruggel F, von Cramon DY (2002): Near‐infrared spectroscopy can detect brain activity during a color‐word matching Stroop task in an event‐related design. Hum Brain Mapp 17: 61–71. [DOI] [PMC free article] [PubMed] [Google Scholar]
- Villringer A, Planck J, Hock C, Scheinkofer L, Dirnagl U (1993): Near‐infrared spectroscopy (NIRS): a new tool to study hemodynamic‐changes during activation of brain function in human adults. Neurosci Lett 154: 101–104. [DOI] [PubMed] [Google Scholar]
- Watanabe E, Maki A, Kawagucchi F, Takashiro K, Yamashita Y, Koizumi H, Mayanagi Y (1998): Non‐invasive assessment of language dominance with near‐infrared spectroscopic mapping. Neurosci Lett 256: 49–52. [DOI] [PubMed] [Google Scholar]