The images for Figs 5 and 6 are incorrectly switched. The image that appears as Fig 5 should be Fig 6, and the image that appears as Fig 6 should be Fig 5. The figure captions appear in the correct order.
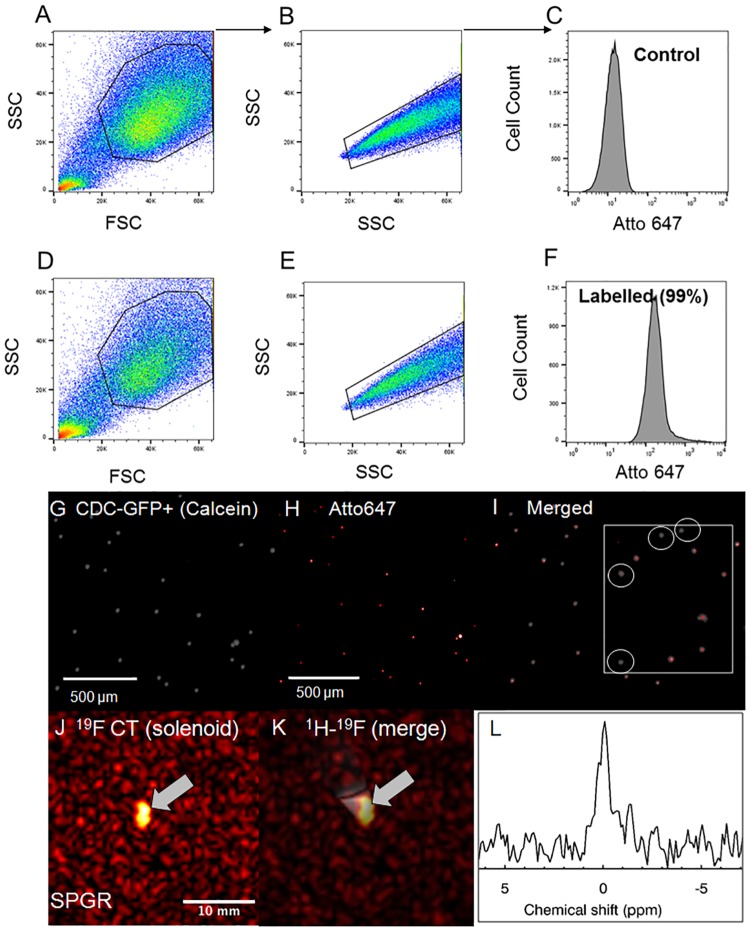
Fig 5. CPC label confirmation using flow cytometry and in vitro 19F MRI/MRS validation.
(A, B, D, E) Ungated scatter plots of forward (FSC) and side scatter (SSC, singlets vs. doublets) and (C, F) gated, overlapped flow cytometry histograms of control (C) and labeled CT cells (F) confirming cellular uptake. Applied gates are indicated in the scatter plots as highlighted regions-of-interest. (G, H) Confocal microscopy images of PFCE labelled (G) CDC GFP+ (calcein [gray]), (H) Atto647 (red), and (I) merged calcein/Atto647 with a zoomed inlet indicating the heterogenous distribution of cellular label uptake. (J, K) Corresponding 19F and 1H-19F merged MRI of labeled CT cells (~4.5 million) obtained using the solenoid coil showing excellent 19F signal localization. (L) 19F magnitude spectrum in labeled CTs using the solenoid coil (line broadening = 30 Hz, zero reference frequency set to the NP-labeled CT cell resonance).
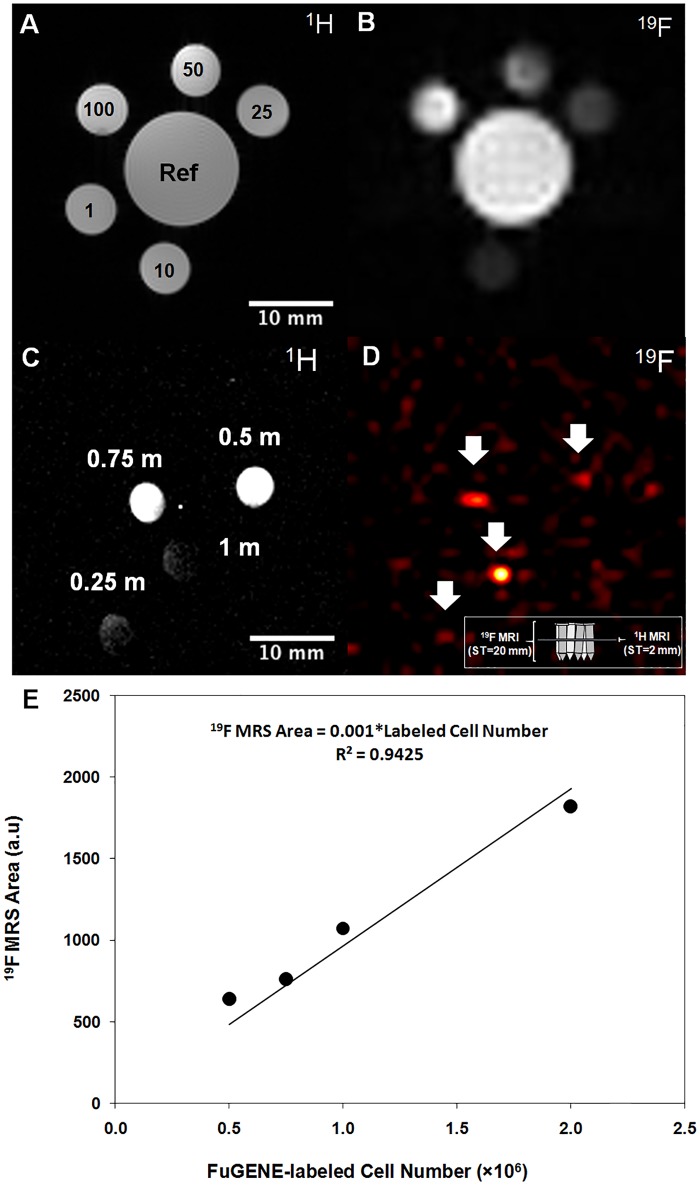
Fig 6. 19F MRI-based quantification in solutions and CPCs and determination of cellular detectability limit.
19F MR spectroscopy, image-based quantification, and sensitivity detection limits: (A, B) Axial 1H and 19F images from TFA phantoms of different concentrations (25–100 mM), and images of a multivial sensitivity phantom containing 0.25, 0.5, 0.75, and 1 million labeled/transfected CT cells suspended in media for sensitivity limit detection (cell pellets resided at the bottom of the Eppendorf tubes) using the butterfly coil. (C) 1H imaging indicates spatial B1 fall off-effects (laterally and with depth, non-adiabatic excitation). 19F imaging indicates a minimum detectable cellular load of approximately 500k cells in a total acquisition of 4.4 min (white arrows). The 19F MRI in (D) shows cells over a slice thickness of 20 mm. As shown by the inserted schematic, the 1H MRI in (C) shows cross-sections (from the middle of the Eppendorf tubes), while the 19F MRI in (D) shows the hyperintense cell pellets that were sometimes slightly displaced spatially given the tilting of some of the tubes and the dispersion of the cells on the walls of the tubes in instances where the acquisitions were prolonged. (E) Quantification of labelled CPCs using 19F MRS (solenoid). The linearity of the evoked fully relaxed spectral area versus cell number was independently confirmed using fast, direct, image-based SPGR using CPCs (butterfly coil) (results not shown).
S1 Appendix erroneously contains annotated comments. Please view the correct S1 Appendix below.
Supporting information
(DOC)
Reference
- 1.Constantinides C, Maguire M, McNeill E, Carnicer R, Swider E, Srinivas M, et al. (2018) Fast, quantitative, murine cardiac 19F MRI/MRS of PFCE-labeled progenitor stem cells and macrophages at 9.4T. PLoS ONE 13(1): e0190558 10.1371/journal.pone.0190558 [DOI] [PMC free article] [PubMed] [Google Scholar]
Associated Data
This section collects any data citations, data availability statements, or supplementary materials included in this article.
Supplementary Materials
(DOC)


