Abstract
Biochar amendment is a good means of mitigating methane (CH4) and nitrous oxide (N2O) emissions. However, the effects of biochar amendment on N2O and CH4 reduction in soil under rotation with different soil moisture contents is not well understood. To understand CH4 and N2O flux from soil with biochar amendment under water-unsaturated and water-saturated conditions, a field experiment was conducted in a tobacco-rice rotation field in subtropical China to investigate N2O and CH4 emissions following soil amendment with tobacco straw biochar at rates of 0, 10, 40 and 80 t·ha−1 (B0, B10, B40 and B80, respectively). N2O and CH4 emissions were monitored by a closed-chamber method in the water-unsaturated tobacco (UT) and water-saturated rice (SR) seasons during the 2015 planting season. The soil pH increased from 5.4 in the control to 6.1 in the soil amended with biochar at 80 t·ha−1 in the UT season. During both the UT and SR seasons, with biochar amendment at 40 and 80 t·ha−1, the soil bulk density (BD) decreased, while the soil organic matter (SOM) and available potassium (Av. K) contents increased. N2O flux was significantly greater in UT than in SR in the controls but decreased with the application of biochar during both the UT and SR seasons. The cumulative CH4 emission decreased with the rate of biochar application and the methanotroph pmoA gene copy number in soils and increased with the methanogenic archaea 16Sr DNA gene copy number in soils during the rice-cropping season. These results indicated that biochar amendment could decrease methanogenic archaea and increase of methanotroph pmoA gene, which are the mechanistic origin for CH4 reduction.
Subject terms: Carbon cycle, Element cycles
Introduction
CH4 and N2O are important greenhouse gases in the atmosphere1,2. Due to human activities, the concentrations of N2O and CH4 in the atmosphere increased from 270 ppbv and 324 ppb in 1750 to 324 ppbv and 1803 ppb in 2011, respectivelly2,3. With the growing demand for food, further increases in these greenhouse gasses are projected in the future3. Agricultural soil is the main source of N2O and CH4 emissions, accounted for approximately 66% and 50% of total emissions, respectively1,4. To mitigate global warming, it is necessary to employ strategies that will reduce these gas emissions from agricultural soil5.
Reducing N fertilizer input and increasing its use efficiency could decrease N2O emissions; biochar application might play an important role in this approach. With its feedstock availability and favourable properties, biochar has been considered a good input for improving crop N use efficiency and increasing carbon (C) return to soil6–8. A meta-analysis using data across 208 peer-reviewed studies showed that symbiotic biological N2 fixation and plant N uptake were increased by 63% and 11%, respectively, with biochar amendment9. It has been found that the crop growth response with biochar is greater in acidic soils than neutral and alkaline soils because the soil nutrient-retention capacity is typically low in acidic soil and applying biochar will increase this capacity10. Thus, there is an increase in crop growth as the pH of soil amended with biochar is increased11. However, the rate of nitrification and denitrification is improved in acidic soil with increasing pH, and these are the main pathways for N2O production. Conversely, as the soil pH is increased, the activity of N2O reductase (N2O-R) is improved12. This improvement will lead to more reduction of N2O to N2 (which is the last step of the denitrification process), resulting in a decrease in the N2O emission rate. Additionally, biochar can reduce nirK abundance and increase nosZ abundance, which will inhibit N2O production and simultaneously increase N2O consumption in acidic soil13,14. Therefore, the effects of biochar on N2O emissions in acidic soil may be different from those in other soil types.
CH4 is primarily produced in an exclusively anaerobic process by methanogenic archaea4,15. However, under unsaturated conditions, soils are considered sinks for CH47. Powlson et al.16 reported that non-flooded upland soils are an important CH4 sink and that approximately 15% of global CH4 oxidation is attributed to this sink. Microbial oxidation of CH4 is the main pathway of soil CH4 uptake, which is driven by methanotrophs. Some methanotrophs feed solely on CH4, while others are facultative methanotrophs, which include Methylocella and Methylocapsa17,18. It has been reported that CH4 uptake in soil may be increased by biochar amendment due to the adsorption of CH4 onto the surfaces of biochar19. Additionally, soil aeration may be affected when biochar is added, and this may increase diffusive CH4 uptake20. Biochar has also been observed to stimulate methanotrophic CH4 consumption in anoxic environments, particularly at oxic/anoxic interfaces21. For example, most CH4 is produced in anoxic sediment in saturated soils, and some CH4 is consumed at the aerated root interface8. It was reported by Feng et al.22 that under saturated conditions, biochar significantly increased the strength of CH4 sink properties compared to the controls via decreasing the ratio of methanogenic archaea to methanotrophic bacteria8. Furthermore, biochar can provide a C substrate for microbial CH4 oxidation in soils20, and the labile C of biochar may be used as a methanogenic substrate in anoxic environments, promoting CH4 production23. However, the effects of biochar on CH4 emissions from soils under saturated and unsaturated conditions are not fully understood.
Additionally, uncertainty exists as to whether biochar’s GHG mitigation effects persist for one cropping season or longer. Lentz et al.24 suggested that the GHG mitigation effects of biochar application may be long-lived, whereas Spokas25 indicated that they were mainly short-term (a few days to several weeks). Therefore, further study is required to determine the period of GHG mitigation effects resulting from biochar application.
Tobacco followed by rice cropping is a common agricultural practice in South China. However, tobacco straw is discarded beside the field after harvest, and this may lead to disease outbreaks and infections. Instead of simply discarding tobacco straw, incorporating this material into the soil as biochar has been widely recommended. This will help improve soil organic matter and reduce environmental pollution caused by straw littering.
To investigate the effect of biochar made from tobacco straw on N2O and CH4 emissions in acidic soil under rotation with different water regimes, a field experiment with tobacco and rice rotations was conducted in subtropical China. Specifically, we hypothesize that soil amendment with biochar (i) may not reduce the N2O emission rate, given that stimulating N2O reduction may be counteracted by improved nitrification and denitrification in acidic soil due to increased soil pH after biochar application, and (ii) affects the emissions of N2O and CH4 early in the first planting season but not in the second planting season because the active surfaces of the biochar become saturated over time.
Results
Soil properties
The soil pH determined after tobacco harvest increased with an increased rate of biochar application; the highest pH was found in B80 (Table 1). However, no significant differences were recorded in pH after the rice harvest (Table 1). Soil BD was decreased from 1250.0 kg·m−3 in the control to 1170.0 kg·m−3 and 1160.0 kg·m−3 in B40 and B80 in the UT season, and from 1360.0 kg·m−3 in the control to 1210.0 kg·m−3 and 1190.0 kg·m−3 in B40 and B80 in the SR season. However, the SOM and Av. K contents increased with increasing rates of biochar in both the UT and SR seasons.
Table 1.
Soil properties after biochar amendment.
| Treat- ment |
UT season | SR season | ||||||||||
|---|---|---|---|---|---|---|---|---|---|---|---|---|
| pH | SOM g·kg−1 |
BD kg·m−3 |
Av. N mg·kg−1 |
Av. P mg·kg−1 |
Av. K mg·kg−1 |
pH | SOM g·kg−1 |
BD kg·m−3 |
Av. N mg· kg−1 |
Av. P mg·kg−1 |
Av. K mg·kg−1 |
|
| B0 | 5.4c | 22.7b | 1250.0 a | 122.2a | 34.9a | 117.0b | 5.5a | 22.8b | 1360.0ab | 111.5b | 24.6b | 103.4c |
| B10 | 5.6bc | 25.5b | 1210.0ab | 127.3a | 37.3a | 148.8b | 5.4a | 24.5b | 1310.0 a | 120.9b | 46.6a | 137.8c |
| B40 | 5.6bc | 32.2a | 1170.0bc | 122.2a | 36.3a | 303.3b | 5.2a | 30.2a | 1210.0 b | 121.7b | 51.0a | 385.6b |
| B80 | 6.1a | 35.3a | 1160.0 c | 120.3a | 39.5a | 481.3a | 5.6a | 34.9a | 1190.0 b | 153.0a | 51.5a | 467.6a |
The soil samples were collected after tobacco and rice were harvested. Data in the table are the means, and different letters indicate significant differences at 5%; B0, B10, B40 and B80 are no biochar applied and biochar applied at the rate of 10, 40 and 80 t·ha−1, respectively; UT is unsaturated tobacco cropping; SR is saturated rice cropping; ccSOM is soil organic matter; BD is bulk density; Av. N is alkali-hydrolysable nitrogen; Av. P is available phosphorus; and Av. K is available potassium.
N2O and CH4 emissions
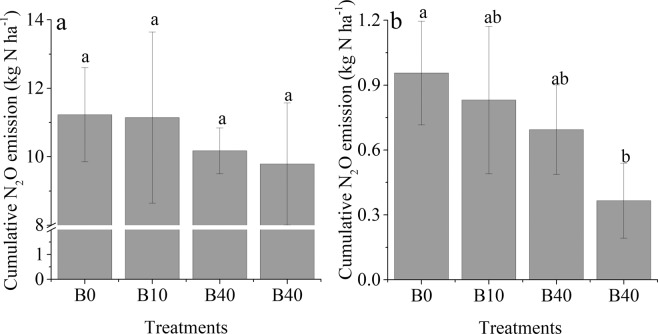
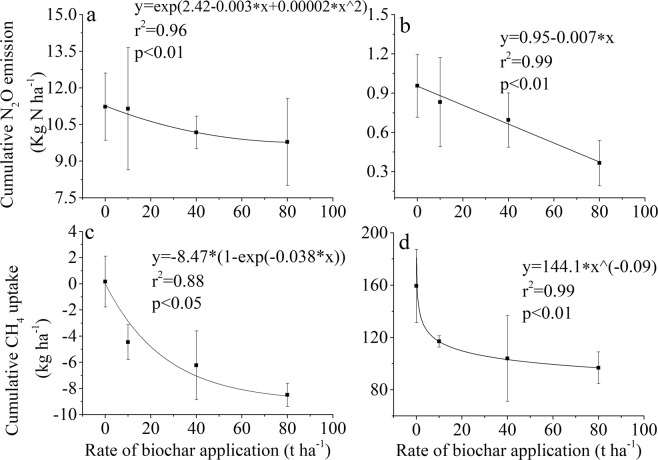
The N2O flux from all treatments was greater during the UT season than in the SR season (Fig. 1). The highest rate of N2O emission in most of the flux peaks was found in the B0 treatment during the experiment (Fig. 1). The cumulative N2O emissions during the UT season was 9.8 to 11.3 kg N·ha−1, which was significantly higher than that during the SR season by ≈10 times (Fig. 2). There was no significant difference among the treatments during the UT season (Fig. 2a), whereas the cumulative N2O flux during the SR season from B80 was significantly lower than that from B0 (Fig. 2b). There was a negative relationship between cumulative N2O flux and the rates of biochar applied during the UT and SR seasons (Fig. 3a,b, respectively).
Figure 1.
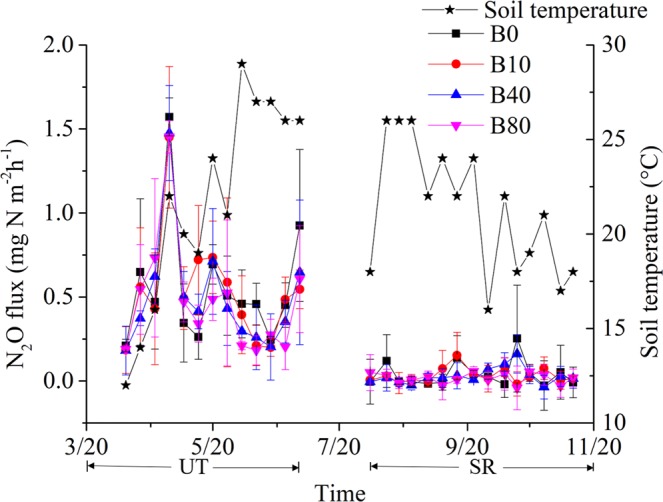
Temporal pattern of N2O fluxes for the different treatments during the tobacco and rice growth periods. The period from 3/20 (MM/DD) to 7/20 was the unsaturated tobacco growth season (UT), and the period from 7/20 to 11/20 was the saturated rice growth season (SR); B0, B10, B40 and B80 are no biochar applied and biochar applied at a rate of 10, 40 and 80 t·ha−1, respectively.
Figure 2.
Cumulative N2O missions during the tobacco (a) and rice (b) growth periods. Values with same letter are not significantly different (p < 0.05); B0, B10, B40 and B80 are no biochar applied and biochar applied at the rate of 10, 40 and 80 t·ha−1, respectively.
Figure 3.
Relationship between the rate of biochar application and cumulative N2O emission during the tobacco (a) and rice (b) growth periods and between the rate of biochar application and cumulative CH4 uptake during the tobacco growth season (c) and emission during the rice growth period (d). Positive values of CH4 flux are CH4 emission, and negative values are CH4 uptake.
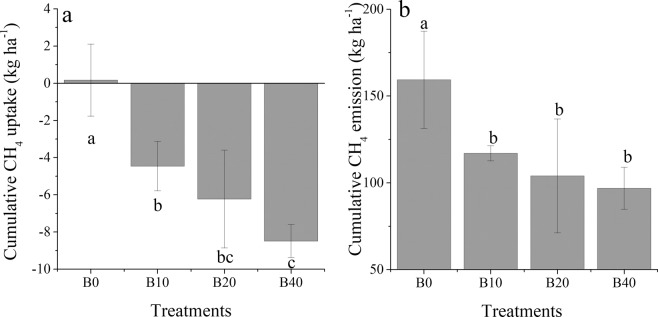
Unlike N2O, CH4 was taken up during the UT season, and the flux was also recorded during the SR season (Fig. 4). In the first two months of the SR season, the greatest CH4 emission flux was observed for B0, followed by B10, B40 and B80 (Fig. 4). This indicated that CH4 was affected by the rate of biochar amendment. The cumulative CH4 uptake during the UT season in the B80 treatment was −8.5 kg·ha−1, which was significantly greater than the values obtained for the B0 and B10 treatments (Fig. 5a). The cumulative CH4 emission during the SR season in B0 was 159.3 kg·ha−1, which was significantly higher than the values obtained from other treatments (Fig. 5b). Compared to N2O, the cumulative CH4 uptake during the UT season increased with increasing rates of biochar amendment (Fig. 3c). The cumulative CH4 emission during the SR season decreased with an increasing rate of biochar application (Fig. 3d).
Figure 4.
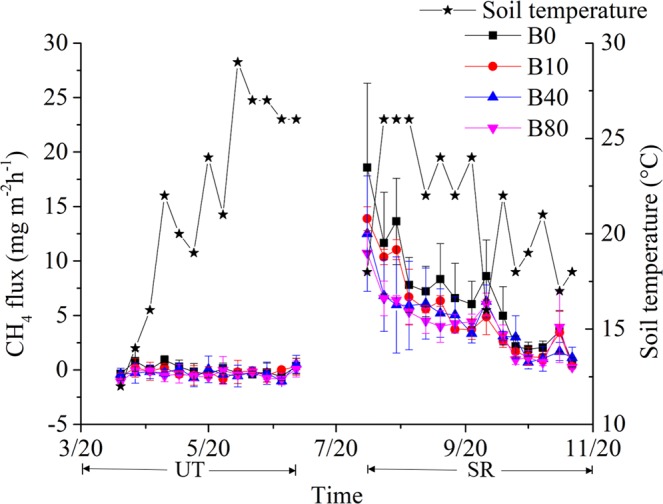
Temporal pattern of CH4 fluxes for the different treatments during the tobacco and rice growth periods. The period from 3/20 (MM/DD) to 7/20 was the unsaturated tobacco growth season (UT), and the period from 7/20 to 11/20 was the saturated rice growth season (SR); B0, B10, B40 and B80 are no biochar applied and biochar applied at the rate of 10, 40 and 80 t·ha−1, respectively.
Figure 5.
Cumulative CH4 uptake during the tobacco growth season (a) and CH4 emissions during the rice growth period (b). Values with the same letter are not significantly different (p < 0.05); B0, B10, B40 and B80 are no biochar applied and biochar applied at the rate of 10, 40 and 80 t·ha−1, respectively. Positive values of CH4 flux are CH4 emission, and negative values are CH4 uptake.
Soil 16Sr DNA and pmoA abundance
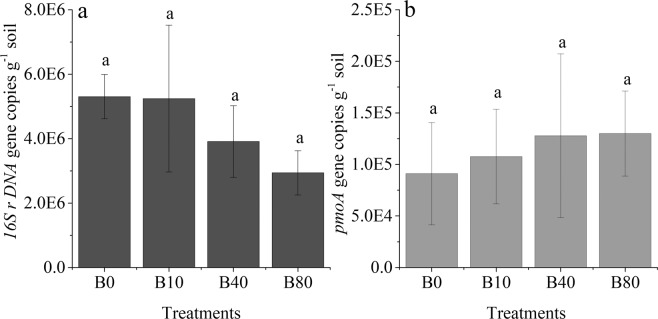
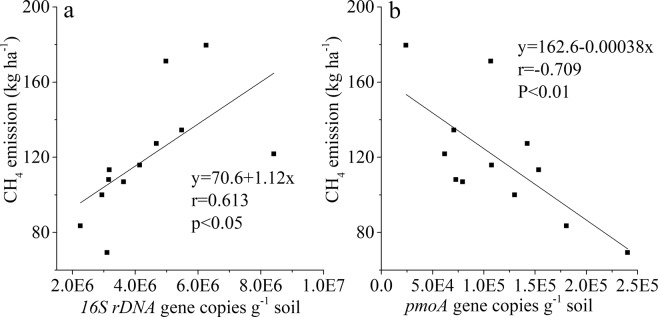
Methanogenic archaea 16Sr DNA and methanotroph pmoA gene copy numbers were determined after the rice harvest. Figure 6 shows that the methanogenic archaea 16Sr DNA gene copy number in the B0 treatment was 5.3 × 10⁶ copies·g−1 soil; this decreased with biochar application, but there were no significant differences at p ≤ 0.05 due to large variations in the same treatments. The highest methanotroph pmoA gene copy numbers were found in the B80 treatment, and the lowest was found in the B0 treatment, with no significant difference recorded among the different treatments (Fig. 6). The cumulative CH4 emission during the SR season significantly increased with the methanogenic archaea 16Sr DNA gene copy number and decreased significantly with the methanotroph pmoA gene copy number (Fig. 7).
Figure 6.
Methanogenic archaea 16Sr DNA gene (a) and methanotroph pmoA gene (b) copy numbers in the rice growth period. Values with the same letter are not significantly different (p < 0.05); B0, B10, B40 and B80 are no biochar applied and biochar applied at the rate of 10, 40 and 80 t·ha−1, respectively.
Figure 7.
Relationship between the amount of CH4 emission during the rice growth period and methanogenic archaea 16Sr DNA gene (a) and methanotroph pmoA gene (b) copy numbers.
Discussion
N2O emissions decreased with the rate of biochar application in both the UT and SR seasons
In contrast to our hypothesis that amendment with biochar may not reduce the N2O emission rate in acidic soil. We observed that N2O emissions decreased with the biochar application rate in both the UT and SR seasons (Fig. 3a,b). In line with the finding of Cayuela et al.26, there was a direct negative correlation between the rate of biochar application and N2O emission reductions. Both nitrification and denitrification have been identified as the predominant pathways for N2O production. It has been reported that biochar mitigation of N2O emissions via nitrification may be due to improvements in soil biological properties, physical properties, and chemical properties11,20. Furthermore, reducing nitrification substrate by NH4+ adsorption and the inhibition of potential microbial metabolic pathways (e.g. various polyphenolic and monoterpene compounds) play important roles in inhibiting nitrification and subsequent N2O emission27,28. Zhang et al.29 and Fidel et al.30 reported that amendment with biochar produced at 400 and 600 °C increased the NH4+ adsorption capacity by 62–81% and was maximized with low pyrolysis temperature (400 °C), leading to a significant decrease in soil inorganic N. The biochar used in our experiment was produced at 450 °C; thus, the adsorptive capacity for NH4+ related to nitrification could be a key factor in mitigating N2O emissions.
There are several mechanisms that have been suggested to explain the reasons for biochar mitigation of N2O emissions via denitrification. These mechanisms include NO3− immobilization, aeration regulation and biochar toxicity31. It has been reported that adsorption and retention of NH4+ are improved in soils amended with biochar, indirectly leading to reductions in the amount of available N for denitrification, which is considered one of the important reasons for reducing N2O emissions via denitrification by biochar-amended soils32. Additionally, biochar has been proposed as a reducing agent for soils containing redox-reactive Fe(III) and Mn(IV) to compete with NO3−, reducing denitrification and promoting the reduction of N2O to N233.
It has been reported that biochar can reduce the abundance of nitrite-reducing bacteria (carrying the nirK and nirS genes) but also increase the abundance of N2O-reducing bacteria (carrying the nosZ gene); thus, the mitigation of N2O emissions by biochar may be attributed to the fact that biochar can inhibit N2O production and simultaneously promote N2O consumption14,34,35. The reduction of N2O to N2 in the last step of denitrification may be improved, which would lead to a decrease in the N2O emission rate13. However, work performed by Ameloot et al.36 showed that a reduction in the N2O/(N2O + N2) ratio was not observed via the acetylene inhibition method, which suggested that biochar did not stimulate nosZ and the reduction of N2O to N2. These contradictory phenomena may be attributed to soil and biochar properties. It has been reported that biochar predominantly promotes the last step of denitrification in fine-textured soil32. In acidic soil, the abundance of nitrite-reducing bacteria and N2O-reducing bacteria increases as the soil pH is increased37. This may not only enhance the reduction of NO3− to N2O but will also lead to stronger and more complete N2O reduction to N2, culminating in a balance in soil N2O emissions. Additionally, Cayula et al.33,38 suggested that the effect of biochar on the denitrification of N2O was mostly depend on its pH and the ratios of C/N and H/Corg.
In our observations, the soil pH was increased by biochar in the UT season from 5.4 to 6.1, whereas in the SR season, the pH returned to the initial range of values between 5.2 and 5.6 (Table 1). This was an indication that the addition of biochar to the soil had a rapid effect on soil pH, and this observation is in line with the findings of Castaldi et al.39. They reported that soil pH was significantly higher in soils treated with char incorporation than the control; however, the effect of biochar on pH was transient within the first three months, and the pH later returned to the initial value after 14 months39. As the soil pH was increased by biochar application, the cumulative N2O emissions from the treatments with different rates of biochar application were not significantly different because the inhibition of N2O emissions by biochar was likely offset by the stimulated pH increase.
Biochar decreased CH4 emissions and increased CH4 uptake in the UT season and SR season
In contrast to our hypothesis that biochar would decrease CH4 emission in the first season and not in the second season, biochar decreased CH4 emissions in the second cropping (SR season). Similarly, Feng et al.22 and Chen et al.40 also observed a decline in CH4 flux following biochar application in paddy soils and suggested that the effects of biochar on CH4 emission were long-lived. However, contrary to this finding, Zhang et al.41 reported that CH4 emission was increased after biochar was added to paddies, while Xie et al.42 reported that there was no significant difference in seasonal cumulative CH4 emission between treatments. In the present study, we observed that the abundances of methanogenic archaea in the paddy were decreased by biochar application, while the methanotroph abundances were increased after biochar was applied, although the differences were not significant due to the large variations in a given treatment (Fig. 7). This showed that biochar addition decreased CH4 emissions, which may be due to decreased methanogenic archaea abundance; hence, CH4 could be utilized by methanotrophs. Feng et al.22 reported that methanogenic archaea were not inhibited by biochar amendments but there was a decreased ratio of methanogenic to methanotrophic microorganisms in paddy soils. An increase in methanotrophic abundance implies that methanogenic activity is been stimulated under biochar amendment (Fig. 7).
Biochar improved the sink capacity for CH4 (Figs. 3c and 5a), which may be directly attributed to the decrease in the bulk density and soil aeration that occurred during the UT season (Table 1). Environments with a CH4 sink capacity are suitable for methanotroph growth; however, Fungo et al.11 reported that biochar reduced the sink capacity of CH4. They attributed this to the easily mineralizable C provided by biochar, which was a substitute for methanotrophic bacteria43. Biochar acts as a slow C release source, and the relationship between biochar and C mineralization is dependent on the production procedure of the biochar44. The chemical properties and the type of biomass used for pyrolysis may also have influenced soil C and N cycling45. Additionally, biochar has high porosity, which may be able to increase soil aerobic micro-sites, affecting aeration and improving the supply and distribution of CH4 and O246,47 When soil aeration increases as bulk density decreases (Table 1), the CH4 oxidation activity of methanotrophs is greatly enhanced, which results in CH4 emission mitigation22,48.
Conclusion
Biochar application affected soil pH in the short term during the tobacco cropping season; however, in the saturated rice growth season, the pH reverted back to the initial value. The available potassium and SOM contents were improved, and BD was decreased by biochar application during the tobacco and rice growth seasons. N2O flux during the UT season was significantly greater than that in the saturated rice growth season and decreased with the rate of biochar application. The soils were sinks for CH4, and the cumulative CH4 uptake was increased with the rate of biochar application in the tobacco cropping season. However, there was considerable CH4 flux during the rice growth season, and the cumulative CH4 emission decreased with an increased rate of biochar application. Cumulative CH4 emissions had a negative relationship with methanotroph pmoA gene copy numbers and a positive relationship with methanogenic archaea 16Sr DNA gene copy numbers in the soils, indicating that stimulating methanotrophs and depressing methanogenic archaea are the mechanisms for CH4 reduction upon biochar amendment. Therefore, to prevent environmental pollution and maintain the soil organic matter content, tobacco straw could be used as a biochar feedstock to reduce N2O and CH4 flux from soil. The rate of biochar application played important roles in N2O and CH4 flux, and further research should be conducted to study the relationship between biochar and the sink capacity for CH4.
Materials and Methods
Biochar production
Biochar was produced from dried tobacco straw; the straw was cut into small segments (<50 mm length) before being placed into the reactor. The reactor was heated by a step-wise procedure. The heating temperature was increased to 450 °C under anaerobic conditions and maintained for approximately 8 h. Before applying biochar to the field, the biochar was further reduced to smaller sizes of <5 mm. The concentrations of N, P, K, and organic C and pH (H2O) in the biochar were 15.0 g·kg−1, 1.4 g·kg−1, 20.1 g·kg−1, 475.92 g·kg−1 and 9.7, respectively.
Field site description
The field experiment was conducted in 2015 in Jinan County, Fujian Province, China (119°36′86″E, 26°17′33″N). The mean annual temperature and precipitation in this region are 18.3 °C and 1500 mm (over 30 years), respectively, and the region is characterized by a subtropical monsoon climate. The soil is defined as an Anthrosol (WRB Soil Taxonomy), and the average concentrations of SOM, total N (TN), total phosphorus (TP), total potassium (TK), alkali-hydrolysable nitrogen (Av. N), available phosphorus (Av. P), and Av. K and pH (H2O) were 25.6 g·kg−1, 1.4 g·kg−1, 0.7 g·kg−1, 20.0 g·kg−1, 181.4 mg·kg−1, 58.0 mg·kg−1, 443.0 mg·kg−1 and 5.3, respectively. The cropping sequence at the site was as follows: tobacco was planted in mid-March, then rice was planted in mid-July, for more than 15 years. The root and straw of tobacco were removed before tilling by machine. The treatments included three rates of biochar application and a control that did not receive any biochar amendment: no biochar applied (B0); biochar applied at the rate of 10 t·ha−1 (B10); biochar applied at the rate of 40 t·ha−1 (B40); and biochar applied at the rate of 80 t·ha−1 (B80). Three replicate plots (24 × 6 m) of each treatment were established in a randomized block design. The biochar was applied on 1st March 2015, before tobacco seedlings were transplanted. Except for the biochar, all treatments received N, P and K fertilizers at a recommended rate divided into three separate applications, which are given in Table 2. Compound fertilizers, urea and potassium nitrate were applied as N sources for tobacco; ammonium bicarbonate and urea were applied as N sources for rice.
Table 2.
Annual fertilizer application rates in the field experiment (kg·ha−1).
| Fertil- izers |
UT season | SR season | Total amount | ||||||||
|---|---|---|---|---|---|---|---|---|---|---|---|
| Base fertilizers | Seedling stage | Rosette stage | Vigorous growth stage | Total | Base fertilizers | Green stage | Tillering stage | Heading stage | Total | ||
| N | 104.4 | 3.9 | 7.6 | 11.5 | 127.5 | 66.7 | 66.2 | 16.6 | 16.6 | 166.0 | 293.5 |
| P2O5 | 97.0 | — | 1.0 | 1.0 | 99.0 | 29.9 | — | — | — | 29.9 | 128.9 |
| K2O | 266.4 | 13.3 | 23.3 | 74.2 | 377.2 | 36.0 | 36.0 | — | — | 72.0 | 449.2 |
UT is unsaturated tobacco cropping, and SR is saturated rice cropping.
CH4 and N2O emission monitoring
Greenhouse gas emissions were monitored using static closed chambers21. Gas samples were collected between 9 and 11 am in a 7-day interval during the UT and SR seasons. Two chambers (0.5 m × 0.5 m × (0.5 + x) m) were placed on a fixed steel frame (stainless) in each plot after transplanting in the tobacco and rice growing seasons. One tobacco or six rice plants were closed in the chamber, and the height of the chamber was increased according to the height of the plant (x = 0.5 m or 1.0 m). To seal the rim of the chamber with a level surface, a groove (50 mm depth) along the top edge of each steel frame was filled with water. To minimize air temperature variation inside the chamber during the sampling period, the chambers were wrapped with a layer of porous insulation and aluminium foil. A circulating fan, humidity meter and temperature meter were equipped inside each chamber. After chamber closure, a syringe was used to collect gas samples at 0, 20, 40, and 60 min throughout the UT season and at 0, 10, 20, and 30 min during the SR season. The concentrations of N2O and CH4 were simultaneously analysed by a gas chromatograph (Agilent 7890B, USA), which was equipped with an electron capture detector (ECD) for N2O and a flame ionization detector (FID) for CH4 analysis21.
Soil samples
Soil samples were collected before the experiment and after the tobacco and rice had been harvested for property analyses. Soil organic matter was analysed by wet digestion with H2SO4-K2Cr2O7, and total N was analysed using semi-micro Kjeldahl digestion with Se, CuSO4 and K2SO4 as catalysts49. A pH detector (Quark Ltd, Nanjing, China) was used to measure soil pH with a ratio of soil to water of 1:2.5 (w/v). Soil BD was analysed via the cutting ring method. Soil TP and TK were determined by the colorimetric and flame photometer methods after wet digestion with a mixture of H2SO4 and HClO4 and a mixture of HF and HClO4, respectively50. Soil Av. N was diffused with 1.0 mol·L−1 NaOH and trapped with 0.32 mol·L−1 H3BO3. Soil Av. P was extracted with a mixture of 0.025 mol·L−1 HCl and 0.03 mol·L−1 NH4F, while soil Av. K was determined by the 1.0 mol L−1 CH3COONH4 extraction method51,52.
A PowerSoil® DNA Isolation kit (MO BIO Laboratories, Inc., Carlsbad, USA) was used to extract DNA from 0.25 g fresh soil following the manufacturer’s instructions. The quality and quantity of DNA were checked by a NanoDrop spectrophotometer (NanoDrop Technologies Inc., Wilmington, USA). The copy number of methanogenic archaea 16Sr DNA genes and methanotroph pmoA genes were enumerated by quantitative PCR using primer sets 1106 F/1378R53 and A189/m66122 with a CFX96 Optical Real-Time Detection System (Bio-Rad Laboratories, Inc. Hercules, CA). The qPCR standard was produced by plasmid DNA from representative clones including the methanogenic archaea 16Sr DNA gene and methanotroph pmoA gene. The 25.0 µL reaction mixture contained 12.5 µL of SYBR Premix Ex Taq (TaKaRa Biotech, Dalian), 1.0 µL of each primer, 0.5 μL Rox Reference Dye II (50×), and 1.0 µL template. The thermal conditions of quantitative PCR for the methanogenic archaea 16Sr DNA genes and methanotroph pmoA genes were those given by Feng et al.22 and Watanabe et al.53. Specific amplification of the 16Sr DNA and pmoA genes was checked by confirming a single peak in melting-curve analysis. Copy numbers of genes are reported per dry weight of soil.
Calculation
The rates of GHG emission from soil were calculated using Eq. (1), as follows:
| 1 |
where F is the CH4 or N2O emission rate from soil (mg·m−2·h−1), ρ is the density of CH4 or N2O under standard atmospheric pressure (0.714 and 1.96 kg·m−3, respectively), h is the height of the static closed chambers (m), dc/dt is the rate of change in CH4 or N2O concentration, T is the temperature inside the chamber (°C), and t is the time of chamber closure (h).
The amounts of CH4 and N2O emissions were calculated using Eq. (2), as follows:
| 2 |
where C is the amount of CH4 or N2O emission (kg·ha−1), Fi and Fi + 1 are the CH4 or N2O emission rates at times i and i + 1, respectively (mg·m−2·h−1), and D is the number of days between times i and i + 1.
Statistical analysis
The differences in the rates and amounts of CH4 and N2O emissions and soil properties were examined by one-way ANOVA. The significant differences among treatments were identified by Duncan’s test (where p < 0.05).
Acknowledgements
This work was supported by grants from the National Natural Science Foundation of China (41771330, 41401339, 41907077), the Natural Science Foundation of Fujian Province (2016J01179, 2018J01058, 2019J01104, 2019J01105), the Basic Scientific Foundation of Public Service Research Institutes of Fujian province (2019R1025-1), Foundation of Fujian Academic of Agricultural Sciences and tobacco company ([2013]031), the project of China Scholarship Council (201809350003), and Foundation of Fujian Academic of Agricultural Sciences (YC2015-6, AB2017-2, SIIT2017-1-9).
Author contributions
Y.H. wrote the main manuscript. C.W., C.L., Y.Z., X.C., L.T. did the field experiment. C.L. and Q.C. analyzed samples. M.O. and T.S. analyzed data. All reviewed and commented on the paper.
Competing interests
The authors declare no competing interests.
Footnotes
Publisher’s note Springer Nature remains neutral with regard to jurisdictional claims in published maps and institutional affiliations.
References
- 1.Smith K, et al. Exchange of greenhouse gases between soil and atmosphere: interactions of soil physical factors and biological processes. Eur J Soil Sci. 2003;54:779–791. doi: 10.1046/j.1351-0754.2003.0567.x. [DOI] [Google Scholar]
- 2.IPCC. Climate change 2014: synthesis report. Contribution of Working Groups I, II and III to the fifth assessment report of the Intergovernmental Panel on Climate Change, IPCC (2014).
- 3.Xiang J, Liu D, Ding W, Yuan J, Lin Y. Effects of biochar on nitrous oxide and nitric oxide emissions from paddy field during the wheat growth season. J Clean Prod. 2015;104:52–58. doi: 10.1016/j.jclepro.2014.12.038. [DOI] [Google Scholar]
- 4.Thauer RK. Biochemistry of methanogenesis: A tribute to Marjory Stephenson: 1998 Marjory Stephenson prize lecture. Microbiology. 1998;144:2377–2406. doi: 10.1099/00221287-144-9-2377. [DOI] [PubMed] [Google Scholar]
- 5.Gao JJ, et al. Greenhouse gas emissions reduction in different economic sectors: Mitigation measures, health co-benefits, knowledge gaps, and policy implications. Environ Pollut. 2018;240:683–698. doi: 10.1016/j.envpol.2018.05.011. [DOI] [PubMed] [Google Scholar]
- 6.Beesley L, et al. A review of biochars’ potential role in the remediation, revegetation and restoration of contaminated soils. Environ Pollut. 2011;159(12):3269–3282. doi: 10.1016/j.envpol.2011.07.023. [DOI] [PubMed] [Google Scholar]
- 7.Chan ASK, Parkin TB. Methane oxidation and production activity in soils from natural and agricultural ecosystems. J Environ Qual. 2001;30:1896–1903. doi: 10.2134/jeq2001.1896. [DOI] [PubMed] [Google Scholar]
- 8.Jeffery S, Verheijen FG, Kammann C, Abalos D. Biochar effects on methane emissions from soils: A meta-analysis. Soil Biol Biochem. 2016;101:251–258. doi: 10.1016/j.soilbio.2016.07.021. [DOI] [Google Scholar]
- 9.Liu Q, et al. How does biochar influence soil N cycle? A meta-analysis. Plant soil. 2018;426(1-2):211–225. doi: 10.1007/s11104-018-3619-4. [DOI] [Google Scholar]
- 10.Fungo B, et al. Emissions intensity and carbon stocks of a tropical Ultisol after amendment with Tithonia green manure, urea and biochar. Field Crop Res. 2017;209:179–188. doi: 10.1016/j.fcr.2017.05.013. [DOI] [PMC free article] [PubMed] [Google Scholar]
- 11.Lehmann J. Bio-energy in the black. Front Ecol Environ. 2007;5:381–387. doi: 10.1890/1540-9295(2007)5[381:BITB]2.0.CO;2. [DOI] [Google Scholar]
- 12.McMillan AM, et al. Can pH amendments in grazed pastures help reduce N2O emissions from denitrification?–The effects of liming and urine addition on the completion of denitrification in fluvial and volcanic soils. Soil Biol Biochem. 2016;93:90–104. doi: 10.1016/j.soilbio.2015.10.013. [DOI] [Google Scholar]
- 13.Richardson D, Felgate H, Watmough N, Thomson A, Baggs E. Mitigating release of the potent greenhouse gas N2O from the nitrogen cycle–could enzymic regulation hold the key? Trends Biotechnol. 2009;27:388–397. doi: 10.1016/j.tibtech.2009.03.009. [DOI] [PubMed] [Google Scholar]
- 14.Wang C, et al. Insight into the effects of biochar on manure composting: Evidence supporting the relationship between N2O emission and denitrifying community. Environ Sci Technol. 2013;47:7341–7349. doi: 10.1021/es305293h. [DOI] [PubMed] [Google Scholar]
- 15.Conrad R. Microbial ecology of methanogens and methanotrophs. Adv Agron. 2007;96:1–63. doi: 10.1016/S0065-2113(07)96005-8. [DOI] [Google Scholar]
- 16.Powlson DS, Goulding KWT, Willison TW, Webster CP, Hütsch BW. The effect of agriculture on methane oxidation in soil. Nutr Cycl Agroecosys. 1997;49:59–70. doi: 10.1023/A:1009704226554. [DOI] [Google Scholar]
- 17.Pratscher J, Dumont MG, Conrad R. Assimilation of acetate by the putative atmospheric methane oxidizers belonging to the USCα clade. Environ Microbiol. 2011;13:2692–2701. doi: 10.1111/j.1462-2920.2011.02537.x. [DOI] [PubMed] [Google Scholar]
- 18.Knief, C. Diversity and habitat preferences of cultivated and uncultivated aerobic methanotrophic bacteria evaluated based on pmoA as molecular marker. Front Microbiol, 10.3389/fmicb.2015.01346 (2015). [DOI] [PMC free article] [PubMed]
- 19.Yaghoubi, P., Yargicoglu, E. N. & Reddy, K. R. Effects of Biochar-Amendment to Landfill Cover Soil on Microbial Methane Oxidation: Initial Results. In Geo-Congress 2014: Geo-characterization and Modeling for Sustainability pp.1849–1858 (2014).
- 20.Van ZL, et al. A glasshouse study on the interaction of low mineral ash biochar with nitrogen in a sandy soil. Soil Res. 2010;48:569–576. doi: 10.1071/SR10003. [DOI] [Google Scholar]
- 21.Zou Jianwen, Huang Yao, Jiang Jingyan, Zheng Xunhua, Sass Ronald L. A 3-year field measurement of methane and nitrous oxide emissions from rice paddies in China: Effects of water regime, crop residue, and fertilizer application. Global Biogeochemical Cycles. 2005;19(2):n/a-n/a. doi: 10.1029/2004GB002401. [DOI] [Google Scholar]
- 22.Feng Y, Xu Y, Yu Y, Xie Z, Lin X. Mechanisms of biochar decreasing methane emission from Chinese paddy soils. Soil Biol Biochem. 2012;46:80–88. doi: 10.1016/j.soilbio.2011.11.016. [DOI] [Google Scholar]
- 23.Wang J, Pan X, Liu Y, Zhang X, Xiong Z. Effects of biochar amendment in two soils on greenhouse gas emissions and crop production. Plant Soil. 2012;360:287–298. doi: 10.1007/s11104-012-1250-3. [DOI] [Google Scholar]
- 24.Lentz RD, Ippolito JA, Spokas KA. Biochar and manure effects on net nitrogen mineralization and greenhouse gas emissions from calcareous soil under corn. Soil Sci Soc Am J. 2014;78:1641–1655. doi: 10.2136/sssaj2014.05.0198. [DOI] [Google Scholar]
- 25.Spokas KA. Impact of biochar field aging on laboratory greenhouse gas production potentials. GCB Bioenergy. 2013;5:165–176. doi: 10.1111/gcbb.12005. [DOI] [Google Scholar]
- 26.Cayuela ML, et al. Biochar’s role in mitigating soil nitrous oxide emissions: A review and meta-analysis. Agr Ecosyst Environ. 2014;191:5–16. doi: 10.1016/j.agee.2013.10.009. [DOI] [Google Scholar]
- 27.Ball PN, MacKenzie MD, DeLuca TH, Montana WE. Wildfire and charcoal enhance nitrification and ammonium-oxidizing bacterial abundance in dry montane forest soils. J Environ Qual. 2010;39:1243–1253. doi: 10.2134/jeq2009.0082. [DOI] [PubMed] [Google Scholar]
- 28.Taghizadeh-Toosi A, Clough TJ, Sherlock RR, Condron LM. A wood based low-temperature biochar captures NH3-N generated from ruminant urine-N, retaining its bioavailability. Plant Soil. 2012;353:73–84. doi: 10.1007/s11104-011-1010-9. [DOI] [Google Scholar]
- 29.Zhang H, Voroney RP, Price GW. Effects of temperature and processing conditions on biochar chemical properties and their influence on soil C and N transformations. Soil Biol Biochem. 2015;83:19–28. doi: 10.1016/j.soilbio.2015.01.006. [DOI] [Google Scholar]
- 30.Yuan Y, et al. Is biochar-manure co-compost a better solution for soil health improvement and N2O emissions mitigation? Soil Biol Biochem. 2017;113:14–25. doi: 10.1016/j.soilbio.2017.05.025. [DOI] [PMC free article] [PubMed] [Google Scholar]
- 31.Singh BP, Hatton BJ, Singh B, Cowie AL, Kathuria A. Influence of biochars on nitrous oxide emission and nitrogen leaching from two contrasting soils. J Environ Qual. 2010;39:1224–1235. doi: 10.2134/jeq2009.0138. [DOI] [PubMed] [Google Scholar]
- 32.Cayuela, M. L. et al. Biochar and denitrification in soils: when, how much and why does biochar reduce N2O emissions? Sci Rep-UK, 10.1038/srep01732 (2013). [DOI] [PMC free article] [PubMed]
- 33.Harter J, et al. Linking N2O emissions from biochar-amended soil to the structure and function of the N-cycling microbial community. ISME J. 2014;8:660–674. doi: 10.1038/ismej.2013.160. [DOI] [PMC free article] [PubMed] [Google Scholar]
- 34.Li, S., et al. Linking N2O emission from biochar-amended composting process to the abundance of denitrify (nirK and nosZ) bacteria community. AMB Express6(1), 37. 6, 37 (2016). [DOI] [PMC free article] [PubMed]
- 35.Ameloot N, Maenhout P, Neve SD, Sleutel S. Biochar-induced N2O emission reductions after field incorporation in a loam soil. Geoderma. 2016;267:10–16. doi: 10.1016/j.geoderma.2015.12.016. [DOI] [Google Scholar]
- 36.Saarnio S, Heimonen K, Kettunen R. Biochar addition indirectly affects N2O emissions via soil moisture and plant N uptake. Soil Biol Biochem. 2013;58:99–106. doi: 10.1016/j.soilbio.2012.10.035. [DOI] [Google Scholar]
- 37.Liu Q, et al. Can biochar alleviate soil compaction stress on wheat growth and mitigate soil N2O emissions? Soil Biol Biochem. 2017;104:8–17. doi: 10.1016/j.soilbio.2016.10.006. [DOI] [Google Scholar]
- 38.Cayuela ML, Jeffery S, van Zwieten L. The molar H:Corg ratio of biochar is a key factor in mitigating N2O emissions from soil. Agr Ecosyst Environ. 2015;202:135–138. doi: 10.1016/j.agee.2014.12.015. [DOI] [Google Scholar]
- 39.Castaldi S, et al. Impact of biochar application to a Mediterranean wheat crop on soil microbial activity and greenhouse gas fluxes. Chemosphere. 2011;85:1464–1471. doi: 10.1016/j.chemosphere.2011.08.031. [DOI] [PubMed] [Google Scholar]
- 40.Chen D, Wang C, Shen JL, Li Y, Wu JS. Response of CH4 emissions to straw and biochar applications in double-rice cropping systems: Insights from observations and modeling. Environ Pollut. 2018;235:95–103. doi: 10.1016/j.envpol.2017.12.041. [DOI] [PubMed] [Google Scholar]
- 41.Zhang A, et al. Effect of biochar amendment on yield and methane and nitrous oxide emissions from a rice paddy from Tai Lake plain, China. Agr Ecosyst Environ. 2010;139:469–475. doi: 10.1016/j.agee.2010.09.003. [DOI] [Google Scholar]
- 42.Xie Z, et al. Impact of biochar application on nitrogen nutrition of rice, greenhouse-gas emissions and soil organic carbon dynamics in two paddy soils of China. Plant Soil. 2013;370:527–540. doi: 10.1007/s11104-013-1636-x. [DOI] [Google Scholar]
- 43.Knoblauch C, Maarifat AA, Pfeiffer EM, Haefele SM. Degradability of black carbon and its impact on trace gas fluxes and carbon turnover in paddy soils. Soil Biol Biochem. 2011;43:1768–1778. doi: 10.1016/j.soilbio.2010.07.012. [DOI] [Google Scholar]
- 44.Wardle DA, Nilsson MC, Zackrisson O. Fire-derived charcoal causes loss of forest humus. Science. 2008;320:629–629. doi: 10.1126/science.1154960. [DOI] [PubMed] [Google Scholar]
- 45.Lehmann J. A handful of carbon. Nature. 2007;447:143–144. doi: 10.1038/447143a. [DOI] [PubMed] [Google Scholar]
- 46.Sadasivam BY, Reddy KR. Adsorption and transport of methane in landfill cover soil amended with waste-wood biochars. J Environ Manage. 2015;158:11–23. doi: 10.1016/j.jenvman.2015.04.032. [DOI] [PubMed] [Google Scholar]
- 47.Hardie M, Clothier B, Bound S, Oliver G, Close D. Does biochar influence soil physical properties and soil water availability? Plant soil. 2014;376:347–361. doi: 10.1007/s11104-013-1980-x. [DOI] [Google Scholar]
- 48.Van Elsas JD, Bailey MJ. The ecology of transfer of mobile genetic elements. FEMS microbiol. Ecol. 2002;42:187–197. doi: 10.1111/j.1574-6941.2002.tb01008.x. [DOI] [PubMed] [Google Scholar]
- 49.Nelson, D. W. & Sommers, L. E. Total carbon, organic carbon, and organic matter. In: Sparks DL (Ed) Methods of soil analysis. Part 3. Chemical methods. Soil Science Society of America, American Society of Agronomy, Madison, Wisconsin, pp 961-1010 (1996).
- 50.Jackson, M. L. R. Soil Chemical Analysis. Prentice-Hall, Inc., Englewood Cliffs, New York (1958).
- 51.Bray RH. Determination of total, organic, and available forms of phosphorus in soils. Soil Sci. 1945;59:39–45. doi: 10.1097/00010694-194501000-00006. [DOI] [Google Scholar]
- 52.Jones JB. Soil testing in the United States. Commun Soil Sci Plan. 1973;4:307–322. doi: 10.1080/00103627309366451. [DOI] [Google Scholar]
- 53.Watanabe T, Kimura M, Asakawa S. Community structure of methanogenic archaea in paddy field soil under double cropping (rice–wheat) Soil Biol Biochem. 2006;38:1264–1274. doi: 10.1016/j.soilbio.2005.09.020. [DOI] [Google Scholar]


