

Abstract
We performed a bench (BS) and human (HS) study to test the hypothesis that estimation of tidal volume (VT) during noninvasive helmet pressure support ventilation (nHPSV) would be possible using a turbine driven ventilator (TDV) coupled with an intentional leak single-limb vented circuit. During the BS a mannequin was connected to a lung simulator (LS) and at different conditions of respiratory mechanics, positive end expiratory pressure (PEEP) levels and leaks (30, 50 and 80 L/min). All differences were within the 95% limits of agreement (LoA) in all conditions in the Bland-Altman plot. The overall bias (difference between VT measured by TDV and LS) was 35 ml (95% LoA 10 to 57 ml), 15 ml (95% LoA −40 to 70 ml), 141 ml (95% LoA 109 to 173 ml) in the normal, restrictive and obstructive conditions. The bias at different leaks flow in normal condition was 29 ml (95% LoA 19 to 38 ml). In the HS four healthy volunteers using nHPSV had a pneumotachograph (P) inserted through a mouthpiece to measure subject’s VT.The bias showed a scarce clinical relevance. In conclusions, VT estimation seems to be feasible and accurate in all conditions but the obstructive one. Additional leaks seem not to affect VT reliability.
Subject terms: Therapeutics, Preclinical research
Introduction
Noninvasive ventilation (NIV) is widely used worldwide to support ventilation and oxygenation in patients with respiratory failure1. The helmet is an interface that may increase comfort, reduce skin breakdown, and increase success rate during noninvasive helmet pressure support ventilation (nHPSV) compared to face mask1–7.
Measurement of tidal volume (VT) still remains an unresolved issue during nHPSV due to the mechanical properties of the helmet4,6,8–10. The availability to assess VT during nHPSV might be of importance because it was previously found that high VT during noninvasive ventilation (NIV) in hypoxemic patients may increase lung injury11–13. Nevertheless, no study has shown the possibility to assess VT during nHPSV.
Intentional leak single-limb vented circuit configuration allows during face mask or nasal ventilation to make an estimation of the delivered VT in all bi-level ventilators as well as in some intensive care unit (ICU) ventilators mainly dedicated for NIV use14–16.
We hypothesized that a turbine driven ventilator (TDV) coupled with intentional leak single-limb vented circuit and whose leak location is set at the helmet expiratory port would allow to estimate patient’s VT during nHPSV15,16. The aim of the present study was to test this hypothesis on a bench and healthy volunteer study.
Methods
The Ethics Committee approved the study protocol (Comitato Etico Palermo 1 – Approval number 07/2018). All experiments were performed in accordance with relevant guidelines and regulations. The study was performed at the Simulation Lab of the Department of Surgical, Oncological and Oral Science (Di.Chir.On.S.), Section of Anesthesia, Analgesia, Intensive Care and Emergency, Policlinico Paolo Giaccone, University of Palermo, Italy.
Materials and settings
Bench study
A modified mannequin head (LaerdalMedical AS, Stavanger, Norway) was connected to a lung simulator (LS) (ASL 5000; Ingmar Medical, Pittsburgh, PA, USA). The ASL 5000 is a digital controlled real-time breathing lung simulator, which allows creating various types of spontaneous breathing pattern and different conditions of respiratory mechanics (e.g. normal, restrictive or obstructive condition). Its functioning is based on a direct-drive screw-driven piston, which moves inside a cylinder according to the equation of motion of an active respiratory mechanics system17. Its settings during the bench study, using a single-compartment model, was as follows:
(1) Normal condition: resistance 4 cmH2O/L/s, compliance 60 mL/cmH2O, inspiratory muscle pressure (Pmus) -5 cmH2O (semisinusoidal waveform with rise time of 25%, inspiratory hold of 5%, release time of 25%) and LS respiratory rate set at 15 breaths/min;
(2) Obstructive condition: resistance 15 cmH2O/L/s, compliance 80 mL/cmH2O, Pmus -12 cmH2O (semisinusoidal waveform with rise time of 20%, inspiratory hold of 5%, release time of 30%) and LS respiratory rate set at 25 breaths/min;
(2) Restrictive condition: resistance 7.5 mH2O/L/s, compliance 30 mL/cmH2O, Pmus -12 cmH2O (semisinusoidal waveform with rise time of 25%, inspiratory hold of 5%, and release time of 25%), and LS respiratory rate set at 30 breaths/min.
The mannequin head was connected to the LS through the mannequin’s trachea after having positioned and secured a helmet (Castar, Next Intesurgical, size small, Mirandola, Italy)18. The helmet inspiratory port was connected to the TDV (Bellavista 100 ICU, Buches, Switzerland) via a single-limb circuit while the expiratory port was closed with a cap having a 5.5 mm hole to allow the intentional leak. This configuration was not provided with any type of inspiratory or expiratory valves and carbon dioxide flushes, as a function of mask pressure through an intentional leak port set in the circuit or in the interface itself. Neither inspiratory nor expiratory VT is measured but they are estimated taking into account the leak according to a mathematical leak model as a function of mask pressure. This mathematical model is used to make an estimation the instantaneous leak and flow which are subtracted from the total flow output of the ventilator (which is the only measured flow) to calculate VT19. Figure 1 shows the set-up.
Figure 1.

Schematic representation of the experimental set up in the healthy volunteer (A) and in the bench study (B). Authors’ own figure.
During nHPSV, the ventilator was set at the fastest pressure rise time, cycling-off flow threshold of 25% in the normal and restrictive condition and 40% in the obstructive one. Inspiratory flow trigger initially set at 2 L/min was then always tuned at the lowest value not determining auto-triggering20. Inspiratory pressure above positive end expiratory pressure (PEEP) was set to reach a VT of about 300/500 ml in all conditions and did not change throughout each condition. Each condition was simulated at PEEP of 5, 8, 10 cmH2O. PEEP 12 cmH2O was only used in the restrictive condition. During nHPSV leaks were avoided by accurately fit the helmet to the mannequin’s neck. During normal condition at PEEP 8 cmH2O and inspiratory pressure (above PEEP) 0 cmH2O we also tested the reliability of VT estimation at different leak flows (30, 50 and 80 L/min) using a calibrated hole. During normal condition at PEEP 8 cmH2O we also tested the reliability of VT estimation at different leak flows (30, 50 and 80 L/min) using a calibrated hole.
Healthy volunteers study
After approval from our Institutional Ethics Committee (Comitato Etico Palermo 1 – approval N° 07/2018) and after obtaining written informed consent, four healthy volunteers, 1 female, 3 male, mean age 33 ± 4 years, mean body weight 70 ± 15 kg were ventilated in nHPSV (PSV 8 cmH2O and PEEP 8 cmH2O) via a helmet (Castar, Next Intesurgical, size small or medium, Mirandola, Italy), using the same TDV configuration used in the bench study. all experiments were performed in accordance with relevant guidelines and regulations. A mouthpiece was inserted in the volunteer’s mouth and connected to pneumotachograph (P) (VT mobile FLUKE, Germany) to measure subject’s airflow and VT. A nose clip was positioned on volunteer’s nostrils to avoid leaks from the nose. The set-up is showed in Fig. 1. All the healthy volunteers were trained, using a metronome, to maintain an imposed respiratory rate of about 12/15 breaths per minute20. During nHPSV, ventilator was set at the fastest pressure rise time and at cycling-off flow threshold of 25%. Inspiratory flow trigger was set at the lowest value not determining autotriggering starting from 2 L/min. During nHPSV, leaks were accurately avoided choosing the right helmet size and by appropriately fitting the helmet to the volunteer’s neck.
Measurements
Bench study
Data were collected by the TDV and by LS software. Airflow (V.), the airway pressure (Paw), PEEP as well as the VT and respiratory rate delivered to mannequin were collected over 3 minutes. Differences in VT between TDV and LS were compared during the last 20 breaths of each trial to ensure the stability of the system across settings modification (e.g. increasing, mechanical pattern and pressure level)16. During the test at different leak flows, each measurement was performed after 1 minutes after the institution of the new leak to let the TDV to adapt to the new setting. Autotriggering was determined as a mechanical insufflation in absence of inspiratory effort on the LS17.
Healthy volunteers
Each experimental condition was maintained for 3 minutes, to ensure the stability of the system across the modification of settings (e.g. increasing leak, respiratory pattern)16. Paw, PEEP obtained from the TDV and VT and respiratory rate of both TDV software and pneumotacograph (P) were collected. VT measured by TDV and P were compared during the last 20 breaths of each trial.
Statistical analysis
Normality of data distribution was checked graphically and by D’Agostino-Pearson test. Data are expressed as mean ± standard deviation (SD) or as median and interquartile range (IQR) when appropriate. Bland-Altman graphs were used to plot differences between the VT from the TDV and LS against the average of the two measurements.
Bland-Altman plot is the standard graphical statistical method to evaluate the agreement between quantitative measurements from two different devices, assays or raters. Bland-Altman plots reported the bias (defined as the average of the differences between measurements) and 95% limit of agreements (LoA), namely ± 1.96 SD of the bias21. We assumed as clinically relevant a difference of >15% of the LS.
Differences between VT (TDV-LS) at different PEEP levels or leaks were compared using ANOVA for repeated measures and Student-Newman-Keus test was used for all pairwise comparisons. Paired sampled t-test was used to compare VT measured by V and P in the healthy volunteers. P values < 0.05 were considered statistically significant. We used Prism 7 (GraphPad software; San Diego, CA) and Microsoft Excel (version 2013; Microsoft corporation, Redmond, CA).
Results
Bench study
Normal, restrictive, obstructive condition
The level of nHPSV to reach the default VT was 8, 10 and 12 cmH2O respectively in the normal, restrictive and obstructive condition.
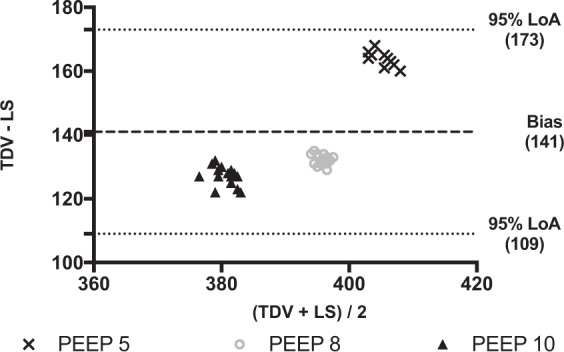
Differences in VT between TDV and LS at different levels of PEEP and pairwise comparisons are shown in Table 1. All plotted differences were within the 95% LoA in all conditions. The overall bias was 35 ml (95% LoA 10 to 57 ml), 15 ml (95% LoA -40 to 70 ml), 141 ml, (95% LoA 109 to 173 ml) respectively in the normal restrictive and obstructive conditions (Figs. 2–4). In the normal condition, the bias reached the least clinical relevance at PEEP 10 cmH2O (Fig. 2) while in the restrictive one at PEEP 10 and 12 cmH2O (Fig. 3). In the obstructive condition, the bias increased at PEEP 5 cmH2O (Fig. 4). Autotriggering was never detected. Tables S1–S3 in the supplementary file 1 reported average VT at different PEEP levels in the different simulated conditions.
Table 1.
Differences in tidal volumes (VT) measured by turbine driven ventilator and lung simulator at different levels of PEEP in the bench study.
| Simulated Condition | (TDV-LS) PEEP 5 cmH2O | (TDV-LS) PEEP 8 cmH2O | (TDV-LS) PEEP 10 cmH2O | (TDV-LS) PEEP 12 cmH2O | P value |
|---|---|---|---|---|---|
| Normal | 51 (3)°+ | 31.1(3.5)*+ | 21.8 (2)*° | <0.001 | |
| Restrictive | 61 (3)°+§ | 10,4 (1.3)*+§ | 1,1 (1.6)*°§ | −11,9 (1.9)*°+ | <0.001 |
| Obstructive | 164 (2)°+ | 132,5 (1.6)*+ | 127,3(3.1)*° | <0.001 |
Data are expressed in ml and reported as mean (±SD).
PEEP: positive end expiratory pressure; TDV: turbine driven ventilator; LS: lung simulator; (TDV-LS): difference between VT measurements by turbine driven ventilator and lung simulator.
*Different from 5; °different from 8, +different from 10, §different from 12.
Figure 2.
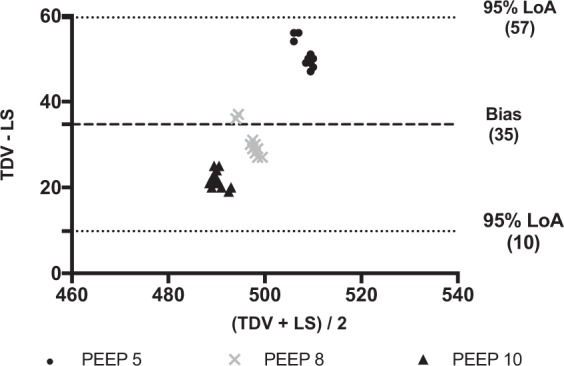
Bland-Altman plot of the differences between tidal volumes measured by the turbine driven ventilator and the lung simulator in the normal condition. Data are reported in ml. PEEP: Positive end expiratory pressure (values are expressed in cmH2O). TDV: Tidal volume (VT) measured by turbine driven ventilator; LS: Tidal volume (VT) measured by lung simulator. Average (x-axys): average of the two measurements; TDV – LS (y-axys): difference between mesurements. Bias: Average of the differences between measurements. 95% LoA: Limits of agreement (±1.96 standard deviation - SD - of the bias). All plotted differences are within the 95% LoA. In this plot, the overall bias is 35 ml, and 95% LoA are from 10 to 57 ml. It reaches the least clinical relevance at PEEP 10 cmH2O.
Figure 4.
Bland-Altman plot of the differences between tidal volume measured by the turbine driven ventilator and the lung simulator in the obstructive condition. Data are reported in ml. PEEP: Positive end expiratory pressure (values are expressed in cmH2O).TDV: tidal volume (VT) measured by turbine driven ventilator; LS: Tidal volume (VT) measured by lung simulator. Average (x-axys): average of the two measurements; TDV – LS (y-axys): difference between mesurements. Bias: Average of the differences between measurements. 95% LoA: Limits of agreement (±1.96 standard deviation - SD - of the bias). In this plot, the overall bias is 141 ml, and 95% LoA are from 109 to 173 ml. Although all plotted differences are within the 95% LoA, a large clinical relevance bias is found at all tested PEEP levels.
Figure 3.
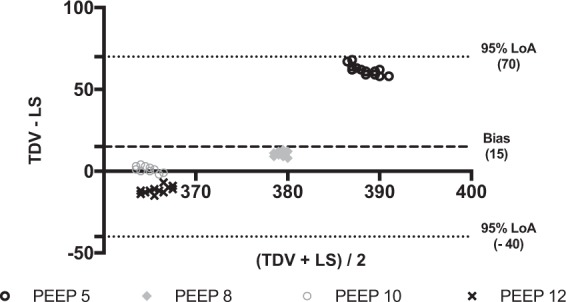
Bland-Altman plot of the differences between tidal volumes measured by the turbine driven ventilator and the lung simulator in the restrictive condition. Data are reported in ml. PEEP: Positive end expiratory pressure (values are expressed in cmH2O). TDV: Tidal volume (VT) measured by turbine driven ventilator; LS: Tidal volume (VT) measured by lung simulator. Average (x-axys): average of the two measurements; TDV – LS (y-axys): difference between mesurements. Bias: Average of the differences between measurements. 95% LoA: Limits of agreement (±1.96 standard deviation - SD - of the bias). In this plot, the overall bias is 15 ml, and 95% LoA are from -40 to 70 ml. All plotted differences are within the 95% LoA. The bias reaches the least clinical relevance at PEEP 10 and 12. It significantly increased at PEEP 5 cmH2O.
Leaks simulation
Data on the difference in VT between TDV and LS at different levels of leak flow are shown in Table 2. The only significant differences were found between 80 L/min vs. 30 L/min and 80 L/min vs. 50 L/min. The overall bias was 29 ml (95% LoA 19 to 38 ml) (Fig. 5). Table S4 in the supplementary file 1 reported average VT at different levels of leak flow.
Table 2.
Differences in tidal volumes (VT) measured by turbine driven ventilator and lung simulator at different levels of leak flow.
| Simulated Condition | (TDV-LS) LF 30 L/min | (TDV-LS) LF 50 L/min | (TDV-LS) LF 80 L/min | P value |
|---|---|---|---|---|
| Normal | 31(4)+ | 31(3)+ | 24(4)*° | <0.001 |
Data are expressed in ml and reported as mean (±SD).
LF: leak flow (expressed in liters per minute); TDV: turbine driven ventilator; LS: lung simulator; (TDV-LS): difference between VT measurements by turbine driven ventilator and lung simulator.
*Different from 30; °Different from 50; +Different from 80.
Figure 5.
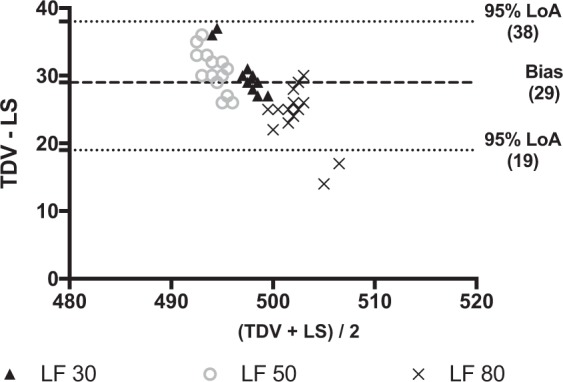
Bland-Altman plot of the differences between tidal volume measured by the turbine driven ventilator and the lung simulator at PEEP 8 cmH2O and different levels of leak flow. Data are reported in ml. LF: leak flow (values are expressed in liter per minute); TDV: Tidal volume (VT) measured by turbine driven ventilator; LS: Tidal volume (VT) measured by lung simulator. Average (x-axys): average of the two measurements; TDV – LS (y-axys): difference between mesurements. Bias: Average of the differences between measurements. 95% LoA: Limits of agreement (±1.96 standard deviation - SD - of the bias). In this plot, the overall bias is 29 ml, and 95% LoA are from 19 to 38 ml. The difference between VT measured by the TDV and the LS remains of no clinical relevance among all simulated leak flows.
Autotriggering was never detected in any experimental records but at the beginning of the new leak condition before the complete TDV compensation (e.g. switching leak from 30 to 50 L/min).
Healthy volunteers study
Table 3 shows VT measured by the TDV and the P for the four health volunteers. Mean difference between VT measured by TDV and P was 45 ml (±32) for volunteer 1, 11 ml (±38) for volunteer 2, -35 ml (±37) for volunteer 3 and 58 ml (±40) for volunteer 4. Figure S1 in the supplementary material shows the distribution of VT measured by TDV and P for each volunteer.
Table 3.
Tidal volumes (VT) measured by turbine driven ventilator and pneumotacograph in the human study.
| Volunteer N° | TDV VT (ml) | P VT (ml) | P value |
|---|---|---|---|
| 1 | 651 (62.5) | 606 (52.8) | <0.001 |
| 2 | 795 (49.1) | 784 (38.5) | 0.22 |
| 3 | 911 (89.3) | 945 (67.1) | 0.03 |
| 4 | 697 (74.2) | 693 (97.2) | <0.001 |
All measurements were done at PEEP and nHPSV of 8 cmH2O. Data are expressed in ml and reported as mean ± SD; PEEP: positive end expiratory pressure; TDV: VT measured by turbine driven ventilator; P: VT measured by pneumotachograph.
Discussion
The main findings of the bench study are: (1) No clinically relevant differences were found in VT between TDV and LS in normal and restrictive conditions at all simulated level of PEEP; (2) The difference between TDV and LS remained stable across the different tested leak flows; (3) There was a large, clinically relevant, difference in VT in the obstructive condition between TDV and the LS.
To the best of our knowledge this is the first study able to demonstrate the possibility of estimate VT during helmet ventilation. The same circuit configuration was tested in a previous study, which used nHPSV in single-circuit vented intentional leak configuration to measure carbon dioxide (CO2) rebreathing15. Interestingly, although VT was not measured by the ventilator software in this study, this kind of circuit configuration should theoretically allow to estimate VT as during non invasive intentional leak mask ventilation16. This estimation has been demonstrated to be pretty reliable in different condition of respiratory mechanics and linear non intentional leaks16.
Our bench study was carried out with a TDV with an intentional leak vented single-limb circuit because direct measurement of VT was not possible due to the intrinsic mechanical features of the helmet, namely its large internal volume15. Besides, a TDV with an intentional leak vented single-limb circuit better compensate for air leaks up to its leak compensation capability16,22.
The helmet is an interface that may increase comfort, reduce skin breakdown, and increase success rate during nHPSV compared to face mask1–7. The TDV was coupled to a new commercially available helmet. This new helmet is featured by an annular extendable ring placed under an inflatable large cushion that secures the interface without the need for armpit support23. This helmet has been found to reduce to a large extent its upward displacement during the ventilator support thus improving patient–ventilator interaction23.
Our results found a very good agreement between differences in VT estimated by the TDV and that measured by the LS in the normal and restrictive condition using the Bland Altman plot. Although the difference between VT measured by the LS and the TDV was statistically different among the groups at the different PEEP levels, this difference was of poor clinical relevance. Of note, Lyazidi et al. found that when setting a VT of 6 ml/kg of predicted body weight, a difference of 1–2 ml/kg with the actually delivered VT would be commonly found24.
We found, both in the normal and in restrictive condition, that the higher the PEEP the less the difference between the VT measured by the TDV and the LS. This result is very appealing being the restrictive lung one the most common application of helmet ventilation4,25. Conversely, in the obstructive condition we found, although still in the 95% LoA, a clinically relevant discrepancy between the two VT with an overestimation showed by the TDV. Interestingly, as opposite to our findings, Lujan et al. found that built-in software was underestimating the VT in two of the tested ventilators16. This may suggest that different built-in software may behave differently in presence of an obstructive pattern. One can also speculate that understimation might be linked to the reassessment of the zero flow value by the TDV in presence of air trapping. However, we can also hypothesize that during the bench study in this condition, the simulated patient’s high resistances could have generated small non intentional leaks. While the ventilator software was not affected by the presence of the leak because it was able to compensate it, the monitoring system of the ASL 5000 did so reading smaller VT.
Autotriggering was never detected in any trial. This result supports previous finding of the TDV capability in intentional leak vented configuration to better compensate for leaks when a flow trigger is used22. Autotriggering could also not be found due to the use of the new helmet, which presents less upward displacement during nHPSV. Only when simulated a new leak flow, few auto-triggered breaths were detected due to the need of the ventilator to compensate the loss in air flow.
Non intentional leaks are the most frequent drawback during NIV26. We evaluated the reliability of VT estimation increasing the values of the intentional leak flows to 30, 50 and 80 L/min during nHPSV in the normal simulated condition at PEEP of 8 cmH2O. This range was selected because it includes the minimal value to avoid rebreathing even in absence of the inspiratory support7. Again, the difference in VT at different leak flows was clinically negligible.
Software may underestimate both leaks and VT with the greater the leak, the greater the difference between the estimated and actual VT27. However, the ventilator software we used was provided with an algorithm that improves accuracy compensating for the difference between the estimated leak measured at the distal and proximal sides of the circuit16. The interesting clinical message is that being leaks a possible drawback of helmet ventilation this way of estimating VT could theoretically assures VT estimation even in presence of additional leaks.
The main findings of the healthy volunteer study are that although the differences in VT were significantly different in all the volunteers but the second one, this difference was of scarce clinical relevance. During the human study, we used the same set-up that we previously described in other study15. We applied PEEP at 8 cmH2O because it is one of the most common value used in the clinical setting18,28,29.
Estimation of VT has been the only mode of measuring VT in TDV in intentional leaks single-limb vented configuration since the introduction of these ventilators at the beginning of the 9016,27. The built-in software of these TDV should be able to accurately estimate VT, even in presence of increased non-intentional leaks. Of note, using pressure controlled modes with compressed air driven intensive care unit (ICU) ventilator, the higher the non intentional leak the lower the expiratory VT22,30. In addition, by using an helmet, which has a larger internal volume, the displayed VT, when using a non vented configuration with a high pressure driven ICU ventilator is significantly higher than actual delivered VT5.
We can speculate that, using a TDV in this configuration, it would be possible to ventilate hypoxemic patients4 via an helmet by knowing that delivered VT11 is pretty closed to what the patients is really breathing in.
The present study has several limitations. Firstly, this is a bench and human volunteers study. Therefore, these results need to be confirmed clinically. However, direct comparison of real measurements and its estimation at standardized condition of respiratory mechanics and respiratory rate in the same patient seems impossible for both practical and ethical reasons. Moreover, it should be noted that volunteers had healthy lungs. Second, we measured VT under ambient temperature and pressure and dry gas conditions (ATPD). However, the VT in the patient’s lungs is at body temperature and pressure, and saturated with water vapor (BTPS). The conversion from ATPD to BTPS would increase VT by about 10.4% for TDVs at 20 °C and at the vapor pressure of H2O 17.5 mmHg16. We could speculate that the small gap we found between TDV and LS would be potentially further reduced by converting ATPD in BTPS. Third, we used to simulate an increase in leaks an increase in linear non intentional leak31. As previously demonstrated by Sogo et al., the presence of unintentional random leaks may lead to an error in the measurement of VT provided by the ventilator software31. In addition, we did not measure the pressurization time at the different simulated leaks. It is possible that by increasing the amount of the leak (intentional or non intentional) we approached the compensating capability of the TDV thus increasing the time necessary to achieve the preset level of pressure support5. Fourth, we did not measure CO2 rebreathing in the human study. However, we previously demonstrated that the same setting of the present study improved CO2 rebreathing compared to a non-vented circuit configuration using an air compressed ICU ventilator15. Lastly, due to different algorithms used to estimate VT in the build-in software of TDV, we cannot be sure that our data can be extrapolated to other TDVs in vented configuration16,27.
In conclusion, this feasibility bench and human study demonstrated that VT estimation during nHPSV seems to be feasible and accurate in all the conditions except the simulated obstructive condition. Additional leaks seem not to affect VT reliability. Further studies are required to identify the magnitude of discrepancy between the proposed method and gold standard in bench and clinical setting.
Supplementary information
Acknowledgements
We would like to thank Salvatore Arancio (Laerdal Italia) for his help in study materials.
Author contributions
A.C. and C.G. conceived the content of this manuscript and designed the study. A.C., P.N., G.A., G.M., I.S., M.I., A.B., E.G., C.P. and C.G. helped in data collection. A.C., P.N., G.A., G.M., I.S., M.I., A.B., E.G., C.P. and C.G. helped in data analysis and interpretation. AC, GA, CG drafted the manuscript. P.N., G.A. did a critical revision of the manuscript for important intellectual content. All authors provided final approval of the version submitted for publication.
Data availability
The datasets analysed during the current study are available from the corresponding author on reasonable request.
Competing interests
Prof. Paolo Navalesi received research grants and/or equipment from Maquet Critical Care and Intersurgical SPA, royalties from Intersurgical SPA for Helmet Next invention, lecturing fees from Maquet, Philips, Resmed, Novartis. Prof. Cesare Gregoretti received fees for lectures or consultancies from Philips, Resmed, Vivisol, OrionPharma, Origin. All other authors declare to have no competing interests.
Footnotes
Publisher’s note Springer Nature remains neutral with regard to jurisdictional claims in published maps and institutional affiliations.
Supplementary information
is available for this paper at 10.1038/s41598-019-54020-5.
References
- 1.Gregoretti C, Pisani L, Cortegiani A, Ranieri VM. Noninvasive ventilation in critically ill patients. Critical Care Clinics. 2015;31:435–457. doi: 10.1016/j.ccc.2015.03.002. [DOI] [PubMed] [Google Scholar]
- 2.Antonelli M, et al. New treatment of acute hypoxemic respiratory failure: noninvasive pressure support ventilation delivered by helmet–a pilot controlled trial. Crit Care Med. 2002;30:602–608. doi: 10.1097/00003246-200203000-00019. [DOI] [PubMed] [Google Scholar]
- 3.Antonelli M, et al. Noninvasive positive pressure ventilation using a helmet in patients with acute exacerbation of chronic obstructive pulmonary disease: a feasibility study. Anesthesiology. 2004;100:16–24. doi: 10.1097/00000542-200401000-00007. [DOI] [PubMed] [Google Scholar]
- 4.Patel BK, Wolfe KS, Pohlman AS, Hall JB, Kress JP. Effect of Noninvasive Ventilation Delivered by Helmet vs Face Mask on the Rate of Endotracheal Intubation in Patients With Acute Respiratory Distress Syndrome: A Randomized Clinical Trial. JAMA. 2016;315:2435–2441. doi: 10.1001/jama.2016.6338. [DOI] [PMC free article] [PubMed] [Google Scholar]
- 5.Racca F, et al. Effectiveness of mask and helmet interfaces to deliver noninvasive ventilation in a human model of resistive breathing. J Appl Physiol (1985) 2005;99:1262–1271. doi: 10.1152/japplphysiol.01363.2004. [DOI] [PubMed] [Google Scholar]
- 6.Vaschetto R, et al. Comparative evaluation of three interfaces for non-invasive ventilation: a randomized cross-over design physiologic study on healthy volunteers. Crit Care. 2014;18:R2. doi: 10.1186/cc13175. [DOI] [PMC free article] [PubMed] [Google Scholar]
- 7.Patroniti N, et al. Head helmet versus face mask for non-invasive continuous positive airway pressure: a physiological study. Intensive Care Med. 2003;29:1680–1687. doi: 10.1007/s00134-003-1931-8. [DOI] [PubMed] [Google Scholar]
- 8.Gregoretti C, Cortegiani A, Accurso G, Raineri SM, Giarratano A. Noninvasive Ventilation for Acute Hypoxemic Respiratory Failure/ARDS: the Show Must Go on. Türk Anestezi ve Reanimsyun Dernegi. 2018;46:1. doi: 10.5152/TJAR.2018.290118. [DOI] [PMC free article] [PubMed] [Google Scholar]
- 9.Cortegiani A, et al. Ten important articles on noninvasive ventilation in critically ill patients and insights for the future: A report of expert opinions. BMC Anesthesiol. 2017;17:122. doi: 10.1186/s12871-017-0409-0. [DOI] [PMC free article] [PubMed] [Google Scholar]
- 10.Costa R, et al. Physiologic evaluation of different levels of assistance during noninvasive ventilation delivered through a helmet. Chest. 2005;128:2984–2990. doi: 10.1378/chest.128.4.2984. [DOI] [PubMed] [Google Scholar]
- 11.Carteaux G, et al. Failure of Noninvasive Ventilation for De Novo Acute Hypoxemic Respiratory Failure: Role of Tidal Volume. Crit Care Med. 2016;44:282–290. doi: 10.1097/CCM.0000000000001379. [DOI] [PubMed] [Google Scholar]
- 12.Gregoretti C, Cortegiani A, Raineri SM, Giarrjatano A. Noninvasive Ventilation in Hypoxemic Patients: an Ongoing Soccer Game or a Lost One? Turk J Anaesthesiol Reanim. 2017;45:329–331. doi: 10.5152/TJAR.2017.241102. [DOI] [PMC free article] [PubMed] [Google Scholar]
- 13.Brochard L, Slutsky A, Pesenti A. Mechanical Ventilation to Minimize Progression of Lung Injury in Acute Respiratory Failure. Am J Respir Crit Care Med. 2017;195:438–442. doi: 10.1164/rccm.201605-1081CP. [DOI] [PubMed] [Google Scholar]
- 14.Carteaux G, et al. Patient-ventilator asynchrony during noninvasive ventilation: a bench and clinical study. Chest. 2012;142:367–376. doi: 10.1378/chest.11-2279. [DOI] [PubMed] [Google Scholar]
- 15.Racca F, et al. Helmet ventilation and carbon dioxide rebreathing: effects of adding a leak at the helmet ports. Intensive Care Med. 2008;34:1461–1468. doi: 10.1007/s00134-008-1120-x. [DOI] [PubMed] [Google Scholar]
- 16.Lujan M, et al. Effect of leak and breathing pattern on the accuracy of tidal volume estimation by commercial home ventilators: a bench study. Respiratory Care. 2013;58:770–777. doi: 10.4187/respcare.02010. [DOI] [PubMed] [Google Scholar]
- 17.Conti G, et al. Comparative bench study evaluation of different infant interfaces for non-invasive ventilation. BMC Pulm Med. 2018;18:57. doi: 10.1186/s12890-018-0620-x. [DOI] [PMC free article] [PubMed] [Google Scholar]
- 18.Olivieri C, et al. Bench comparative evaluation of a new generation and standard helmet for delivering non-invasive ventilation. Intensive Care Med. 2013;39:734–738. doi: 10.1007/s00134-012-2765-z. [DOI] [PubMed] [Google Scholar]
- 19.Fauroux B, Leroux K, Pepin J-L, Lofaso F, Louis B. Are home ventilators able to guarantee a minimal tidal volume? Intensive Care Med. 2010;36:1008–1014. doi: 10.1007/s00134-010-1785-9. [DOI] [PubMed] [Google Scholar]
- 20.Costa R, et al. Influence of ventilator settings on patient-ventilator synchrony during pressure support ventilation with different interfaces. Intensive Care Med. 2010;36:1363–1370. doi: 10.1007/s00134-010-1915-4. [DOI] [PubMed] [Google Scholar]
- 21.Giavarina D. Understanding Bland Altman analysis. Biochem Med (Zagreb) 2015;25:141–151. doi: 10.11613/BM.2015.015. [DOI] [PMC free article] [PubMed] [Google Scholar]
- 22.Carlucci A, et al. The configuration of bi-level ventilator circuits may affect compensation for non-intentional leaks during volume-targeted ventilation. Intensive Care Med. 2013;39:59–65. doi: 10.1007/s00134-012-2696-8. [DOI] [PubMed] [Google Scholar]
- 23.Olivieri C, et al. New versus Conventional Helmet for Delivering Noninvasive Ventilation: A Physiologic, Crossover Randomized Study in Critically Ill Patients. Anesthesiology. 2016;124:101–108. doi: 10.1097/ALN.0000000000000910. [DOI] [PubMed] [Google Scholar]
- 24.Lyazidi A, et al. Bench test evaluation of volume delivered by modern ICU ventilators during volume-controlled ventilation. Intensive Care Med. 2010;36:2074–2080. doi: 10.1007/s00134-010-2044-9. [DOI] [PubMed] [Google Scholar]
- 25.Cortegiani A, et al. Immunocompromised patients with acute respiratory distress syndrome: secondary analysis of the LUNG SAFE database. Crit Care. 2018;22:157. doi: 10.1186/s13054-018-2079-9. [DOI] [PMC free article] [PubMed] [Google Scholar]
- 26.Vignaux L, et al. Patient–ventilator asynchrony during non-invasive ventilation for acute respiratory failure: a multicenter study. Intensive Care Med. 2009;35:840. doi: 10.1007/s00134-009-1416-5. [DOI] [PubMed] [Google Scholar]
- 27.Contal O, et al. Monitoring of noninvasive ventilation by built-in software of home bilevel ventilators: a bench study. Chest. 2012;141:469–476. doi: 10.1378/chest.11-0485. [DOI] [PubMed] [Google Scholar]
- 28.Bellani G, et al. Noninvasive Ventilation of Patients with Acute Respiratory Distress Syndrome. Insights from the LUNG SAFE Study. Am J Respir Crit Care Med. 2017;195:67–77. doi: 10.1164/rccm.201606-1306OC. [DOI] [PubMed] [Google Scholar]
- 29.Ferrari G, et al. Noninvasive Positive Airway Pressure and Risk of Myocardial Infarction in Acute Cardiogenic Pulmonary Edema: Continuous Positive Airway Pressure vs Noninvasive Positive Pressure Ventilation. Chest. 2007;132:1804–1809. doi: 10.1378/chest.07-1058. [DOI] [PubMed] [Google Scholar]
- 30.Gregoretti C, et al. Pressure control ventilation and minitracheotomy in treating severe flail chest trauma. Intensive Care Med. 1995;21:1054–1056. doi: 10.1007/BF01700674. [DOI] [PubMed] [Google Scholar]
- 31.Sogo A, et al. Effect of dynamic random leaks on the monitoring accuracy of home mechanical ventilators: a bench study. BMC Pulm Med. 2013;13:75. doi: 10.1186/1471-2466-13-75. [DOI] [PMC free article] [PubMed] [Google Scholar]
Associated Data
This section collects any data citations, data availability statements, or supplementary materials included in this article.
Supplementary Materials
Data Availability Statement
The datasets analysed during the current study are available from the corresponding author on reasonable request.