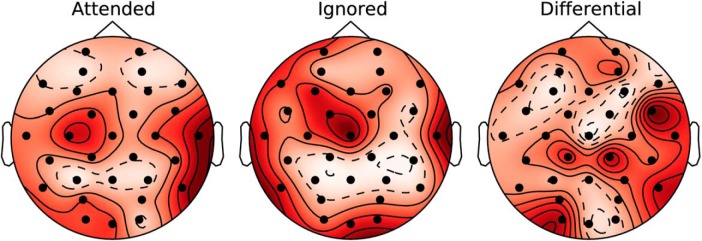
Figure 4.
Scalp maps showing the average coherence (shown as a z-score) at each of the different EEG electrodes in the attended, ignored, and differential conditions. To obtain the scalp maps, the speech-EEG coherence values were averaged across the delta, theta, and low-gamma EEG bands (i.e., the bands showing significant attention effects in Fig. 3A), and all speech bands, and expressed as a z-score. The intensity shown at each electrode is the mean of the z-score across speech stories and individual subjects. Note that the scalp maps are scaled to their respective minimum and maximum z-score values, so as to best show the spatial patterns. The spatial profiles are hard to distinguish between the attended and ignored maps; however, note that the coherences are larger in the attended condition than the ignored, on an absolute scale. The differential map shown in the right column quantifies these differences across the scalp. Temporal-parietal regions appear to show the largest coherence differences between the attended and ignored conditions; however, this pattern is not symmetric between the hemispheres.

