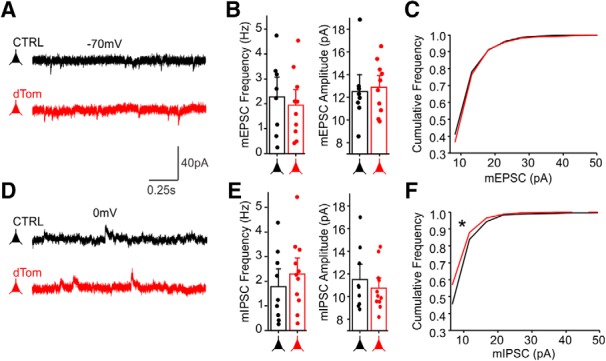
Figure 2.

FAPpost synaptic localization does not alter mEPSC and mIPSC properties. A, Example voltage-clamp traces from an untransfected (black) and neighboring FAPpost-expressing (red) L2/3 Pyr cell showing mEPSCs. B, Comparison of mean mEPSC frequency (ANOVAFrequency: F(1,16) = 0.2, p = 0.6) and amplitude (ANOVAAmplitude: F(1,16) = 0.1, p = 0.8) indicate no difference. C, Cumulative distribution histogram of mEPSC amplitudes (Kolmogorov–Smirnov test, D = 0.05, p = 0.16). D, Example voltage-clamp traces from an untransfected (black) and neighboring FAPpost-expressing (red) L2/3 Pyr cell showing mIPSCs. E, Mean mIPSCs frequency (left) of untransfected and dTom cells were not significantly different (ANOVAFrequency: F(1,18) = 0.6, p = 0.4). Mean mIPSC amplitude (right) of untransfected and dTom cells were not significantly different (ANOVAAmplitude: F(1,18) = 0.5, p = 0.5). F, Cumulative distribution histogram of mIPSC amplitudes shows a small but significant shift in dTom mIPSC amplitudes (Kolmogorov–Smirnov test, D = 0.15, *p < 0.0001); n = 8–11 cells, N = 7 animals.
