

Abstract
Hypoxia-inducible gene domain 1 (HIGD1) proteins are small integral membrane proteins, conserved from bacteria to humans, that associate with oxidative phosphorylation supercomplexes. Using yeast as a model organism, we have shown previously that its two HIGD1 proteins, Rcf1 and Rcf2, are required for the generation and maintenance of a normal membrane potential (ΔΨ) across the inner mitochondrial membrane (IMM). We postulated that the lower ΔΨ observed in the absence of the HIGD1 proteins may be due to decreased proton pumping by complex IV (CIV) or enhanced leak of protons across the IMM. Here we measured the ΔΨ generated by complex III (CIII) to discriminate between these possibilities. First, we found that the decreased ΔΨ observed in the absence of the HIGD1 proteins cannot be due to decreased proton pumping by CIV because CIII, operating alone, also exhibited a decreased ΔΨ when HIGD1 proteins were absent. Because CIII can neither lower its pumping stoichiometry nor transfer protons completely across the IMM, this result indicates that HIGD1 protein ablation enhances proton leak across the IMM. Second, we demonstrate that this proton leak occurs through CIV because ΔΨ generation by CIII is restored when CIV is removed from the cell. Third, the proton leak appeared to take place through an inactive population of CIV that accumulates when HIGD1 proteins are absent. We conclude that HIGD1 proteins in yeast prevent CIV inactivation, likely by preventing the loss of lipids bound within the Cox3 protein of CIV.
Keywords: mitochondrial membrane potential, mitochondria, respiration, cytochrome c oxidase (complex IV), lipid–protein interaction, hypoxia-inducible gene domain 1 (HIGD1), oxidative phosphorylation, proton leak, Rcf, suicide inactivation
Introduction
The yeast HIGD1 proteins Rcf1 and Rcf2 are small integral membrane proteins in the inner mitochondrial membrane (IMM)2 (1–6). Rcf1, but not Rcf2, is necessary for normal accumulation of complex IV and, therefore, for normal accumulation of the yeast CIII2–CIV2 supercomplex (7, 8). Rcf1 acts an assembly factor for CIV, specifically for Cox3, one of the three subunits of the catalytic core of CIV (1, 7). Cox3 is a V-shaped membrane protein, with two hinged transmembrane domains forming an open cleft in the middle (9–12) (Fig. 1A). In fully assembled CIV, the back wall of the Cox3 cleft is a transmembrane surface of Cox1, the central subunit of CIV, whereas the front of the cleft is open to the lipid bilayer. Within the cleft, conserved residues bind up to five phospholipids in specific orientations (9–11, 13) (Fig. 1A). Lipid binding interactions are critical for the binding of Cox3 to Cox1 (14). In its assembly role, Rcf1 binds to newly synthesized Cox3 prior to assembly of Cox3 into CIV (1, 7). Given that lipid binding by Cox3 is required for its native structure and for its assembly into CIV, it seems likely that Rcf1 binds to Cox3 to facilitate the process of lipid insertion (8). A recent structure shows that the transmembrane region of Rcf1 has a V shape similar to that of Cox3 (Fig. 1A) (15). In fact, the transmembrane domain of Rcf1 can be superimposed onto the final structure of Cox3, a position that would be consistent with lipid delivery by Rcf1 into the cleft of Cox3 or with Rcf stabilizing the V-shape of Cox3 during lipid binding.
Figure 1.
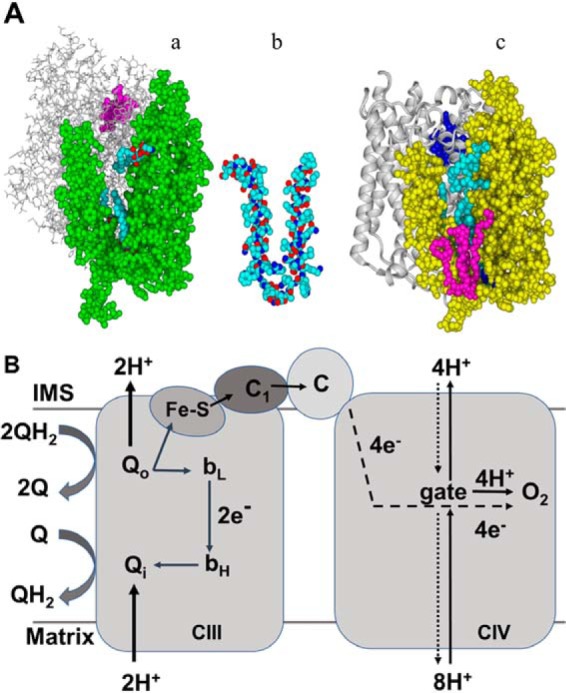
A, structure of Cox3 of CIV of yeast and bovine mitochondria and structure of the transmembrane domain of Rcf1. a, a structure of yeast Cox3 (green) and Cox1 (gray) at 3.35 Å taken from a cryo-EM structure of the III2–IV2 supercomplex of S. cerevisiae (PDB code 6HU9) (11). Although the membrane is not shown, both Cox3 and Cox1 are almost entirely within the IMM. Three phospholipids (blue) are resolved in the cleft of Cox3 in this structure. Heme a3 of the active site in Cox1 is shown in purple. b, transmembrane domain of yeast Rcf1 taken from the solution structure of Zhou et al. (15) (PDB code 5NF8). Similar to Cox3, the TM helices of Rcf1 form a V shape, connected by a hinge region that extends slightly into the matrix. Although Rcf1 is smaller than Cox3, its V shape can be superimposed atop the V shape of Cox3, suggesting a possible binding interaction. c, a structure of bovine Cox3 (yellow) and Cox1 (gray) at 1.8–1.9 Å taken from an X-ray structure of bovine CIV (PDB code 2EIL) (9). Five Cox3 lipids are resolved in this structure, four phosphatidylglycerol (cyan) within the cleft plus one cardiolipin (pink) that binds at the entrance to the cleft. Heme a3 of the active site in Cox1 is shown in blue. The graphics were generated using YASARA (Yet Another Scientific Artificial Reality Application; http://www.yasara.org/ (44)).4 B, diagrams showing the electrogenic charge movements associated with full catalytic cycles of CIII and CIV. In one catalytic cycle of CIII, two QH2 are oxidized at Qo, one Q is reduced at Qi, and two soluble cytochromes c are reduced by heme c1. In one cycle, CIII generates Δψ by electrogenic release of two H+ from Qo (two more H+ are released from Qo, but these are charge-compensated by e− release from Qo and are therefore nonelectrogenic), electrogenic transfer of two e− from Qo to Qi, and electrogenic uptake of two H+ to Qi. In one catalytic cycle of CIV, four e− are transferred toward the negative side of the IMM (dashed line), whereas 4 H+ are transferred toward the positive side of the IMM (solid line), all to the O2 reduction site in the transmembrane domain of Cox1. Here the negative and positive charges annihilate (creating neutral H2O), resulting in the equivalent of four transmembrane charge translocations. Simultaneous with these partial charge transfers, the exergonic energy of O2 reduction is harnessed to pump four H+ completely from the negative side to the positive side of the IMM, resulting in four more charge separations. Note that the proton pumping activity of CIV requires a transmembrane pathway for H+. In contrast, there is no pathway for H+ to completely cross the membrane through CIII. Proton backleak (dotted line) and the gate in CIV are discussed in the text.
In addition to the role of Rcf1 in CIV assembly, both HIGD1 proteins are necessary for fully assembled CIV to generate and maintain a normal membrane potential in isolated mitochondria (8). In the absence of both HIGD1 proteins, yeast mitochondria showed a 33% decrease in membrane potential (ΔΨ) during electron transfer (ET) through CIV (8). It is important to note that this decrease in ΔΨ is independent of (i.e. not due to) the reduced accumulation of CIV that occurs in the absence of Rcf1. Decreases in ΔΨ were seen in the absence of only Rcf1 or only Rcf2 (8). Both of the HIGD1 proteins play a role in maintaining ΔΨ, and their contributions are additive.
Both yeast HIGD1 proteins bind directly to fully assembled CIV (1–3). The proteins do not bind as subunits. Rather, their interactions with CIV are dynamic and substoichiometric and appear to occur via Cox3 (1, 7). We have hypothesized that the HIGD1 proteins may function to maintain normal lipid binding in Cox3 of fully assembled CIV, e.g. by facilitating lipid replacement into Cox3 from the bilayer (8). Because the HIGD1 proteins appear linked to Cox3, and functional Cox3 is required for normal proton pumping by CIV (16–18), we proposed (8) that the lower ΔΨ generated by CIV could arise from decreased H+ pumping by CIV. However, we could not rule out enhanced proton leak through CIV or some other component of the IMM.
Here we measured the generation of ΔΨ by CIII of yeast in the presence or absence of the HIGD1 proteins and in the presence or absence of CIV to more precisely define the function of the yeast HIGD1 proteins. The data support the proposal that CIV is the dysfunctional component responsible for the lower ΔΨ of mitochondria in the absence of the HIGD1 proteins. However, the data are inconsistent with the proposal that the lower ΔΨ is due to decreased proton pumping by CIV. Rather, a population of inactive CIV appears to be capable of proton backleak across the IMM. Because disturbed lipid binding in Cox3 is known to enhance the inactivation of CIV (14), the finding that the HIGD1 proteins function to prevent the inactivation of CIV is entirely consistent with their proposed role in maintaining the lipid component of Cox3.
Results
The lower ΔΨ of mitochondria lacking HIGD1 proteins appears to be due to proton leak through the IMM
Neither the content of CIII (8) nor its activity is affected by the absence of both HIGD1 proteins (Δrcf1;Δrcf2 mitochondria; Fig. 2, A and B). These findings, along with the known enzymology of CIII, allowed us to use CIII to distinguish whether the decreased ΔΨ characteristic of yeast mitochondria that lack the HIGD1 proteins (8) is caused by decreased proton pumping by CIV or by an increased leak for H+ through the IMM. As diagrammed in Fig. 1B, the catalytic cycle of CIII includes the electrogenic transfer of both protons and electrons within the membrane (19, 20). The mechanism of CIII locks in its stoichiometry of charge separations, i.e. if CIII of intact mitochondria exhibits normal antimycin-sensitive ET activity, then it is capable of generating a normal ΔΨ. If the lower ΔΨ of Δrcf1;Δrcf2 mitochondria results from diminished proton pumping by CIV, then the ΔΨ developed by CIII, independent of CIV, should be the same in both Δrcf1;Δrcf2 mitochondria and normal mitochondria. If, however, the lower ΔΨ of Δrcf1;Δrcf2 mitochondria is due to increased proton leak across the IMM, the ΔΨ generated by CIII will be subject to this leak, and the ΔΨ generated by CIII will be lower in Δrcf1;Δrcf2 mitochondria than in normal mitochondria.
Figure 2.

The content and activity of CIII in yeast mitochondria and the decreased membrane potential generated by CIII in mitochondria lacking the HIGD1 proteins. A, the content of CIII in various strains was determined from visible spectra (Fig. S1) as described under “Experimental procedures.” B, the uncontrolled ET activity of CIII (1 mm NADH to 3 mm ferricyanide) measured in intact mitochondria in the presence of uncoupler (10 μm CCCP). C and D, maximum percentage of safranin uptake (maximum fluorescence quenching) during continuous state 2 (no ADP) ET through CIII in intact mitochondria (1 mm NADH to 3 mm ferricyanide) (C) and the same during ET from 20 mm ethanol to 1 mm ferricyanide (D). E and F, controlled turnover numbers (e− per second per CIII), measured under the same state 2 conditions, for ET from NADH to ferricyanide (E) and for ET from ethanol to ferricyanide (F). Significance to the WT control was determined by the unpaired Student t test. B, **, p = 0.0021. C–F, *, p = 0.0304; **, p = 0.0026; ****, p < 0.0001.
The ΔΨ developed by CIII alone was assayed by measuring the uptake of the cationic fluorescent dye safranin during steady-state ET, using NADH or ethanol as electron donors and ferricyanide as the terminal electron acceptor (see “Experimental procedures”). Cyanide is present to inhibit CIV. NADH is oxidized by a peripheral membrane dehydrogenase that transfers the electrons to ubiquinone (21). This NADH dehydrogenase does not generate ΔΨ. Fig. 2C shows that CIII, even though it is present at normal levels and has normal activity (Fig. 2, A and B), showed an approximate 50% decline in safranin uptake in Δrcf1;Δrcf2 mitochondria during ET from NADH to ferricyanide. A similar result was obtained during the 10-fold slower rate of steady-state of ET through CIII driven by ethanol, which generates NADH in vivo as it is oxidized (Fig. 2D). In both cases, the ΔΨ generated by CIII ET is completely collapsed by addition of antimycin A (data not shown), confirming that antimycin A–sensitive ET through CIII is responsible for ΔΨ generation. Because the ΔΨ-generating power of CIII of WT and CIII of Δrcf1;Δrcf2 mitochondria are equal under these conditions, the lower ΔΨ in Δrcf1;Δrcf2 mitochondria indicated that a proton leak exists somewhere in the IMM of the mitochondria lacking the HIGD1 proteins.
Comparison of the rates of coupled (controlled) ET and uncoupled (uncontrolled) ET through CIII provided independent confirmation that the ΔΨ generated by CIII is lower in intact Δrcf1;Δrcf2 mitochondria than in WT mitochondria. Controlled ET through CIII in intact WT mitochondria (Fig. 2E) is slower than in chemically uncoupled WT mitochondria (Fig. 2B) because of the inhibition of ET in intact mitochondria by ΔΨ. Controlled ET through CIII in Δrcf1;Δrcf2 mitochondria is also slower than in chemically uncoupled mitochondria (compare Fig. 2, B and E), but the extent of inhibition of ET by ΔΨ is clearly less than that in WT mitochondria. This indicates that a lower ΔΨ is generated by CIII ET in intact Δrcf1;Δrcf2 mitochondria than in intact WT mitochondria.
CIV is the source of the proton leak in mitochondria lacking the HIGD1 proteins
Having established the presence of a leak for protons across the IMM of Δrcf1;Δrcf2 mitochondria, the obvious question is, where is it? Existing evidence suggests that the proton leak seen in the absence of the HIGD1 proteins occurs through CIV. The HIGD1 proteins form dynamic associations with CIV (1, 7). In mitochondria lacking the HIGD1 proteins, CIV generates a lower-than-normal ΔΨ (8). Despite these links to CIV, Rcf1 at least associates with other components in the IMM, particularly the ATP/ADP exchanger proteins (1, 7). Hence, the absence of the HIGD1 proteins could open a proton leak elsewhere in the IMM. We reasoned that if CIV is the source of the proton leak in Δrcf1;Δrcf2 mitochondria, then removing CIV from the IMM should remove the leak and restore the ability of CIII to maintain a normal ΔΨ. Complex IV does not assemble in a yeast strain in which the gene for Cox11, a copper chaperone absolutely required for the insertion of CuB into the active site (22–24), has been deleted (25). The yeast strains Δcox11 and Δrcf1;Δrcf2 were crossed to obtain a triple mutant lacking Cox11 and the two HIGD1 proteins (Δrcf1;Δrcf2;Δcox11). We first examined the content and uncontrolled activity (i.e. in the absence of ΔΨ) of CIII in Δcox11 and Δrcf1;Δrcf2;Δcox11 (Fig. 2, A and B). The content of CIII appears to be lower in the absence of CIV (Fig. 2A). Compared with WT, the uncontrolled activity of CIII (TN) was 14% lower in the absence of CIV, although the data did not reach significance (Δcox11 versus WT, Fig. 2B). The uncontrolled activity of CIII is significantly lower than normal (by 43%) in the absence of both CIV and the HIGD1 proteins (Δrcf1;Δrcf2;Δcox11 versus the WT, Fig. 2B). The reason for these activity declines are not yet clear. Even with the lower inherent activity of the pool of CIII in Δrcf1;Δrcf2;Δcox11 mitochondria, the complex generated significantly greater ΔΨ during controlled ET than CIII in mitochondria that lack the HIGD1 proteins but contain CIV (Δrcf1;Δrcf2, Fig. 3). This result was observed during more rapid NADH-driven ET through CIII and during the slower ethanol-driven ET (Fig. 3). Compared with the WT, the removal of CIV (Δcox11) lowered the percentage of safranin uptake by up to 10%, perhaps consistent with the lower TN for CIII in the absence of CIV (Fig. 2B). However, there was no further significant loss of safranin uptake when the HIGD1 proteins were removed from Δcox11 mitochondria (Δcox11 versus Δrcf1;Δrcf2;Δcox11, Fig. 3). Despite the unexplained changes in CIII activity, the data make clear that removing CIV alleviates proton leak and restores the ability of CIII to maintain ΔΨ. This strongly favors the hypothesis that CIV is the source of increased proton leak in the absence of the HIGD1 proteins.
Figure 3.

The low mitochondrial membrane potential generated by CIII in the absence of the HIGD1 proteins is restored by further removal of CIV. Conditions and presentation are as in Fig. 2, C and D. Significance to the WT controls was determined by unpaired Student t test. *, p < 0.02; **, p < 0.0019; ****, p < 0.0001.
In Δrcf1;Δrcf2 mitochondria, the lower-than-normal level of CIV is associated with a dimer of CIII forming a III2–IV1 supercomplex as opposed to the III2–IV2 supercomplex of WT mitochondria (1, 8). The question arises whether this altered association of CIV with CIII is somehow driving proton leak through CIV, e.g. by altering its structure. This was tested using mitochondria containing CIV but lacking CIII and then in the presence or absence of the HIGD1 proteins. Complex III fails to assemble in yeast mitochondria lacking the gene (cor1) for the core subunit (26). The Δcor1 strain was crossed with Δrcf1;Δrcf2 to create a triple mutant lacking CIII and the HIGD1 proteins (Δrcf1;Δrcf2;Δcor1). In the absence of the HIGD1 proteins, the content and the uncontrolled activity of CIV are both lowered to the same extent whether or not CIII is present (Fig. 4, A and B). Further, decreases in safranin uptake and increases in controlled ET rates (both indicative of uncoupling) show that the ΔΨ in the absence of the HIGD1 proteins is decreased to the same extent whether CIII is present (WT, Δrcf1;Δrcf2) or absent (Δcor1, Δrcf1;Δrcf2;Δcor1) (Fig. 4, C and D). We conclude that the association of CIV with CIII has no effect on proton leak through CIV.
Figure 4.

In the absence of the HIGD1 proteins, the content and uncontrolled ET activity of CIV are both lowered to the same extent whether or not CIII is present. Proton leak through CIV is not affected by the association of CIV with CIII. A, the content of CIV in intact mitochondria was determined by visible spectroscopy as described under “Experimental procedures.” B, the uncontrolled turnover number of CIV (e− per second per CIV) measured using broken mitochondria. Broken mitochondria were used to ensure that the comparisons of CIV activity are not influenced by the differences in membrane potential that would occur in intact mitochondria. C, the membrane potential (as percentage of safranin uptake) generated by CIV in intact mitochondria during state 2 ET through CIV, as described under “Experimental procedures.” D, state 2 (controlled) turnover numbers of CIV in intact mitochondria. Significance to the WT controls was determined by unpaired Student t test. A, *, p < 0.0327; ***, p < 0.0001. B, ****, p < 0.0001. C, **, p < 0.0048; ***, p < 0.001; ****, p < 0.0001. D, *, p = 0.0421; ***, p < 0.0002.
Proton leak takes place through inactive CIV in the IMM
Brzezinski and co-workers (27) have demonstrated that inactive CIV accumulates in the IMM of mitochondria lacking Rcf1 or Rcf2. Suicide inactivation of CIV is a well-studied phenomenon (see “Discussion”). Heme a is retained in the inactive enzyme (28). Because heme a is used to quantitate the amount of enzyme, a population of CIV that is part active enzyme with normal activity and part inactive enzyme with no activity will exhibit an overall lower apparent TN (activity per enzyme). Indeed, we found that the uncontrolled TN of CIV of strains lacking Rcf1, Rcf2, or both of the HIGD1 proteins declined progressively (Fig. 5A). We propose that the apparent TN declines because of increasing amounts of inactive CIV in this series of HIGD1 protein deletion strains. Significantly, the ability of these mitochondria to generate ΔΨ declines in this same pattern, i.e. WT > Δrcf1 > Δrcf2 > Δrcf1;Δrcf2 (Fig. 5B and similar to that published previously (8)). Hence, in this series of HIGD1 protein deletion mutants, increasing proton leak across the IMM correlates with increasing amounts of inactivated CIV in the IMM. This correlation suggests that inactivated CIV is the source of proton leak.
Figure 5.

The apparent TN (e− per second per CIV) and membrane potential generated by CIV in normal mitochondria and those lacking Rcf1, Rcf2, or both HIGD1 proteins. A, uncontrolled TNs of CIV were measured using broken mitochondria as described under “Experimental procedures.” B, the membrane potential (as percentage of safranin uptake) generated by CIV, which was energized by 5 mm ascorbate and 0.1 mm TMPD during state 2 ET. Significance to the WT controls was determined by unpaired Student t test. A, *, p < 0.0425; ***, p < 0.001; ****, p < 0.0001. B, ****, p < 0.0001.
Further evidence that inactivated CIV is the source of enhanced proton leak comes from examination of the kinetics of CIV ET and the concomitant generation of ΔΨ. Suicide inactivation of CIV appears as the exponential loss of activity in a population of CIV during continuous electron transfer to O2 (28, 29). Such an exponential loss of CIV activity was observed during continuous ET through CIV in mitochondria from Δrcf1;Δrcf2 cells but not for CIV in mitochondria isolated from WT cells (Fig. 6A). Hence, the IMMs of isolated Δrcf1;Δrcf2 mitochondria experience an increase in inactivated CIV during continuous ET through CIV.
Figure 6.

Kinetics traces of CIV safranin fluorescence and ET in the presence and absence of the HIGD1 proteins. A, representative traces of O2 consumption by CIV (black line, WT; dashed line, Δrcf1;Δrcf2), measured in broken mitochondria. Continuous ET in broken mitochondria is driven by 5 mm ascorbate, 0.1 mm TMPD, and 20 μm horse heart cytochrome c as described under “Experimental procedures.” Note that, in the absence of the HIGD1 proteins, continuous ET through CIV leads to an exponential decline in CIV activity (verified by curve fitting to a single exponential using GraphPad Prism; data not shown). The traces were collected using broken mitochondria lacking a ΔΨ. In intact mitochondria lacking the HIGD1 proteins, the concomitant decrease in ΔΨ leads to an increase in the rate of O2 consumption that offsets and therefore masks the decrease in CIV activity caused by CIV inactivation. B–D, representative traces of safranin fluorescence during continuous state 2 ET through CIV in intact mitochondria. Continuous ET in intact mitochondria is driven by 5 mm ascorbate and 0.1 mm TMPD as described under “Experimental procedures.” B, black line, Δrcf1;Δrcf2; gray line, Δrcf1;Δrcf2;Δcor1. C, black line, WT; gray line, Δcor1. D, black line, Δrcf1; gray line, Δrcf2.
On the same timescale that the population of inactivated CIV was increasing in mitochondria lacking the HIGD1 proteins, a further exponential loss of ΔΨ was consistently observed during continuous ET (Fig. 6B). (Single exponential kinetics were verified by curve fitting; data not shown.) In contrast, such a loss of ΔΨ was not observed in mitochondria that contained the HIGD1 proteins (Fig. 6C) and did not show an increase in inactivated CIV during continuous ET (Fig. 6A). The kinetic traces explained above show that increasing amounts of inactivated CIV correlate with increasing proton leak. This strongly suggests that proton leak takes place through inactivated CIV.
We tested whether the loss of CIV activity (i.e. the ability to generate ΔΨ) that occurs during the 2- to 4-min period of the experiments shown in Fig. 6B is sufficient to cause the observed decrease in ΔΨ. From the data in Fig. 6A, the activity lost by CIV of Δrcf1;Δrcf2 mitochondria over a 4-min period is ∼30%. Using data (not shown) where we examined how the percentage of safranin uptake varies with CIV activity during ΔΨ measurements, we estimate that a 30% loss of ET activity could lead to a 5% decline in the percentage of safranin uptake in experiments performed as described. However, the data for Δrcf1;Δrcf2 mitochondria in Fig. 6B show a 25% decline in the percentage of safranin uptake over a 4-min period. Hence, we conclude that the bulk of this ΔΨ loss during continuous activity cannot be explained by decreased generation of ΔΨ because of slowing ET. Rather, we assign the loss of ΔΨ during continuous activity to increasing proton leak.
Both Rcf1 and Rcf2 contribute to the prevention of the inactivation of CIV and to the resulting loss of ΔΨ. As discussed above, intact mitochondria lacking either one of HIGD1 proteins showed a lower uncontrolled TN than normal mitochondria (Fig. 5A), indicative of a greater content of inactive CIV in the IMM. The difference in the molecular activities of CIV of Δrcf1 and of Δrcf2 is not large (Fig. 5A), suggesting that Rcf1 and Rcf2 have a similar capability to prevent the inactivation of CIV. Their effects are additive, however, because the expression of both HIGD1 proteins is required for the normal pool of active CIV proteins. Decreasing ΔΨ during continuous CIV activity was also observed in mitochondria lacking only Rcf1 or Rcf2 (Fig. 6D), but to a lesser extent than in mitochondria lacking both of the HIGD1 proteins.
In Δrcf1;Δrcf2 mitochondria, where CIII generates less ΔΨ than normal because enhanced proton leak is taking place (Fig. 3), cyanide was present to inhibit all of the active CIV. This rules out a mechanism in which the absence of the HIGD1 proteins leads to altered chemistry during the catalytic cycle of CIV to allow proton leak through active CIV.
Discussion
In a recent study (8), we found that the HIGD1 proteins of yeast were required for mitochondrial electron transfer through CIV to generate and maintain a normal membrane potential. In that report, we proposed that the lower ΔΨ was either due to diminished proton pumping by CIV or enhanced proton leak through some transmembrane component in the IMM (8). In this study, we determined the following, as detailed under “Results”: the low ΔΨ observed in the absence of the HIGD1 proteins is due to enhanced proton leak through some component in the IMM, the component that leaks is CIV, and proton leak appears to take place through a population of inactivated CIV.
These findings allow us to conclude that one function of the HIGD1 proteins in yeast is to prevent inactivation of CIV during electron transfer. Because the prevention of suicide inactivation is a primary function of Cox3 of CIV (14, 30–32), the conclusion reinforces our proposal that the HIGD1 proteins are exerting their influence on CIV via Cox3 (1, 7, 8). A proposed mechanism that links the HIGD1 proteins to CIV inactivation and to proton leak is described below.
Suicide inactivation of CIV: the role of Cox3 and its bound lipids
The heme aa3–type cytochrome c oxidases exhibit a tendency to suicide-inactivate, defined as spontaneous, irreversible loss of activity during catalytic turnover (28–30). Even though the probability of inactivation during any single catalytic cycle is low, an increase in this probability can lower the life span of a CIV molecule from millions of catalytic cycles to only thousands (14, 33). Inactivation results from ligand rearrangements at the heme a3–CuB site of O2 reduction in Cox1 during a specific step in the catalytic cycle (16, 31, 32). One of the three subunits that comprise the conserved catalytic core of the heme aa3–type cytochrome c oxidases is Cox3, the lipid-binding partner of Cox1 (32, 34) (Fig. 1A). A primary function of Cox3 is to lower the probability (up to 500-fold) that suicide inactivation will take place during any given catalytic cycle (32), thus saving the cell from having to frequently resynthesize a major bioenergetic machine. Cox3 prevents suicide inactivation by supporting the structure of the heme a3–CuB active site in Cox1 as well as by facilitating proton transfer through a pathway that delivers protons to the active site as well as to the proton pump (14, 31). The lipids bound within the central cleft of V-shaped Cox3 (Fig. 1A) are essential for its ability to prevent inactivation (14). The residues that coordinate Cox3's lipids are conserved throughout the family of aa3-type cytochrome c oxidases, from bacteria to yeast to humans. Alteration of lipid position or occupancy by site-directed mutation of lipid binding residues in the aa3-type CIV of Rhodobacter sphaeroides decreased the expected number of catalytic cycles before inactivation ∼100-fold (14).
The HIGD1 proteins function to protect CIV from suicide inactivation
Several lines of evidence indicate that suicide inactivation of yeast CIV is more probable in the absence of the HIGD1 proteins. The isolation of CIV from yeast mitochondria lacking Rcf1 or Rcf2 revealed the presence of inactivated enzyme (27). In Fig. 5A, the accumulation of inactivated CIV in the IMM is indicated by a decrease in the apparent TN of CIV (e− per second per CIV) in mitochondria lacking either Rcf1 or Rcf2 and especially in the absence of both HIGD1proteins.
Experimentally, suicide inactivation of CIV appears as the exponential loss of activity in a population of CIV during continuous electron transfer (28, 29). This was observed for CIV in mitochondria lacking the HIGD1 proteins (Fig. 6A). In the absence of the HIGD1 proteins, continuous ET through CIV leads to an exponential loss of CIV activity.
Importantly, active-site structural changes that are characteristic of suicide inactivation (28) have been documented in the CIV that accumulates in yeast mitochondria in the absence of Rcf1, including altered binding of cyanide in the active site and a lowered redox potential for heme a3 (35, 36). Thus, the sum of the evidence suggests that the HIGD1 proteins normally function to lower the probability of suicide inactivation and thereby prevent excessive accumulation of suicide-inactivated CIV.
In its assembly role, Rcf1 binds to newly synthesized Cox3 before Cox3 binds to Cox1 (1, 7). Because Cox3 must attain its V-shape to dock with Cox1 (Fig. 1A), and the lipids of the cleft appear to be necessary for this configuration of Cox3, it seems likely that Rcf1 enhances CIV assembly by facilitating lipid insertion into Cox3. Even after assembly of CIV, the bound lipids of Cox3 are in contact with the lipid bilayer (11, 12). Slow exchange of the bound lipids with membrane lipids may occur, and disturbed binding of lipids in the cleft of Cox3 has been shown to promote suicide inactivation (14). We propose that Rcf1 and Rcf2 form temporary associations with Cox3 of fully assembled CIV to facilitate the maintenance and/or restoration of normal lipid binding in the cleft of Cox3. A specific lipid delivery interaction is consistent with the finding that the lipid composition of the IMM in the absence of Rcf1 and Rcf2 appears to be unchanged from the WT (7).3
Although our hypothesis of lipid delivery is an extension of the assembly role proposed for Rcf1 with Cox3, Rcf2 is not required for CIV assembly. However, Rcf2 does function to lessen the inactivation of CIV and the resulting proton leak through CIV (Fig. 5) (8). Thus, we include Rcf2 in our proposal for HIGD1 protein function with fully assembled CIV. Rcf2 is proposed to contain a transmembrane domain similar to that of Rcf1, after a processing event (4).
Suicide-inactivated CIV and proton leak across the IMM
We proposed that increased amounts of inactivated CIV leads to increased proton leak back across the IMM. Why might inactivated CIV have such a leak? Proton pumping by CIV requires a gate that prevents protons from flowing back through Cox1 to the inner (negative) side of the IMM, i.e. a device that normally prevents proton backleak (37–39) (Fig. 1B). Proton transfer pathways lead to this gate from the inner (negative) surface of the IMM and away from this gate to the outer (positive) surface (Fig. 1B). The structural elements of the gate are located close to the heme a3–CuB O2 reduction site (10–13). Proton leak likely occurs as the active site structural changes associated with suicide inactivation (28, 32) allow the nearby proton gate to adopt a conformation suitable for the backleak of protons across the IMM (Fig. 1B).
Conclusions
The work of this report plus earlier studies (1, 7, 8) elucidate functions for the HIGD1 proteins of yeast and allow us to begin to postulate mechanisms. First, Rcf1 functions as an assembly protein for Cox3 of CIV (1). It seems likely that, by binding to Cox3, Rcf1 maintains the structure of Cox3 in a conformation suitable for lipid binding, which, in turn, is necessary for docking with Cox1 (14). The enhancement of CIV assembly by Rcf1 maintains normal levels of CIV in the IMM and, thereby, normal levels of the III2–IV2 supercomplex (1, 7, 8). Second, both Rcf1 and Rcf2 function to maintain normal mitochondrial membrane potential (1). In this role, we propose that the HIGD1 proteins prevent suicide inactivation of fully assembled CIV and the accumulation of inactivated CIV in the IMM. In turn, this prevents enhanced proton leak across the IMM.
These results are likely to be informative regarding the function of related proteins in mammalian mitochondria, including humans. The HIGD1A protein of mammals is related to Rcf1 and Rcf2 of yeast (7). Using fluorescence microscopy, Li et al. (40) have shown that knockdown of human HIGD1A in cultured cells lowers mitochondrial membrane potential, whereas overexpression of HIGD1A protects.
Experimental procedures
Saccharomyces cerevisiae strains and growth conditions
All of the yeast strains used in this study (each is denoted here in bold) have the genotype of WT W303-1A (Mat α, leu2, trp1, ura3, hid3, ade2) plus the following: Δrcf1 (RCF1::HIS3) (1), Δrcf2 (RCF2::HIS3) (1), Δrcf1; Δrcf2 (RCF1::HIS3, RCF2::KAN) (1), Δcox11 (COX11::HIS) (25), Δrcf1;Δrcf2;Δcox11 (COX11::HIS, RCF1::HIS, RCF2::KAN) (this study), Δcor1 (COR1::HIS) (26), and Δrcf1;Δrcf2;Δcor1 (COR1::HIS, RCF1::HIS, RCF2::KAN) (this study). Generation of the Δrcf1;Δrcf2;Δcox11 and Δrcf1;Δrcf2;Δcor1 strains was achieved by crossing the respective parent strains, i.e. Δrcf1;Δrcf2 with Δcox11 or Δcor1, followed by diploid selection, sporulation, tetrad dissection, and genotyping of the resulting tetrad spores. In the case of the Δrcf1;Δrcf2;Δcox11 strain, the initial genetic cross was achieved using a matα version of the Δrcf1;Δrcf2 parent.
All strains were plated on yeast extract/peptone/dextrose agar using standard protocols at 30 °C. Cells for the isolation of mitochondria were grown in liquid culture in YP, 2% galactose, 0.5% lactate (YPGal-lac (pH 5.5)). Strains Δcox11, Δrcf1;Δrcf2;Δcox11, Δcor, and Δrcf1;Δrcf2;Δcor1 were weaned from dextrose by first growing them in liquid cultures of YPGal-lac containing 1% dextrose and then YPGal-lac containing 0.2% dextrose before growth in YPGal-lac without dextrose. The A580 nm at the time of harvest was 1.5–2 for all strains.
Isolation of intact mitochondria
Yeast intact mitochondria were isolated from spheroplasts by established experimental procedures (41) with modifications. Briefly, yeast cells (7–36 g) were collected by centrifugation at 3000 × g for 10 min, weighed, and washed once with 100–200 ml of nanopure water. To make spheroplasts, cells were suspended at 7 ml/g of cells in 1.2 m sorbitol, 50 mm HEPES, 1 mm EDTA, and 1 mm DTT (pH 7.4). Zymolase®-20T (Sunrise Science Products) was added at 3 mg/g of cells, and the cells were shaken for 30 min at 200 rpm at 30 °C or until the A580 nm was 10–20% of its value prior to addition of Zymolase. The resulting spheroplasts were collected by centrifugation at 3000 × g for 10 min and then lysed by addition of 2 volumes of 250 mm sucrose, 50 mm HEPES, 1 mm EDTA, and 1 mm PMSF (pH 7.4). Cell debris was removed by centrifugation for 10 min at 2000 × g at 4 °C. Intact mitochondria were collected by centrifugation at 7000 × g for 15 min at 4 °C. The volume of the pellet was estimated, and the pellet was resuspended in 0.3–0.5 volumes of 250 mm sucrose, 1 mm EDTA, and 20 mm MOPS (pH 7.2). Mitochondrial protein concentrations (usually 10–20 mg/ml) were measured using the Bio-Rad DC Protein Assay. Aliquots of 30 μl of suspended mitochondria were frozen in liquid nitrogen and stored at −80οC. Mitochondrial aliquots were thawed immediately before use and discarded after 1 h on ice.
Preparation of broken mitochondria
Aliquots of frozen intact mitochondria, prepared as above, were pelleted at 10,000 × g for 10 min at 4 °C and then resuspended in an equal volume of 20 mm Tris (pH 7.4). The suspension was fast-frozen in liquid nitrogen and then thawed rapidly for a total of three freeze/thaw cycles. Broken mitochondria were used immediately.
Spectroscopic determination of the content of CIII and CIV
Intact mitochondria or broken mitochondria (5–10 mg) were solubilized in 1.1 ml of 50 mm Tris (pH 7.4) plus 2% dodecyl maltoside (Anatrace). Proteinase-free RNase-DNase (Fisher) with 1 mm MgCl2 was added to digest nucleic acids for 10 min at room temperature. The sample was passed through a 10-mm-diameter, 0.2-μm pore size, low-protein-binding filter (Millipore), and a clear solution was obtained by centrifugation at 10,000 × g for 10 min at 4 °C. Sample and reference cuvettes were filled with 450 μl of the solution. Solid sodium dithionite was added to the sample and solid potassium ferricyanide to the reference, and difference spectra were collected from 500–700 nm using a Hitachi U-3000 spectrophotometer. The concentration of CIV was determined from ΔA at 604 minus 630 nm, with an extinction coefficient of 26 mm−1 cm−1. The concentration of CIII was determined from ΔA at 560 minus 575 nm with an extinction coefficient of 51.2 mm−1 cm−1 (for the absorbance of both the bL and bH hemes) (42).
Complex III activity
CIII activity was measured in a Hitachi U-3000 spectrophotometer at 25 °C as the time-dependent reduction of potassium ferricyanide to colorless ferrocyanide at 420 nm using a measured extinction coefficient of 1.04 mm−1 cm−1. For controlled (coupled) CIII activity, the reaction mixture contained 250 mm sucrose, 20 mm MOPS, 5 mm KH2PO4, 1 mm MgCl2, 100 μm EDTA, 100 μm EGTA, 1 mg/ml defatted BSA, 5 mm KCN, 3 mm K3Fe(CN)6, and 0.1–0.2 mg of intact mitochondria (pH 7.2). The reaction was initiated by addition of NADH to 1 mm or ethanol to 20 mm. The rate of state 2 (no ADP) ferricyanide reduction was linear for 1–3 min. Rates of ferricyanide reduction that were insensitive to 5 μm myxothiazol and 5 μm antimycin A were subtracted. Uncontrolled (uncoupled) CIII activity was measured as above, but the mitochondria were uncoupled with 9 nm valinomycin and 0.4 μm CCCP or with 10 μm CCCP alone.
Complex IV activity
Complex IV activity was measured at 25 °C as the rate of oxygen consumption using an Oroboros FluoRespirometer. Ascorbate and TMPD were used to donate electrons to soluble cytochrome c. Rates of nonenzymatic reduction of O2 by ascorbate/TMPD/cytochrome c were subtracted from all rates obtained after the addition of mitochondria.
For controlled (coupled) CIV activity, the reaction mixtures contained 0.6 m mannitol, 20 mm MOPS (pH 7.2), 10 mm KH2PO4, 5 mm MgCl2, 50 mm KCl, 1 mm EDTA, 100 μm EGTA, 2 μg/ml catalase, 1 mg/ml defatted BSA, 5 mm ascorbate, 0.1 mm TMPD, and 5 μm antimycin A to inhibit CIII. Uncontrolled (uncoupled) CIV activity was measured as above, but the mitochondria were uncoupled with 9 nm valinomycin and 0.4 μm CCCP or with 10 μm CCCP alone.
Alternatively, uncontrolled CIV activity was measured using broken mitochondria in a reaction mixture of 50 mm Tris (pH 7.4), 8 mm KCl, 1 mm EDTA, 2 μg/ml catalase, 5 mm ascorbate, 0.1 mm TMPD, and 20 μm horse heart cytochrome c at 25 °C. Reactions were initiated by addition of 0.1–0.2 mg of broken mitochondria.
Calculation of TN
Turnover numbers for CIII and CIV were calculated by dividing the rate of ET, as nanomole e¯ per second, by the amount of either complex, in nanomoles, to obtain e¯ per second per complex.
Measurements of safranin uptake driven by CIII or CIV activity in intact mitochondria
Using the conditions described above for state 2, controlled CIII ET in intact mitochondria, fluorescence quenching representing the uptake of the membrane-permeable, cationic, fluorescent dye safranin O (2 μm) (43) was measured using a Jasco FP8000 fluorimeter (excitation/emission at 520 nm/580 nm) or an Oroboros FluoRespirometer (excitation/emission at 485 nm/586 nm). After full quenching of safranin fluorescence (full development of membrane potential), the addition of uncoupler (9 nm valinomycin and 0.4 μm CCCP or 10 μm CCCP alone) caused full release of safranin from the matrix. The percentage of safranin uptake was calculated as in Strogolova et al. (8). Safranin uptake driven by CIV activity in intact mitochondria was measured by similar experimental procedures, as described previously (8), using the conditions described above for controlled CIV activity plus 2 μm safranin.
Statistical analysis
Data were collected from three to ten mitochondrial preparations for each strain and expressed as mean ± S.D. The significance between measurements was determined by unpaired Student t test using GraphPad Prism 8. Each experimental group was compared only with the WT control and not with other experimental groups. All p values lower than 0.05 were considered statistically significant.
Author contributions
N. H. H., R. A. S., and J. H. conceptualization; N. H. H., V. S., J. J. M., R. A. S., and J. H. investigation; N. H. H., V. S., J. J. M., R. A. S., and J. H. methodology; N. H. H., R. A. S., and J. H. writing-review and editing; R. A. S. and J. H. supervision; R. A. S. and J. H. funding acquisition; J. H. writing-original draft; J. H. project administration.
Supplementary Material
Acknowledgments
We thank Jodie Box for technical assistance and discussions. We also thank Dr. Antoni Barrientos (University of Miami) and Dr. Alex Tzagoloff (Columbia University) for the kind gifts of the Δcox11 and Δcor1 strains, respectively.
This work was supported by the NIGMS, National Institutes of Health Grants P20GM121334 (to J. H.) and R15GM101594 and R15GM117551 (to R. A. S). The authors declare that they have no conflicts of interest with the contents of this article.
This article contains Fig. S1.
S. Claypool, personal communication.
Please note that the JBC is not responsible for the long-term archiving and maintenance of this site or any other third party–hosted site.
- IMM
- inner mitochondrial membrane
- CIII
- complex III
- CIV
- complex IV
- ET
- electron transfer
- Δψ
- membrane potential across the inner mitochondrial membrane
- TN
- turnover number
- CCCP
- carbonyl cyanide p-chlorophenylhydrazone
- TMPD
- N,N,N′,N′-tetramethyl-p-phenylenediamine.
References
- 1. Strogolova V., Furness A., Robb-McGrath M., Garlich J., and Stuart R. A. (2012) Rcf1 and Rcf2, members of the hypoxia-induced gene 1 protein family, are critical components of the mitochondrial cytochrome bc1-cytochrome c oxidase supercomplex. Mol. Cell. Biol. 32, 1363–1373 10.1128/MCB.06369-11 [DOI] [PMC free article] [PubMed] [Google Scholar]
- 2. Vukotic M., Oeljeklaus S., Wiese S., Vögtle F. N., Meisinger C., Meyer H. E., Zieseniss A., Katschinski D. M., Jans D. C., Jakobs S., Warscheid B., Rehling P., and Deckers M. (2012) Rcf1 mediates cytochrome oxidase assembly and respirasome formation, revealing heterogeneity of the enzyme complex. Cell Metab. 15, 336–347 10.1016/j.cmet.2012.01.016 [DOI] [PubMed] [Google Scholar]
- 3. Chen Y. C., Taylor E. B., Dephoure N., Heo J. M., Tonhato A., Papandreou I., Nath N., Denko N. C., Gygi S. P., and Rutter J. (2012) Identification of a protein mediating respiratory supercomplex stability. Cell Metab. 15, 348–360 10.1016/j.cmet.2012.02.006 [DOI] [PMC free article] [PubMed] [Google Scholar]
- 4. Römpler K., Müller T., Juris L., Wissel M., Vukotic M., Hofmann K., and Deckers M. (2016) Overlapping role of respiratory supercomplex factor Rcf2 and its N-terminal homolog Rcf3 in Saccharomyces cerevisiae. J. Biol. Chem. 291, 23769–23778 10.1074/jbc.M116.734665 [DOI] [PMC free article] [PubMed] [Google Scholar]
- 5. Winge D. R. (2012) Sealing the mitochondrial respirasome. Mol. Cell. Biol. 32, 2647–2652 10.1128/MCB.00573-12 [DOI] [PMC free article] [PubMed] [Google Scholar]
- 6. Cui T. Z., Conte A., Fox J. L., Zara V., and Winge D. R. (2014) Modulation of the respiratory supercomplexes in yeast: enhanced formation of cytochrome oxidase increases the stability and abundance of respiratory supercomplexes. J. Biol. Chem. 289, 6133–6141 10.1074/jbc.M113.523688 [DOI] [PMC free article] [PubMed] [Google Scholar]
- 7. Garlich J., Strecker V., Wittig I., and Stuart R. A. (2017) Mutational analysis of the QRRQ motif in the yeast Hig1 type 2 protein Rcf1 reveals a regulatory role for the cytochrome c oxidase complex. J. Biol. Chem. 292, 5216–5226 10.1074/jbc.M116.758045 [DOI] [PMC free article] [PubMed] [Google Scholar]
- 8. Strogolova V., Hoang N. H., Hosler J., and Stuart R. A. (2019) The yeast mitochondrial proteins Rcf1 and Rcf2 support the enzymology of the cytochrome c oxidase complex and generation of the proton motive force. J. Biol. Chem. 294, 4867–4877 10.1074/jbc.RA118.006888 [DOI] [PMC free article] [PubMed] [Google Scholar]
- 9. Muramoto K., Hirata K., Shinzawa-Itoh K., Yoko-o S., Yamashita S. E., Aoyama H., Tsukihara T., and Yoshikawa S. (2007) A histidine residue acting as a controlling site for dioxygen reduction and proton pumping by cytochrome c oxidase. Proc. Natl. Acad. Sci. U.S.A. 104, 7881–7886 10.1073/pnas.0610031104 [DOI] [PMC free article] [PubMed] [Google Scholar]
- 10. Svensson-Ek M., Abramson J., Larsson G., Törnroth S., Brzezinski P., and Iwata S. (2002) The X-ray crystal structures of wild-type and EQ(I-286) mutant cytochrome c oxidases from Rhodobacter sphaeroides. J. Mol. Biol. 321, 329–339 [DOI] [PubMed] [Google Scholar]
- 11. Hartley A. M., Lukoyanova N., Zhang Y., Cabrera-Orefice A., Arnold S., Meunier B., Pinotsis N., and Maréchal A. (2019) Structure of yeast cytochrome c oxidase in a supercomplex with cytochrome bc1. Nat. Struct. Mol. Biol. 26, 78–83 10.1038/s41594-018-0172-z [DOI] [PMC free article] [PubMed] [Google Scholar]
- 12. Rathore S., Berndtsson J., Marin-Buera L., Conrad J., Carroni M., Brzezinski P., and Ott M. (2019) Cryo-EM structure of the yeast respiratory supercomplex. Nat. Struct. Mol. Biol. 26, 50–57 10.1038/s41594-018-0169-7 [DOI] [PubMed] [Google Scholar]
- 13. Shinzawa-Itoh K., Aoyama H., Muramoto K., Terada H., Kurauchi T., Tadehara Y., Yamasaki A., Sugimura T., Kurono S., Tsujimoto K., Mizushima T., Yamashita E., Tsukihara T., and Yoshikawa S. (2007) Structures and physiological roles of 13 integral lipids of bovine heart cytochrome c oxidase. EMBO J. 26, 1713–1725 10.1038/sj.emboj.7601618 [DOI] [PMC free article] [PubMed] [Google Scholar]
- 14. Varanasi L., Mills D., Murphree A., Gray J., Purser C., Baker R., and Hosler J. (2006) Altering conserved lipid binding sites in cytochrome c oxidase of Rhodobacter sphaeroides perturbs the interaction between subunits I and III and promotes suicide inactivation of the enzyme. Biochemistry 45, 14896–14907 10.1021/bi061390q [DOI] [PubMed] [Google Scholar]
- 15. Zhou S., Pettersson P., Huang J., Sjöholm J., Sjöstrand D., Pomès R., Högbom M., Brzezinski P., Mäler L., and Ädelroth P. (2018) Solution NMR structure of yeast Rcf1, a protein involved in respiratory supercomplex formation. Proc. Natl. Acad. Sci. U.S.A. 115, 3048–3053 10.1073/pnas.1712061115 [DOI] [PMC free article] [PubMed] [Google Scholar]
- 16. Mills D. A., Tan Z., Ferguson-Miller S., and Hosler J. (2003) A role for subunit III in proton uptake into the D pathway and a possible proton exit pathway in Rhodobacter sphaeroides cytochrome c oxidase. Biochemistry 42, 7410–7417 10.1021/bi0341307 [DOI] [PubMed] [Google Scholar]
- 17. Nguyen X. T., Pabarue H. A., Geyer R. R., Shroyer L. A., Estey L. A., Parilo M. S., Wilson K. S., and Prochaska L. J. (2002) Biochemical and biophysical properties of purified phospholipid vesicles containing bovine heart cytochrome c oxidase. Protein Expr. Purif. 26, 122–130 10.1016/S1046-5928(02)00503-X [DOI] [PubMed] [Google Scholar]
- 18. Sarti P., Jones M. G., Antonini G., Malatesta F., Colosimo A., Wilson M. T., and Brunori M. (1985) Kinetics of redox-linked proton pumping activity of native and subunit III-depleted cytochrome c oxidase: a stopped-flow investigation. Proc. Natl. Acad. Sci. U.S.A. 82, 4876–4880 10.1073/pnas.82.15.4876 [DOI] [PMC free article] [PubMed] [Google Scholar]
- 19. Crofts A. R., Holland J. T., Victoria D., Kolling D. R., Dikanov S. A., Gilbreth R., Lhee S., Kuras R., and Kuras M. G. (2008) The Q-cycle reviewed: how well does a monomeric mechanism of the bc1 complex account for the function of a dimeric complex? Biochim. Biophys. Acta 1777, 1001–1019 10.1016/j.bbabio.2008.04.037 [DOI] [PMC free article] [PubMed] [Google Scholar]
- 20. Trumpower B. L. (1990) The protonmotive Q cycle: energy transduction by coupling of proton translocation to electron transfer by the cytochrome bc1 complex. J. Biol. Chem. 265, 11409–11412 [PubMed] [Google Scholar]
- 21. Luttik M. A., Overkamp K. M., Kötter P., de Vries S., van Dijken J. P., and Pronk J. T. (1998) The Saccharomyces cerevisiae NDE1 and NDE2 genes encode separate mitochondrial NADH dehydrogenases catalyzing the oxidation of cytosolic NADH. J. Biol. Chem. 273, 24529–24534 10.1074/jbc.273.38.24529 [DOI] [PubMed] [Google Scholar]
- 22. Hiser L., Di Valentin M., Hamer A. G., and Hosler J. P. (2000) Cox11p is required for stable formation of the CuB and magnesium centers of cytochrome c oxidase. J. Biol. Chem. 275, 619–623 10.1074/jbc.275.1.619 [DOI] [PubMed] [Google Scholar]
- 23. Thompson A. K., Smith D., Gray J., Carr H. S., Liu A., Winge D. R., and Hosler J. P. (2010) Mutagenic analysis of Cox11 of Rhodobacter sphaeroides: insights into the assembly of CuB of cytochrome c oxidase. Biochemistry 49, 5651–5661 10.1021/bi1003876 [DOI] [PMC free article] [PubMed] [Google Scholar]
- 24. Timón-Gómez A., Nývltová E., Abriata L. A., Vila A. J., Hosler J., and Barrientos A. (2018) Mitochondrial cytochrome c oxidase biogenesis: recent developments. Semin. Cell Dev. Biol. 76, 163–178 10.1016/j.semcdb.2017.08.055 [DOI] [PMC free article] [PubMed] [Google Scholar]
- 25. Tzagoloff A., Capitanio N., Nobrega M. P., and Gatti D. (1990) Cytochrome oxidase assembly in yeast requires the product of COX11, a homolog of the P. denitrificans protein encoded by ORF3. EMBO J. 9, 2759–2764 10.1002/j.1460-2075.1990.tb07463.x [DOI] [PMC free article] [PubMed] [Google Scholar]
- 26. Tzagoloff A., Wu M. A., and Crivellone M. (1986) Assembly of the mitochondrial membrane system: characterization of COR1, the structural gene for the 44-kilodalton core protein of yeast coenzyme QH2-cytochrome c reductase. J. Biol. Chem. 261, 17163–17169 [PubMed] [Google Scholar]
- 27. Rydström Lundin C., von Ballmoos C., Ott M., Ädelroth P., and Brzezinski P. (2016) Regulatory role of the respiratory supercomplex factors in Saccharomyces cerevisiae. Proc. Natl. Acad. Sci. U.S.A. 113, E4476–E4485 10.1073/pnas.1601196113 [DOI] [PMC free article] [PubMed] [Google Scholar]
- 28. Bratton M. R., Pressler M. A., and Hosler J. P. (1999) Suicide inactivation of cytochrome c oxidase: catalytic turnover in the absence of subunit III alters the active site. Biochemistry 38, 16236–16245 10.1021/bi9914107 [DOI] [PubMed] [Google Scholar]
- 29. Haltia T., Semo N., Arrondo J. L., Goñi F. M., and Freire E. (1994) Thermodynamic and structural stability of cytochrome c oxidase from Paracoccus denitrificans. Biochemistry 33, 9731–9740 10.1021/bi00198a044 [DOI] [PubMed] [Google Scholar]
- 30. Hosler J. P. (2004) The influence of subunit III of cytochrome c oxidase on the D pathway, the proton exit pathway and mechanism-based inactivation in subunit I. Biochim. Biophys. Acta 1655, 332–339 10.1016/j.bbabio.2003.06.009 [DOI] [PubMed] [Google Scholar]
- 31. Mills D. A., and Hosler J. P. (2005) Slow proton transfer through the pathways for pumped protons in cytochrome c oxidase induces suicide inactivation of the enzyme. Biochemistry 44, 4656–4666 10.1021/bi0475774 [DOI] [PubMed] [Google Scholar]
- 32. Ferguson-Miller S., and Hosler J. (2018) in Mechanisms of Primary Energy Transduction in Biology (Wikstrom M., ed.) pp. 215–248, Royal Society of Chemistry, Cambridge, UK [Google Scholar]
- 33. Varanasi L., and Hosler J. P. (2012) Subunit III-depleted cytochrome c oxidase provides insight into the process of proton uptake by proteins. Biochim. Biophys. Acta 1817, 545–551 10.1016/j.bbabio.2011.10.001 [DOI] [PMC free article] [PubMed] [Google Scholar]
- 34. Hosler J. P., Ferguson-Miller S., and Mills D. A. (2006) Energy transduction: proton transfer through the respiratory complexes. Annu. Rev. Biochem. 75, 165–187 10.1146/annurev.biochem.75.062003.101730 [DOI] [PMC free article] [PubMed] [Google Scholar]
- 35. Rydström Lundin C., and Brzezinski P. (2017) Modulation of O2 reduction in Saccharomyces cerevisiae mitochondria. FEBS Lett. 591, 4049–4055 10.1002/1873-3468.12918 [DOI] [PubMed] [Google Scholar]
- 36. Schäfer J., Dawitz H., Ott M., Ädelroth P., and Brzezinski P. (2018) Regulation of cytochrome c oxidase activity by modulation of the catalytic site. Sci. Rep. 8, 11397 10.1038/s41598-018-29567-4 [DOI] [PMC free article] [PubMed] [Google Scholar]
- 37. Brzezinski P., and Johansson A. L. (2010) Variable proton-pumping stoichiometry in structural variants of cytochrome c oxidase. Biochim. Biophys. Acta 1797, 710–723 10.1016/j.bbabio.2010.02.020 [DOI] [PubMed] [Google Scholar]
- 38. Liang R., Swanson J. M., Peng Y., Wikström M., and Voth G. A. (2016) Multiscale simulations reveal key features of the proton-pumping mechanism in cytochrome c oxidase. Proc. Natl. Acad. Sci. U.S.A. 113, 7420–7425 10.1073/pnas.1601982113 [DOI] [PMC free article] [PubMed] [Google Scholar]
- 39. Wikström M., Krab K., and Sharma V. (2018) Oxygen activation and energy conservation by cytochrome c oxidase. Chem. Rev. 118, 2469–2490 10.1021/acs.chemrev.7b00664 [DOI] [PMC free article] [PubMed] [Google Scholar]
- 40. Li T., Xian W. J., Gao Y., Jiang S., Yu Q. H., Zheng Q. C., and Zhang Y. (2019) Higd1a protects cells from lipotoxicity under high-fat exposure. Oxid. Med. Cell Longev. 2019, 6051262 [DOI] [PMC free article] [PubMed] [Google Scholar]
- 41. Ohnishi T., Kawaguchi K., and Hagihara B. (1966) Preparation and some properties of yeast mitochondria. J. Biol. Chem. 241, 1797–1806 [PubMed] [Google Scholar]
- 42. Covian R., and Trumpower B. L. (2008) The dimeric structure of the cytochrome bc1 complex prevents center P inhibition by reverse reactions at center N. Biochim. Biophys. Acta 1777, 1044–1052 10.1016/j.bbabio.2008.04.008 [DOI] [PMC free article] [PubMed] [Google Scholar]
- 43. Figueira T. R., Melo D. R., Vercesi A. E., and Castilho R. F. (2012) Safranine as a fluorescent probe for the evaluation of mitochondrial membrane potential in isolated organelles and permeabilized cells. Methods Mol. Biol. 810, 103–117 10.1007/978-1-61779-382-0_7 [DOI] [PubMed] [Google Scholar]
- 44. Krieger E., Joo K., Lee J., Lee J., Raman S., Thompson J., Tyka M., Baker D., and Karplus K. (2009) Improving physical realism, stereochemistry, and side-chain accuracy in homology modeling: four approaches that performed well in CASP8. Proteins 77, Suppl. 9, 114–122 10.1002/prot.22570 [DOI] [PMC free article] [PubMed] [Google Scholar]
Associated Data
This section collects any data citations, data availability statements, or supplementary materials included in this article.