Abstract
PURPOSE
This pilot study examined the ability to operationalize the collection of real-world data to explore the potential use of real-world end points extracted from data from diverse health care data organizations and to assess how these relate to similar end points in clinical trials for immunotherapy-treated advanced non–small-cell lung cancer.
PATIENTS AND METHODS
Researchers from six organizations followed a common protocol using data from administrative claims and electronic health records to assess real-world end points, including overall survival (rwOS), time to next treatment, time to treatment discontinuation (rwTTD), time to progression, and progression-free survival, among patients with advanced non–small-cell lung cancer treated with programmed death 1/programmed death-ligand 1 inhibitors in real-world settings. Data sets included from 269 to 6,924 patients who were treated between January 2011 and October 2017. Results from contributors were anonymized.
RESULTS
Correlations between real-world intermediate end points (rwTTD and time to next treatment) and rwOS were moderate to high (range, 0.6 to 0.9). rwTTD was the most consistent end points as treatment detail was available in all data sets. rwOS at 1 year post–programmed death-ligand 1 initiation ranged from 40% to 57%. In addition, rwOS as assessed via electronic health records and claims data fell within the range of median OS values observed in relevant clinical trials. Data sources had been used extensively for research with ongoing data curation to assure accuracy and practical completeness before the initiation of this research.
CONCLUSION
These findings demonstrate that real-world end points are generally consistent with each other and with outcomes observed in randomized clinical trials, which substantiates the potential validity of real-world data to support regulatory and payer decision making. Differences observed likely reflect true differences between real-world and protocol-driven practices.
INTRODUCTION
Randomized clinical trials (RCTs) are the optimal method by which to demonstrate causal effects between treatments and outcomes, but are often slow to accrue and expensive1 or are difficult to conduct because of practical or ethical reasons.2 Moreover, their results may not generalize to patients who are treated in the real-world setting.3 The unprecedented availability of real-world data (RWD), emergence of new RWD sources, improved analytic methods, and the accelerating need for clinical evidence in the face of constrained RCT resources has increased the demand for real-world evidence (RWE). Study of routinely collected health care data is increasingly important for various stakeholders who are interested in better understanding particular patient populations, evaluating drug safety in the postmarketing setting, measuring health care use and clinical outcomes, performing comparative effectiveness research, and optimizing drug pricing models.4 However, before RWD finds widespread use as an adjunct to—or in unique settings, an alternative for—RCTs, the validity of readily extractable clinical outcomes measures—real-world end points—must be established. A fundamental step is to characterize and contrast the patient populations and methods used for aggregation and curation of RWD across various sources to understand the natural variability of key parameters in real-world settings and the extent to which they differ from that observed under highly controlled settings.5
The US Congress and the US Food and Drug Administration (FDA) recognize the importance of further developing the use of RWD for regulatory decision making as evidenced by recent publications by the FDA6-8 and passage of the 21st Century Cures Act (Cures Act),9 and the Prescription Drug User Fee Act10 VI reauthorization.7 The Cures Act, passed in December 2016, requires the FDA to develop a framework for and issue guidance on the use of RWE for a new indication for an already-approved drug or for postmarket study as a requirement for regulatory approval. In addition, RWD comparator or benchmark data have been used in recent approvals of new cancer treatments on the basis of phase II trials.11,12
Academia, public and private companies, health policy organizations, and the FDA are working to establish best practices for the generation and evaluation of RWD in regulatory settings.8,13 To support these efforts, Friends of Cancer Research convened six organizations with oncology-focused health care data to conduct a pilot RWD project. The primary collective goals of the study were to agree on and execute a common protocol using diverse RWD and to explore how real-world end points could be used to rapidly address clinically relevant questions about treatment effectiveness.
A framework was established for data collection, end point definitions, and planned analyses, with flexibility incorporated to allow for differences in data elements across multiple RWD sources. The project examined patients with advanced non–small-cell lung cancer (aNSCLC) who were treated with programmed death 1/programmed death-ligand 1 [PD-(L)1] inhibitors in the real-world setting. Initial results and potential implications were presented publicly at The Future Use of Real-World Evidence meeting hosted by Friends of Cancer Research in Washington, DC, on July 10, 2018.
PATIENTS AND METHODS
Study Design and Objectives
Data sets generated for this study included relevant and accessible patient-level RWD for eligible individuals. The project had three key objectives:
Identify, describe, and compare the demographic and clinical characteristics of eligible patients in each data source.
Assess the ability to operationalize a common protocol and generate real-world (rw) end points [overall survival (rwOS), progression-free survival (rwPFS), time to progression (rwTTP), time to next treatment (rwTTNT), and time to treatment discontinuation (rwTTD)].
Assess how rwOS compares with clinical end points as measured in RCTs.
General approaches to identifying analytic populations, defining specific variables, and conducting analyses were discussed and agreed on by all participating organizations or networks. Given the variability of the types of data and data sources available, these general approaches were tailored to each of the six contexts, as data sources differed, and may have included data from health claims, electronic health records (EHRs), data that had been extracted from text or other unstructured fields in medical charts, or some combination of these data sources. We conducted and completed database analyses within approximately 3 months from the completion of the broad study protocol.
Study Populations and Inclusion and Exclusion Criteria
Eligible patients included those who were diagnosed with aNSCLC on or after January 1, 2011. Patients were identified as having aNSCLC if they were diagnosed initially with American Joint Committee on Cancer stage IIIB or IV NSCLC, or with early-stage NSCLC with evidence of recurrence or progression described or documented in available data. Treatment with a PD-(L)1 inhibitor was identified from each organization’s data sources, which may have included a medication order, a claim, or infusion databases in EHRs. To limit analyses to patients who could have been observed by health care providers who were represented in each participating organization’s databases, patients had to have at least two documented clinical visits during the calendar period of interest as defined above or, alternatively, in integrated health care systems, evidence of continuous enrollment in the health plan, defined as no gap in insurance coverage greater than 90 days. For claims data sources, in which stage and progression data were not typically available, patients were included if they received treatment with a PD-(L)1 inhibitor after a diagnosis of lung cancer. During the project timeframe, insurer coverage for these agents required evidence of advanced disease as defined above. Data were sought for patients with lung cancer who were diagnosed as early as January 2011 and who initiated treatment with a PD-(L)1 inhibitor between January 2014 and October 2017, which allowed for at least 6 months of potential follow-up and identification of prior lines of therapy. End of follow-up varied by participating organization on the basis of the most recent date of reasonably complete information on outcomes of interest, with some data sets having documentation of outcomes as recent as April 30, 2018.
Patients were excluded if they had a date of diagnosis more than 90 days before the first activity date—visit or treatment administration—on the assumption that this reflected missing data on historical treatment.
Participating Organizations and Data Sources
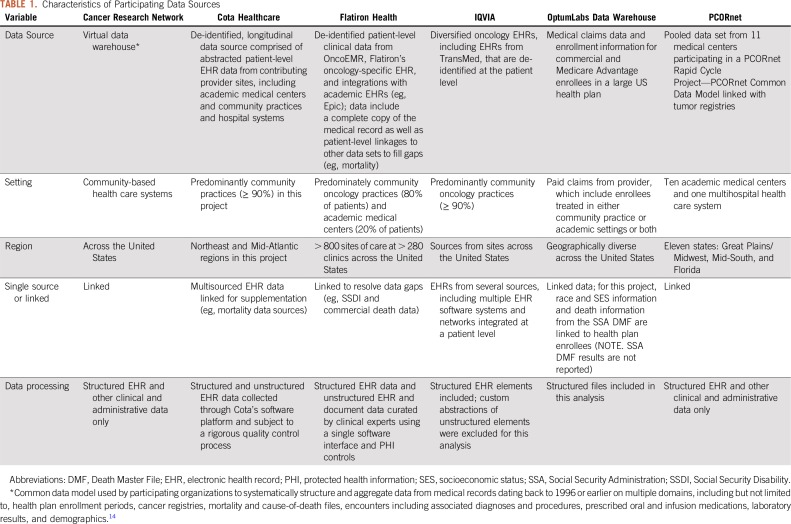
Data partners represent a range of care models in the United States, from community oncology centers, health systems, academic medical centers, and integrated delivery system networks to mixtures of these care settings. Data curation included different approaches that were unique to each participant, including natural language processing, artificial intelligence tools, and technology-enabled abstraction and general chart review. Key characteristics of the data sources are listed in Table 1.
TABLE 1.
Characteristics of Participating Data Sources
All data partners in this pilot project have been using their data extensively for research over many years. Consequently, each has used a variety of curation processes designed to evaluate the quality and completeness and to strengthen data management processes to assure reliable data integration and transformations, as needed for research conduct. Thus, these research-ready networks are not typical of EHR data in general, nor of health insurance claims data that have not been subjected to such ongoing data curation.
End Point Definitions
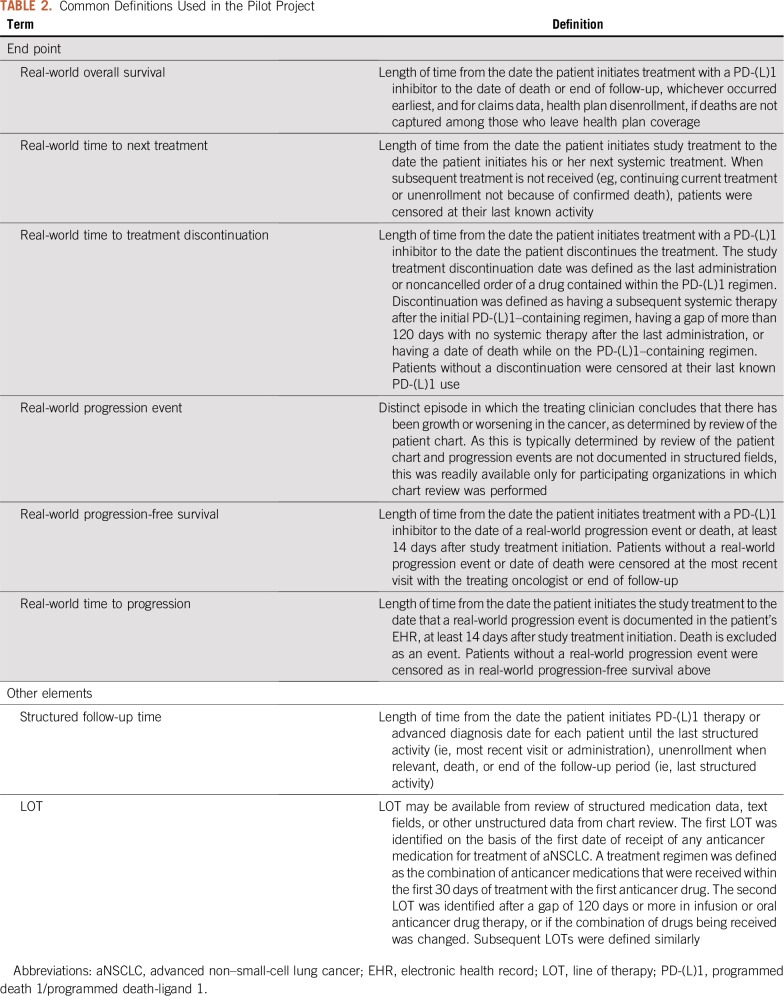
Each data provider used the agreed upon definitions to calculate end points (Table 2). Study treatment refers to treatment with a PD-(L)1 inhibitor, defined here as treatment with nivolumab, pembrolizumab, or atezolizumab.
TABLE 2.
Common Definitions Used in the Pilot Project
Statistical Analysis
Each data provider analyzed their own data, as is common in many federated research networks and, hence, there may have been specific nuances to each data source that are not captured directly in the above definitions. Results were shared with Friends of Cancer Research, who, as a neutral third party, summarized the findings in an anonymous fashion. Patient, tumor, and treatment characteristics were analyzed using descriptive statistics. Continuous variables were summarized using medians and interquartile ranges. Categorical variables were calculated as frequencies. We used Kaplan-Meier methods to estimate time-to-event end points with 95% CIs estimating median times to event. Correlations between rwOS and each time-to-event end point were calculated using Spearman’s rank-order correlation. Correlation analysis was restricted to those patients who had experienced both death and the event of interest.
RESULTS
Patient Identification and Characteristics
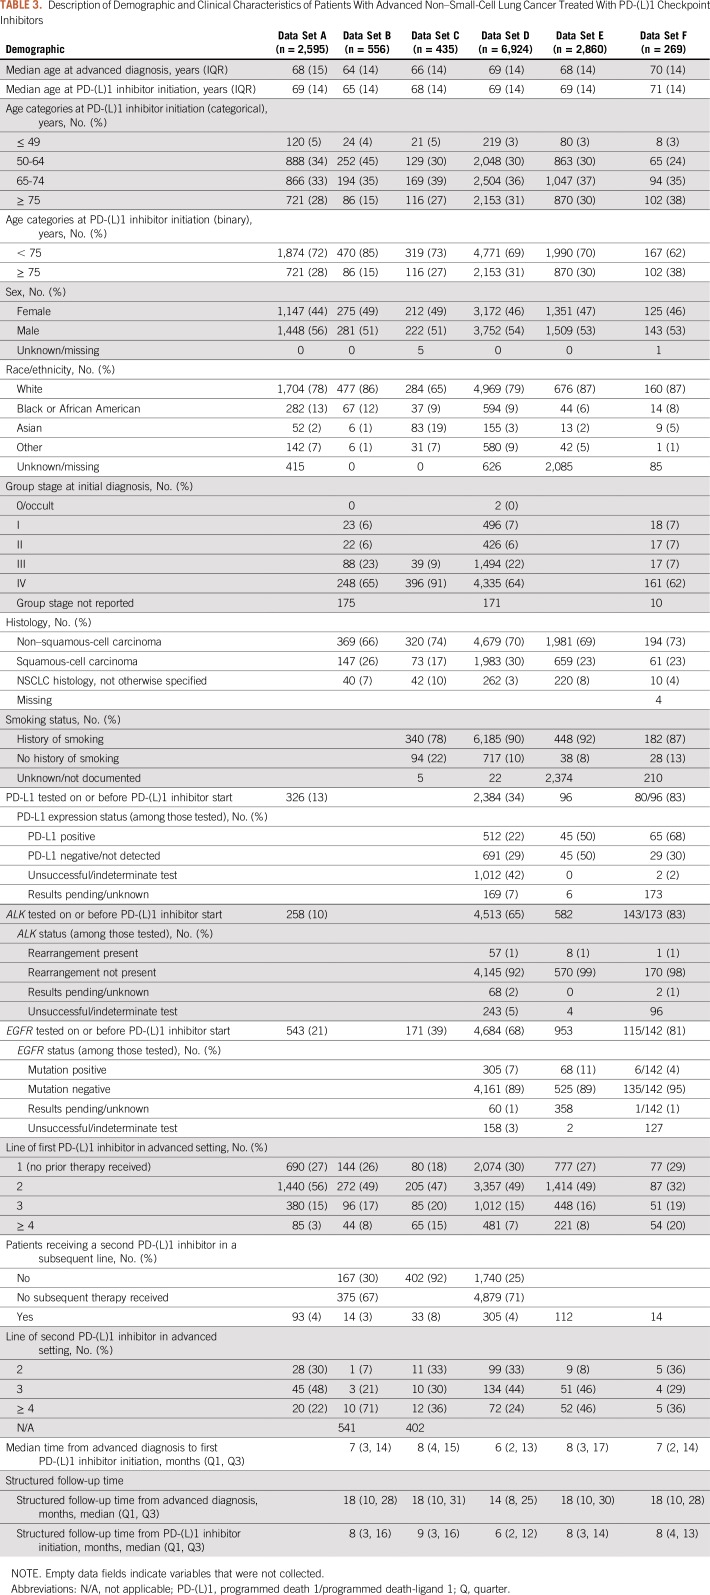
Table 3 lists the demographic and clinical characteristics of each patient population. The six data sets included 269 to 6,924 patients with lung cancer who were diagnosed as early as January 1, 2011, and who initiated treatment with a PD-(L)1 inhibitor between January 1, 2014, and October 30, 2017. Median age at diagnosis of lung cancer ranged from 64 to 70 years. Data sets were composed of 50% to 56% male patients and a large majority of patients (65% to 87%) were white with 6% to 13% Black or African American. Source and missing data of information on race/ethnicity varied significantly by data set. In data set C, 19% of patients were identified as Asian, otherwise, Asians represented 1% to 5% of the cohort. Median household income information was available for only two of the six data sets. Information on tobacco use was available in four datasets and, as expected, most patients (78% to 92%) were documented as having a history of tobacco smoking.
TABLE 3.
Description of Demographic and Clinical Characteristics of Patients With Advanced Non–Small-Cell Lung Cancer Treated With PD-(L)1 Checkpoint Inhibitors
In the four data sets with stage at initial diagnosis, 69% to 100% of patients were diagnosed with stage III or IV disease. [In addition, for data set A, evidence of advanced disease, defined as either stage IIIB or IV NSCLC at initial diagnosis or early-stage (I, II, and IIIA) NSCLC with a recurrence or progression is required by the health plan for coverage of a PD-(L)1 during this study period.] Tumor histology was available in five data sets, among which 66% to 74% of patients had non–squamous-cell carcinoma and 17% to 30% had squamous-cell carcinoma. In some data sets, PD-L1 expression testing was available in a subset of patients. Where results were available from ALK or EGFR testing, few patients had ALK translocations or EGFR mutations. In the largest proportion of cases (32% to 56%), PD-(L)1 inhibitor therapy represented the second line of treatment in the advanced disease setting.
Line of therapy information was derived in five of six data sets. During the study period, most patients received a PD-(L)1 inhibitor after first-line treatment. Few patients received a second PD-(L)1 inhibitor. Overall, median follow-up time from the initiation of PD-(L)1 inhibitor therapy was 6 to 9 months, with an interquartile range of 9 to 13 months.
Patient Identification and Characteristics: What We Learned
Whereas the depth of information varied by data source, with EHR and cancer registry data providing access to richer clinical information, all data providers were able to expeditiously identify a cohort of patients with aNSCLC who received PD-(L)1 and observe them for at least 6 months. In addition, the option of identifying a patient’s diagnosis date or simply identifying patients at the time of first PD-(L)1 inhibitor treatment provides the flexibility to study all treatment regimens or only immunotherapy.
Real-World End Points
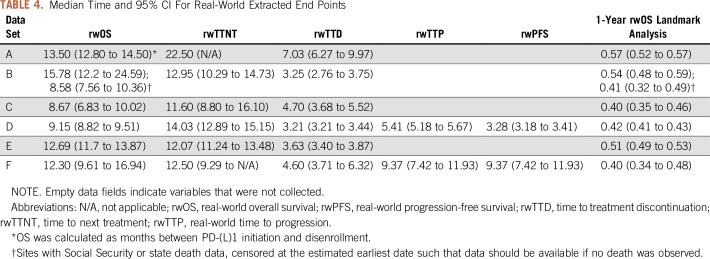
Table 4 lists median times for real-world end points in each data set. The range of median rwOS times was 8.58 months to 13.50 months, presumably driven in large part by the sources of death information, which varied from the confirmation of death being reported in the EHR to linkage with the Social Security Administration (SSA) Death Master File. Data set B demonstrates the variability that can exist in determining death and the potential effect on survival end points by calculating rwOS in all sites and when only including sites with SSA or state death data available. rwTTD was the most consistent end point as treatment detail was available in all data sets. Excluding data set A, which seems to be an outlier, median rwTTD for the remaining data sets ranged between 3.2 months and 4.7 months. Similarly, rwTTNT was consistent, ranging from 11.6 months to 14.0 months. rwTTP and rwPFS were calculated with data sets D and F in which information was extracted from the text or other unstructured fields in the EHR. Other data providers used primarily structured data from claims or EHRs for this analysis, which precluded capture of these end points.
TABLE 4.
Median Time and 95% CI For Real-World Extracted End Points
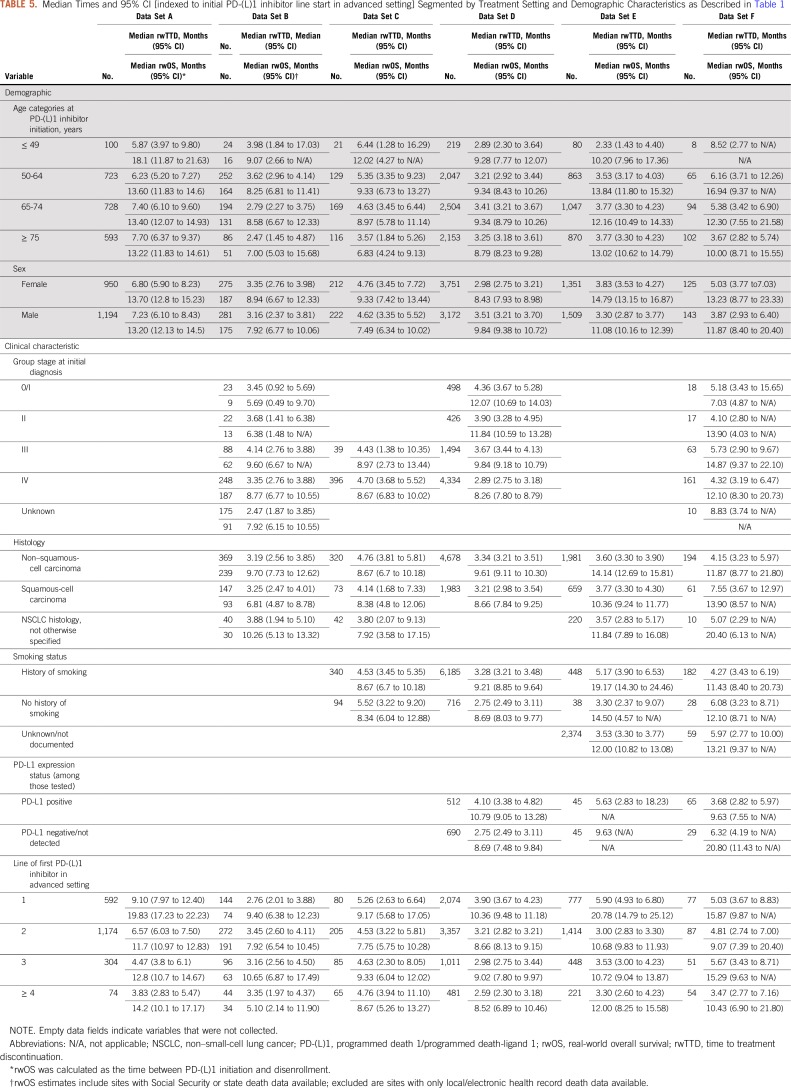
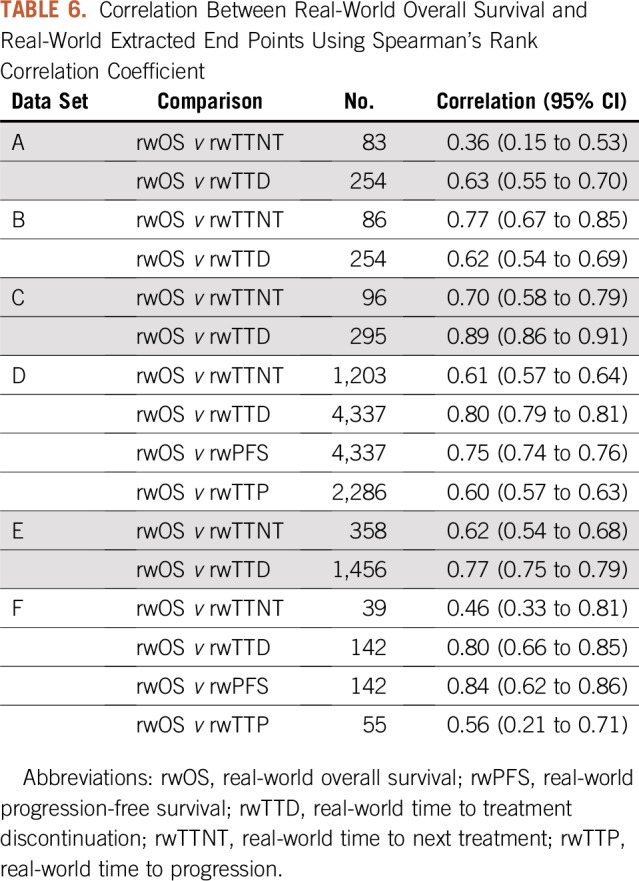
rwOS proportions were calculated for each data set at 12 months (Table 4). The proportion of patients who were alive at 12 months after initiation of PD-(L)1 therapy ranged from 40% to 57%. rwTTD and rwOS median times and 95% CIs segmented by treatment setting and demographic characteristics were also calculated (Table 5). This further illustrates the ability of RWD to assess treatment effectiveness in patient populations that may not be routinely represented in clinical trials. For each of the available real-world end points, correlation with rwOS was assessed (Table 6). With few exceptions, correlation was in the range of 0.60 to 0.89.
TABLE 5.
Median Times and 95% CI [indexed to initial PD-(L)1 inhibitor line start in advanced setting] Segmented by Treatment Setting and Demographic Characteristics as Described in Table 1
TABLE 6.
Correlation Between Real-World Overall Survival and Real-World Extracted End Points Using Spearman’s Rank Correlation Coefficient
Real-World End Points: What We Learned
All data partners were able to collect information on treatment and mortality data and rapidly assemble this information to quantify real-world treatment duration and rwOS; however, information that confirmed death, including date and cause of death, varied by data source and proved to be challenging. Assessing rwTTP and rwPFS requires extracting information from text and other unstructured fields within EHRs as a result of the specific information needed. Whereas health plans that implement prior authorization systems may collect and retain progression information, it will be limited to those seeking a next line of treatment. Therefore, we believe EHRs will be a key data source for evaluating the impact of treatment on rwTTP and rwPFS compared with claims data.
Although clinical trials often have rigid inclusion and exclusion criteria to assess the safety and efficacy of a therapy, this study assessed real-world end points in a much broader patient population. Overall survival in five RCTs that assessed PD-(L)1 therapies in patients with aNSCLC had a median OS of 12.6 months (POPLAR clinical trial), 13.8 months (OAK clinical trial), 12.2 months (CheckMate 057), 9.2 months (CheckMate 017), and 10.4 months or 12.7 months, depending on dosage (KEYNOTE-010).15 Of interest, rwOS from this study falls within the range observed in these clinical trials. Additional work to understand how real-world end points relate to more traditional measures of clinical benefit used in clinical trials is needed.
Agreement on and monitoring of statistical analyses through a research project plan to assure similarity in execution is fundamental because of the important differences between data sources. Given the timeliness and real-world nature of the data, methods to assess the impact of and account for censoring are important. Some patients continue to receive PD-(L)1 inhibitor treatment for many months and others may be lost to follow-up or unenroll from the health plan. These facts must be considered when estimating real-world end points.
DISCUSSION
This pilot project represents an effort to bring together diverse providers of established RWD drawn from EHRs, cancer registries, and administrative claims sources to assess the feasibility of using RWD to address questions that are relevant to clinical development (eg, identification of unmet needs and contextualization of clinical trial results for new therapies, or expanded indication for existing therapies) and use (eg, adverse event and dosing considerations). This pilot project successfully brought together experienced data providers who created a common framework to address a singular question to assess whether real-world end points could be extracted from RWD of patients with aNSCLC who were treated with a PD-(L)1. Recognizing that these data partners were selected because of their research-ready data, the data protocol was executed by each group within approximately 3 months, using staff members who were already experienced in the databases, data management, and data curation practices.
Key findings of this preliminary validation exercise demonstrate that clinical questions can be addressed in a relatively short timeframe as a result of the ability to access contemporaneous cohorts, and RWD can produce findings that are directionally similar to those from RCTs, particularly with regard to OS. In fact, some data sets had outcome data as recent as 3 months before the analysis readout. rwOS as assessed through EHRs and claims data fell within the median OS values observed in several PD-(L)1 clinical trials.15 Variations in the rwOS signal are likely a result of challenges with accessing mortality data, as death would not by itself trigger an entry in most EHRs. Clinical workflows and their documentation in EHRs and claims data are not designed to routinely capture information about death, including the date or cause of death. In a recent EHR-based study using a single EHR, sensitivity of the structured mortality variable was only 66% and the publicly available SSA Death Master File was even lower at 35%.16 To address known gaps in death data, some of the participating data providers rely on proprietary data sources that harvest published obituary data.17 Such data linkages, which leverage the scale and breadth of multiple data types and sources, were highlighted as a critical mechanism to address missing data and create more robust data sources. In addition, a recent study helped to elucidate at what threshold does incompleteness begin to affect findings. It has been observed that the impact of missing death data on survival analyses and estimates of OS is small when mortality capture sensitivity is high (eg, approximately 90% or more)18; however, this was not analyzed in this study.
Directional patterns observed in the project data provide useful information about the utility of real-world end points and important information on patient populations that are often excluded from clinical trials. Moreover, recognizing that these data reflect contemporary treatment of cancer, the data offer important signals about how treatments are administered and how patients’ disease responds outside of rigidly controlled clinical trials. In addition, levels of correlation to rwOS between several of the other real-world intermediate end points that were assessed ranged from 0.6 to 0.9, which indicates that real-world end points could have utility in supporting regulatory and payer decision making. Moreover, several characteristics are shared among the analyzed cohorts, despite varying sample sizes, data capture/curation processes, case identification, and data sources.
The implication of these findings is that RWD can provide useful and timely evidence to quantify the benefits and risks of new cancer treatments used in real-world settings. These results further demonstrate the utility of RWE and the need for additional investigations to assess readily extractable end points from RWD sources. Although there is a great deal of discussion about what constitutes regulatory-grade RWD, concordance between RWD and RCT data shown here demonstrates the basic principles needed to support RWD, namely that enough patients who meet the criteria of interest can be aggregated and selected without bias, and consistent follow-up data and validated end points are available for the same population. Once those criteria have been satisfied, the next level of examination is to determine whether the must-have data for a given study are available and are of sufficient quality and completeness,5 and FDA guidance on end points is available to support oncology drug approvals.19 Ongoing data curation processes used by these data sources allow for quick utilization of these data as many data partners assess the quality and completeness of data through ongoing quality assurance activities. Whereas this exercise demonstrated that not all data sources readily contain the same information, nor the same depth of clinical data of interest, they all contributed value toward estimating real-world treatment benefits and risks. That said, the completeness and accuracy of mortality information have not yet been assessed in results presented here. It would be helpful to establish best practices for managing missing data as well as curation efforts used to link and combine data sets, ensuring analytical consistency and establishing optimal effectiveness and other end points in a fashion similar to the clinical trials community.
RWD may differ from protocol-driven data collected through RCTs for various reasons. For example, RCTs have specified timing and frequency of follow-up assessment, per study protocol, and non–standard of care molecular or biomarker testing for inclusion eligibility and/or follow-up. Thus, generalizability can be enhanced using RWE as a supplement to RCTs or as external comparators.20 A related challenge involves the lack of standardized biomarker assays in the real world, which may affect comparisons among results of studies conducted in different settings. Moreover, some variables of interest, such as the date of progression, are not typically available in structured EHRs, unavailable in claims data, and are not captured in tumor registries21; however, proxy measures, such as time to change in treatment, are often useful and have been used with both EHR and claims data. When available, the date of progression is generally found only in EHR text or other unstructured fields—for example, clinician notes, radiology and pathology reports, and documents from outside the institute scanned into the EHR. Even then, comparability of rwPFS with PFS is uncertain with less systematic follow-up for progression and requires additional research. Other important elements, such as the date of diagnosis, stage of disease, intended and received chemotherapy treatments, and various clinical and socioeconomic factors, may be missing for some patients, and the magnitude of missing data may vary across data sources.
In the case of claims-based data, some or all of the care that patients receive in a clinical trial setting may not generate insurance claims as the costs of these tests are borne by the trial sponsor and not the health care insurer, thus creating a systematic data gap. Because patients with advanced cancer are more likely to participate in clinical trials, this may be a meaningful issue in the current set of analyses. Similarly, in the case of EHR-based data, coverage may be limited when patients receive their care from multiple providers across different settings—for example, patients who receive portions of their care at an academic medical center and portions in the community practice setting. If a data provider sources information exclusively from the academic center or community practice, important clinical data gaps may exist. Furthermore, it is challenging to assemble and contrast the experience of patients who are treated at the same point in the course of their disease, as patients do not always present for care at prescribed intervals as they would in an RCT.
RWD may have some missing common data elements of interest, will almost always have nonstandard timepoints at which data from clinical encounters are documented, and reflect variability in types of diagnostic tests and data quality. Nonetheless, RWE is not posed here as a solution to every problem, but rather as a cost-effective and relatively reliable tool for understanding cancer treatment heterogeneity and effectiveness. RWD provides an opportunity to rapidly address clinically relevant questions. RWE also provides an opportunity to investigate the effectiveness of therapies in patient populations and in combinations and treatment sequences that have not been studied in a clinical trial and can supplement drug development programs in meaningful ways. For example, effectiveness of therapies and long-term surveillance after initial FDA approval of medications is an area in which RWD can provide important insights. In addition, the scarcity of patients or loss of clinical equipoise may make random assignment difficult or impossible. By creating a well-reasoned approach for assessing the quality of RWD and how to apply these data to the development of RWE, we can ensure that the massive amounts of data that are generated in the course of routine health care provision and transactions can be useful for advancing drug development and efforts at generating knowledge.
This project demonstrates that acceptable data can be aggregated from research-ready RWD with short lag time and that outcomes can be measured from these data sources. Additional studies are needed to further support the use of RWE and inform the development of regulatory guidance. Standardizing definitions for real-world end points and determining appropriate analytic methodologies for RWD will be critical for broader adoption of real-world studies and will provide greater confidence in associated findings. As more refined and standardized approaches are developed that incorporate deep clinical and bioinformatics expertise, the greater the utility of RWD will be for detecting even small, but important, differences in treatment effects.
ACKNOWLEDGMENT
The authors thank the participants of the public meetings and the panelists who facilitated the discussions and contributed to the information provided in this article. The data analyses in this article were developed as part of a consortium by the six participating real-world data partners, and the authors thank the many people involved in those analyses.
Footnotes
Presented at the Friends of Cancer Research public meeting, The Future Use of Real-World Evidence, Washington, DC, July 10, 2018.
Cancer Research Network analyses supported in part by National Cancer Institute Grants No. U24-CA171524 and K07-CA188142; Mayo Clinic analyses supported in part by National Cancer Institute Grants No. P30-CA015083-44S1 and K12-CA090628; and by Patient Centered Outcomes Research Institute Contract CDRN-1306-04631.
A.P.A. participated in this work before joining the US Food and Drug Administration (FDA). This work and its related conclusions reflect the independent work of study authors and do not necessarily represent the views of the FDA or United States.
AUTHOR CONTRIBUTIONS
Conception and design: Mark Stewart, Henry Joe Henk, Amy P. Abernethy, Elizabeth Chrischilles, Lawrence Kushi, Aaron S. Mansfield, Sean Khozin, Elad Sharon, Jennifer B. Christian, Rebecca A. Miksad, Aracelis Z. Torres, Jeff Allen
Provision of study materials or patients: Andrew D. Norden, Nancy Dreyer, Henry Joe Henk, Elizabeth Chrischilles, Lawrence Kushi, Rebecca A. Miksad
Collection and assembly of data: Mark Stewart, Andrew D. Norden, Nancy Dreyer, Henry Joe Henk, Elizabeth Chrischilles, Lawrence Kushi, Aaron S. Mansfield, Elad Sharon, Ryan Carnahan, Jennifer B. Christian, Rebecca A. Miksad, Lori C. Sakoda, Aracelis Z. Torres, Emily Valice
Data analysis and interpretation: All authors
Manuscript writing: All authors
Final approval of manuscript: All authors
Accountable for all aspects of the work: All authors
AUTHORS' DISCLOSURES OF POTENTIAL CONFLICTS OF INTEREST
The following represents disclosure information provided by authors of this manuscript. All relationships are considered compensated. Relationships are self-held unless noted. I = Immediate Family Member, Inst = My Institution. Relationships may not relate to the subject matter of this manuscript. For more information about ASCO's conflict of interest policy, please refer to www.asco.org/rwc or ascopubs.org/jco/site/ifc.
Andrew D. Norden
Employment: Cota Healthcare, IBM
Leadership: Cota Healthcare
Henry Joe Henk
Employment: Optum
Stock and Other Ownership Interests: United Health Group
Amy P. Abernethy
Employment: Flatiron Health
Leadership: AthenaHealth, Highlander Partners, SignalPath Research, One Health Company
Stock and Other Ownership Interests: AthenaHealth, Flatiron Health, Orange Leaf Associates
Honoraria: Genentech
Patents, Royalties, Other Intellectual Property: Patent pending for a technology that facilitates the extraction of unstructured information from medical records
Other Relationship: US Food and Drug Administration
Aaron S. Mansfield
Consulting or Advisory Role: Trovagene (Inst), Genentech (Inst), Bristol-Myers Squibb (Inst), AbbVie (Inst)
Research Funding: Novartis (Inst)
Travel, Accommodations, Expenses: AbbVie, Roche
Srikesh Arunajadai
Employment: Cota Healthcare, Kantar Health
Jennifer B. Christian
Employment: IQVIA
Stock and Other Ownership Interests: GlaxoSmithKline, IQVIA
Rebecca A. Miksad
Employment: Flatiron Health
Stock and Other Ownership Interests: Flatiron Health, Roche
Consulting or Advisory Role: Advanced Medical, Grand Rounds (I), InfiniteMD
Research Funding: Bayer (Inst), Exelixis (Inst)
Other Relationship: De Luca Foundation
Lori C. Sakoda
Stock and Other Ownership Interests: Johnson & Johnson
Aracelis Z. Torres
Employment: Flatiron Health
Stock and Other Ownership Interests: Flatiron Health
No other potential conflicts of interest were reported.
REFERENCES
- 1.Martin L, Hutchens M, Hawkins C, et al. How much do clinical trials cost? Nat Rev Drug Discov. 2017;16:381–382. doi: 10.1038/nrd.2017.70. [DOI] [PubMed] [Google Scholar]
- 2.Frieden TR. Evidence for health decision making: Beyond randomized, controlled trials. N Engl J Med. 2017;377:465–475. doi: 10.1056/NEJMra1614394. [DOI] [PubMed] [Google Scholar]
- 3.Franklin JM, Schneeweiss S. When and how can real world data analyses substitute for randomized controlled trials? Clin Pharmacol Ther. 2017;102:924–933. doi: 10.1002/cpt.857. [DOI] [PubMed] [Google Scholar]
- 4.Khosla S, White R, Medina J, et al. Real world evidence (RWE): A disruptive innovation or the quiet evolution of medical evidence generation? F1000 Res. 2018;7:111. doi: 10.12688/f1000research.13585.1. [DOI] [PMC free article] [PubMed] [Google Scholar]
- 5.Ali AK, Hartzema AG.(eds)Enriched Studies inPost-Authorization Safety Studies of Medicinal Products: The PASS Book ed 1London, United Kingdom: Elsevier; 2018. pp150–158. [Google Scholar]
- 6.Corrigan-Curay J, Sacks L, Woodcock J. Real-world evidence and real-world data for evaluating drug safety and effectiveness. JAMA. 2018;320:867–868. doi: 10.1001/jama.2018.10136. [DOI] [PubMed] [Google Scholar]
- 7.US Food and Drug Administration PDUFA reauthorization performance goals and procedures fiscal years 2018 through 2022. https://www.fda.gov/media/99140/download
- 8.US Food and Drug Administration Use of Electronic Health Record Data in Clinical Investigations: Guidance for Industry. https://www.fda.gov/regulatory-information/search-fda-guidance-documents/use-electronic-health-record-data-clinical-investigations-guidance-industry
- 9. US Congress: 21st Century Cures Act. P.L. 114-255, 2016.
- 10. US Congress: Prescription Drug User Fee Act. P.L. 102-571, 1992.
- 11.US Food and Drug Administration BLA multidisciplinary review and evaluation: BLA 761049. Bavencio (Avelumab) https://www.accessdata.fda.gov/drugsatfda_docs/nda/2017/761049Orig1s000MultidisciplineR.pdf
- 12.US Food and Drug Administration Summary Review for Regulatory Action: Blincyto (Blinatumomab) https://www.accessdata.fda.gov/drugsatfda_docs/nda/2014/125557Orig1s000MedR.pdf
- 13.Berger M, Daniel G, Frank K, et al. A Framework For Regulatory Use of Real-World Evidence. Durham, NC: Duke-Margolis Center for Health Policy; 2017. https://healthpolicy.duke.edu/sites/default/files/atoms/files/rwe_white_paper_2017.09.06.pdf [Google Scholar]
- 14.Ross TR, Ng D, Brown JS, et al. The HMO Research Network virtual data warehouse: A public data model to support collaboration. EGEMS (Wash DC) 2014;2:1049. doi: 10.13063/2327-9214.1049. [DOI] [PMC free article] [PubMed] [Google Scholar]
- 15.Huang G, Sun X, Liu D, et al. The efficacy and safety of anti-PD-1/PD-L1 antibody therapy versus docetaxel for pretreated advanced NSCLC: A meta-analysis. Oncotarget. 2017;9:4239–4248. doi: 10.18632/oncotarget.23279. [DOI] [PMC free article] [PubMed] [Google Scholar]
- 16.Dreyer NA. Advancing a framework for regulatory use of real-world evidence: When real is reliable. Ther Innov Regul Sci. 2018;52:362–368. doi: 10.1177/2168479018763591. [DOI] [PMC free article] [PubMed] [Google Scholar]
- 17.Curtis MD, Griffith SD, Tucker M, et al. Development and validation of a high-quality composite real-world mortality endpoint. Health Serv Res. 2018;53:4460–4476. doi: 10.1111/1475-6773.12872. [DOI] [PMC free article] [PubMed] [Google Scholar]
- 18.Carrigan G, Whipple S, Taylor MD, et al. An evaluation of the impact of missing deaths on overall survival analyses of advanced non-small cell lung cancer patients conducted in an electronic health records database. Pharmacoepidemiol Drug Saf. 2019;28:572–581. doi: 10.1002/pds.4758. [DOI] [PMC free article] [PubMed] [Google Scholar]
- 19.Johnson JR, Williams G, Pazdur R. End points and United States Food and Drug Administration approval of oncology drugs. J Clin Oncol. 2003;21:1404–1411. doi: 10.1200/JCO.2003.08.072. [DOI] [PubMed] [Google Scholar]
- 20.Gökbuget N, Kelsh M, Chia V, et al. Blinatumomab vs historical standard therapy of adult relapsed/refractory acute lymphoblastic leukemia. Blood Cancer J. 2016;6:e473. doi: 10.1038/bcj.2016.84. [DOI] [PMC free article] [PubMed] [Google Scholar]
- 21.In H, Bilimoria KY, Stewart AK, et al. Cancer recurrence: An important but missing variable in national cancer registries. Ann Surg Oncol. 2014;21:1520–1529. doi: 10.1245/s10434-014-3516-x. [DOI] [PubMed] [Google Scholar]


