Abstract
Purpose
In an upcoming clinical trial at the Moffitt Cancer Center for women with stage 2/3 estrogen receptor–positive breast cancer, treatment with an aromatase inhibitor and a PD-L1 checkpoint inhibitor combination will be investigated to lower a preoperative endocrine prognostic index (PEPI) that correlates with relapse-free survival. PEPI is fundamentally a static index, measured at the end of neoadjuvant therapy before surgery. We have developed a mathematical model of the essential components of the PEPI score to identify successful combination therapy regimens that minimize tumor burden and metastatic potential, on the basis of time-dependent trade-offs in the system.
Methods
We considered two molecular traits, CCR7 and PD-L1, which correlate with treatment response and increased metastatic risk. We used a matrix game model with the four phenotypic strategies to examine the frequency-dependent interactions of cancer cells. This game was embedded in an ecological model of tumor population-growth dynamics. The resulting model predicts evolutionary and ecological dynamics that track with changes in the PEPI score.
Results
We considered various treatment regimens on the basis of combinations of the two therapies with drug holidays. By considering the trade off between tumor burden and metastatic potential, the optimal therapy plan was a 1-month kick start of the immune checkpoint inhibitor followed by 5 months of continuous combination therapy. Relative to a protocol giving both therapeutics together from the start, this delayed regimen resulted in transient suboptimal tumor regression while maintaining a phenotypic constitution that is more amenable to fast tumor regression for the final 5 months of therapy.
Conclusion
The mathematical model provides a useful abstraction of clinical intuition, enabling hypothesis generation and testing of clinical assumptions.
INTRODUCTION
Evolving alongside vacillating populations of pathogens, the components of the human immune system mirror the changing and hostile environments of our past. Although they are capable of defending against pathogens and dysfunctional cells, selection events result in trade-offs among protective responses, autoimmunity, and host fecundity, shaping the diverse cellular and molecular composition of the immune system. Immune regulation protects healthy tissue during a powerful immune response.
In tumors, cancer cells often evolve strategies to dysregulate, co-opt, or suppress the immune system. Therapies that block such immune evasion mechanisms, using antibodies that target immune checkpoints (eg, cytotoxic T lymphocyte antigen-4 [CTLA-4] and programmed death-1 [PD-1]) have been introduced to enhance antitumor cytotoxic T-cell responses by inhibiting immune regulatory functions.1 The efficacy of immune checkpoint blockade (ICB) therapy was first confirmed in overall survival of patients with advanced melanoma treated with the anti–CTLA-4 monoclonal antibody ipilimumab.2,3 Subsequently anti–PD-L1 therapy was included as a broadly applicable tool for the treatment of cancer.4-6 PD-1 is a checkpoint protein expressed by cytotoxic immune cells (ie, T cells and natural killer cells) and its ligand PD-L1 is often expressed on cancer cells, leading to immune evasion. Using ICB to block either CTLA-4 or PD-L1 has led to durable responses in some patients, albeit with only a fraction of patients responding, possibly due to other immune-evasion mechanisms.6,7 Therefore, therapeutic approaches using combinations of ICB and targeted therapies or radiotherapies that stimulate various steps of the cancer-immunity cycle need to be explored.
Combination Therapy With Immune Checkpoint Inhibitors
Chemotherapy and radiation are widely used and readily combined with ICB therapies.7 Radiation improves responses to ICB in mice given anti–CTLA-4.8,9 There also seems to be an additional abscopal effect (ie, tumor shrinkage in unirradiated areas).10 Mathematical models illustrate the potential synergies with immune checkpoint inhibitors.11,12 Similarly, genotoxic chemotherapies combine favorably with ICB therapies by improving the discriminatory function of the immune system to evoke immunogenic pattern recognition receptor signaling.13,14 Radfar et al15 conducted a study of an approach termed “chemocentric chemoimmunotherapy” with potential application in the treatment of all cancer types. The technique uses activated CD4+ T cells to chemosensitize the tumor before chemotherapy administration. Their results support those of other recent studies reporting improved response rates and survival with salvage chemotherapy in patients who previously received cancer vaccination aimed at developing an immune response.16-20
Furthermore, multiple classes of targeted therapies in combination with ICB show promising results (eg, CDK4/6 inhibitors used in hormone receptor–positive breast cancer).21-23 Preclinical experimental data show synergism between targeted therapy with a BRAF inhibitor and anti–PD-L1 therapies that counteract subsequent immune escape via expression of PD-L1 that would typically occur in tumors of patients with metastatic melanoma.24,25
There are currently more than 400 ongoing trials of ICB in combination with other modalities. Although combination therapies have tremendous clinical potential, designing combination trials requires a deep understanding of the underlying biologic mechanisms at play in two complex and interacting systems: the tumor and the immune system. Challenges magnify when confronting the myriad possible dose levels and timing schedules. The clinical options become legion, even though they all have the same goal of eradicating the tumor while preventing the emergence of resistance. Mathematical modeling permits exploration of the many options as well as integrating knowledge and assumptions from the clinic and research bench. The goal of our modeling here is to generate testable hypotheses.26 Mathematical models have been used to study tumor-immune dynamics and system stability in a variety of cancer types.27-31
Neoadjuvant Therapy in Estrogen Receptor–Positive Breast Cancer
In a recently approved clinical trial at the Moffitt Cancer Center (Tampa, FL), women with stage 2 or 3 breast cancer with estrogen receptor–positive (ER+) tumors will receive neoadjuvant combination therapy: an aromatase inhibitor (AI; primarily anastrozole) and checkpoint inhibitor against PD-L1 (durvalumab). AIs are an orally available class of drugs used in the treatment of postmenopausal patients with ER+ breast cancer. AI therapy suppresses estrogen production by blocking the aromatase enzyme, a key step in estrogen production. ER+ breast cancer cells depend on estrogen for proliferation. By reducing the amount of hormone available to tumor cells, AI therapy blocks the growth of the tumor, resulting in tumor cell death. Response rates to AI therapy are relatively high (50% to 70%) in the neoadjuvant setting, but there still remains a large population of patients, especially with advanced disease, that does not respond. Alternative therapies are needed, as are biomarkers to predict response.32 The addition of checkpoint inhibitors to AI drug regimens appears promising.33-35 Therefore, a key goal of this article is to provide insights on how best to deliver this combination therapy.
Mathematical Modeling of Immune Checkpoint Inhibitors
Here, we describe a mathematical framework we developed to better understand the effect of combining AI therapy with the checkpoint inhibitor anti–PD-L1 in postmenopausal ER+ breast cancer. Specifically, we based our model on the Moffitt clinical trial, which began accruing patients in mid-2018. The trial has a short-term outcome metric: the preoperative endocrine prognostic index (PEPI) measured at the end of 6 months of neoadjuvant therapy.36 The PEPI score accounts for tumor size, presence of cancer cells in the lymph nodes, Ki-67 levels (a marker for proliferation), and hormone receptor status. The PEPI score provides a prognostic indicator for relapse-free survival and is measured at the time of surgery, after neoadjuvant therapy. The mathematical model developed here mimics two essential indicators of the PEPI score: lymphatic metastatic potential and tumor size. We used an evolutionary game theory (EGT) approach to (1) evaluate the success of diverse combination therapies of AI and checkpoint inhibitors that aim to minimize tumor burden and metastatic potential, and (2) identify the time-dependent trade-offs between tumor burden and metastatic potential within the PEPI score.
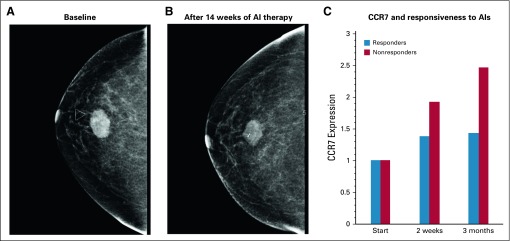
We consider CC-chemokine receptor 7 (CCR7) and PD-L1 as two relevant and measurable molecular traits of the cancer cell that play a role in therapy resistance. Furthermore, PD-L1 and CCR7 are positively correlated with metastatic risk, especially to the lymphatics.37-39 Similar to the PD-1/PD-L1 axis, CCR7 and its ligands (CCL19 and CCL21) help govern the balance between immune activation and immune regulation. Lymphocyte trafficking is a highly regulated process guided by chemokine gradients and integrins. CCR7 is a chemokine receptor traditionally expressed by immune cells and is required for leukocyte homing to lymph nodes. Along with other chemokine receptors, CCR7 expression in cancer cells is highly correlated with lymph node involvement and metastasis in breast cancer.37-39 In addition, CCR7 activation induces proliferation and inhibits apoptosis in immune cells and cancer cells.40-42 In a small study that examined gene expression in 89 patients receiving letrozole, CCR7 expression was elevated in nonresponders compared with responders. As seen in Figure 1, CCR7 expression increased in all patients (blue) and to a greater degree in nonresponders (red).32 In our model, we used CCR7 expression as a marker of metastatic potential with increased risk of lymph node invasion. Furthermore, we see positive CCR7 expression as conferring resistance to the aromatase inhibitor.
FIG 1.
Expression changes during continuous administration of aromatase inhibitor (AI) therapies. (A, B) A representative image (A) before and (B) after neoadjuvant AI therapy shows a non responder (30% to 50% of patients) to the current standard of care. (C) Expression data from biopsy specimens obtained from 89 postmenopausal women with estrogen receptor–positive breast cancer receiving neoadjuvant letrozole32 were analyzed. CCR7 was identified in a group of genes that showed the greatest expression pattern changes during treatment with AI. Gene ontology analysis via AmiGO (amigo.geneontology.org) revealed that this subset of differentially expressed genes was enriched for immune function, including CCR7 as a marker of potential metastatic escape. Relative changes of CCR7 expression increased under AI therapy in all patients, but to a greater degree for nonresponders.
Using CCR7 and PD-L1 tumor phenotypes in the mathematical model, we incorporated key elements of therapy resistance strategies influence the PEPI score (ie, tumor size and risk of lymph metastasis). The model provides the evolutionary trajectories of these cancer cell phenotypes and how they affect the total cancer cell population over time. To combine the evolutionary dynamics with the population dynamics, we embedded an EGT model of cell-type–specific interactions in a model of population dynamics. Thus, we integrated the replicator dynamics (ie, changes in strategy frequencies) with the population dynamics. The model serves as a platform to aid clinical intuition in designing combinations of hormone therapy and immunotherapy.
METHODS
EGT provides a framework for modeling frequency-dependent selection where the fitness value of a trait to an individual depends on the trait values of others. A payoff matrix defines the fitness returns to an individual (row strategy) from interacting with another individual or the population at large (column strategy).43-45 It is now well established that cancer progression is an evolutionary and ecological process46,47 in which evolutionary forces (eg, genetic drift with heritable mutations, natural selection) drive changes in the cancer cells’ heritable phenotypes along a fitness landscape.48,49 EGT has been used for modeling cancer treatment, including models of prostate cancer tumor interactions with stroma,50,51 adaptive therapy,50 metronomic chemotherapy,52 competitive release,53 and the evolutionary double bind.54
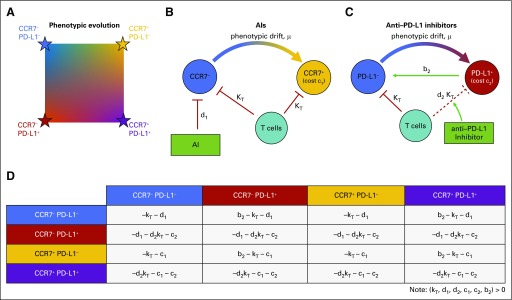
Our EGT model sees tumor cells as “players” with two independent phenotypic axes: CCR7 and PD-L1 expression. Each cell of type i (i = 1, 2, 3, 4) competes according to equation 1, where is the vector of the corresponding frequency of the four phenotypes: x1 ≡ CCR7−/PD-L1−; x2 ≡ CCR7−/PD-L1+; x3 ≡ CCR7+/PD-L1−; and x4 ≡ CCR7+/PD-L1+. The fraction of cells expressing CCR7 and PD-L1 can be found by x3 + x4 and x2 + x4, respectively. The evolution of average trait values within the tumor population can be tracked on a two-dimensional plane (Fig 2A).
FIG 2.
Schematic of the mathematical model. (A) The tumor population consists of phenotypes varying on two axes: CCR7 (increasing from left to right) and PD-L1 (increasing from top to bottom). (B) Aromatase inhibitor (AI) therapy targets CCR7− phenotypes with kill rate of d1; these may evolve CCR7 expression due to selection. T cells kill both types at rate kT. (C) Checkpoint inhibitor therapy boosts the immune response against tumor cells expressing PD-L1. In addition, PD-L1− cells benefit from being near PD-L1+ cells, known as a “cheater” population. (D) The two-dimensional phenotypic space is modeled using a four-player game with subscript 1 indicating the CCR7 axis and subscript 2 indicating the PD-L1 axis. Killing terms (see red lines in 2B and 2C) for kT, d1, and d2 are added to PD-L1−, CCR7−, and PD-L1+ rows, respectively. Cost terms (c1, c2) are added to CCR7+ and PD-L1+ rows, respectively. The cheater benefit, b2, is added to PD-L1− interactions (row) with PD-L1+ cells (column). Note that all costs (c1, c2, kT, d1, d2) and benefits (b2) in payoff matrix A are constrained to non-negative values.
The phenotypic interactions for each therapy are shown in Figure 2B and 2C. T cells kill tumor cells at rate kT, but PD-L1 expression removes this term and provides a benefit, b2, to neighboring PD-L1-negative (PD-L1−) cells. AI targets CCR7− cells (d1) and the checkpoint inhibitor promotes T-cell killing of PD-L1+ cells (d2kT).
The costs and benefits attributed to each phenotype are mathematically represented in a payoff matrix (Fig 2D). The fitness of each phenotype subpopulation is given by equation 3: a function of phenotype prevalence weighted by the payoff matrix. The subscript 1 is associated with AI therapy, subscript 2 is associated with checkpoint inhibitor therapy, and the parameters are summarized as follows:
kT: kill rate by immune cells (T cells); kT ≥ 0
d1: AI kill rate; d1 ≥ 0
d2: checkpoint inhibitor–binding blocking rate; 1 ≥ d2 ≥ 0
c1: inherent cost of developing increased CCR7 expression; c1 ≥ 0
c2: inherent cost of developing PD-L1 expression; c2 ≥ 0
b2: cheater benefit a PD-L1− cell gains by being near a PD-L1+ cell; b2 ≥ 0
The total volume, vi(t), for each ith phenotype increases by growth rate, λ, offset by the various costs and benefits in the fitness function. In this way, the population dynamics [vi(t)] are dependent on absolute fitness, whereas the evolutionary dynamics [xi(t)] depend on relative fitness. The total change in volume of the tumor is given by the sum of phenotype volume changes: .
RESULTS
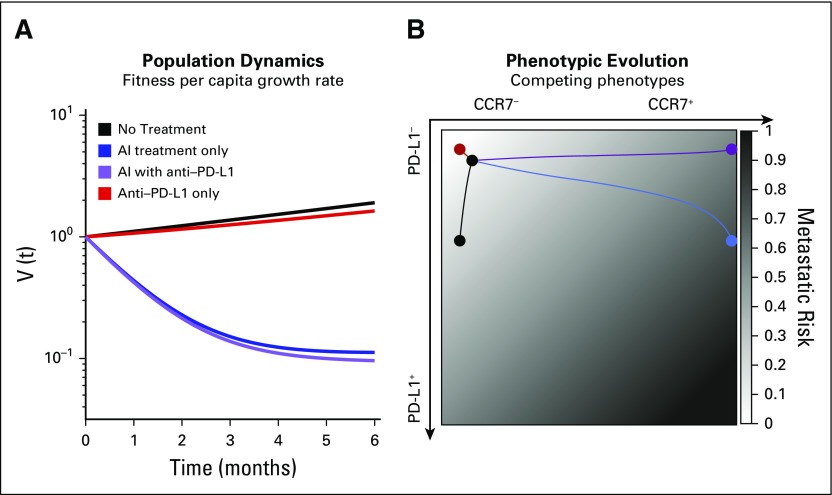
Figure 3 shows the model predicted treatment responses to (1) no treatment (black, exponential growth); (2) AI continuous treatment only (blue); (3) checkpoint inhibitor continuous treatment only (red); and (4) both AI and checkpoint inhibitor continuous treatment (purple). Selection pressure by immune cells is always present (kT = 0.4) but is not sufficient to cause tumor regression by itself. The costs to develop resistance are small (c1 = c2 = 0.1), as is the cheater benefit that a PD-L1− cell derives from being near a PD-L1+ cell, chosen as b2 = 0.1. The costs to both CCR7 and PD-L1 expression outweigh the cheating benefit of residing near a PD-L1+ cell in the presence of the AI drug: [−(c1 + c2) > b2 -kT (1− d2) − d1]. We assume low CCR7 expression (x3 + x4) and PD-L1 expression (x2 + x4) at the start of treatment. We use the simplifying assumption that = [(1−f1)(1−f2), f1(1−f2), f2(1−f1), f1f2] where f1 the initial fraction of CCR7 expression (x3 + x4) and f2 is initial fraction of PD-L1 expression (x2 + x4).
FIG 3.
Trade-off between metastatic risk and tumor regression. (A) Tumor regression is shown for no treatment (black), continuous aromatase inhibitor (AI; blue), continuous checkpoint inhibitor (red), and combined therapy (purple). (B) Trajectories on the metastatic risk simplex (white to black for increased risk) are also shown for the four scenarios. Treatments may be associated with optimal metastatic risk and worse regression (checkpoint inhibitor) or with optimal regression but worse metastatic risk (AI with checkpoint inhibitor). Baseline parameter values are as follow: c1 = c2 = b2 = f2 = 0.1; λ = 0.5; k = 0.4; d1 = 1.1; d2 = 0.95.
As seen in Figure 3A, administering standard-of-care neoadjuvant AI treatment continuously for 6 months results in significant tumor regression (blue), which is improved by the addition of continuous administration of checkpoint inhibitor therapy (purple). However, the underlying phenotypic dynamics often represent very different outcomes even when tumor regression is similar. This is shown in Figure 3B, plotting the outcomes of phenotypic evolution on the CCR7–PD-L1 plane. The background is color coded according to metastatic risk of each point in phenotype space (eq 5). The risk function is chosen such that p1 + p2 = 1 (here, p1 = p2 = 0.5), which has the convenient property that m ∈ [0, 1] for every point in the simplex.
Importantly, this function increases with CCR7 expression and with PD-L1 expression. Although the exact functional relationship between metastatic risk and expression of these markers is unknown, an increasing linear function is used as a first approximation, consistent with previous findings linking each expression axis to metastasis.37-39 Therefore, an ideal therapy would keep the CCR7 and PD-L1 expression low, residing in the top left corner of the graph in Figure 3B for all of simulation time (x1 = 1) and giving a score of m = 0.
From these results, it is apparent there is a trade-off between tumor regression (Fig 3A) and metastatic risk (Fig 3B). Any therapy that results in both low CCR7 and PD-L1 expression will be associated with the lowest likelihood of developing metastatic disease. In Figure 3B, the checkpoint inhibitor treatment shows the best (lowest) metastatic potential score. This optimal solution comes with an important caveat: It is also associated with the worst tumor regression, second only to untreated growth (Fig 3A). The highest tumor regression is associated with the continuous combination treatment (purple), which results in a relatively high metastatic risk in the top right corner of Figure 3B.
Phenotypic Evolution Under Mono- and Combination Therapy
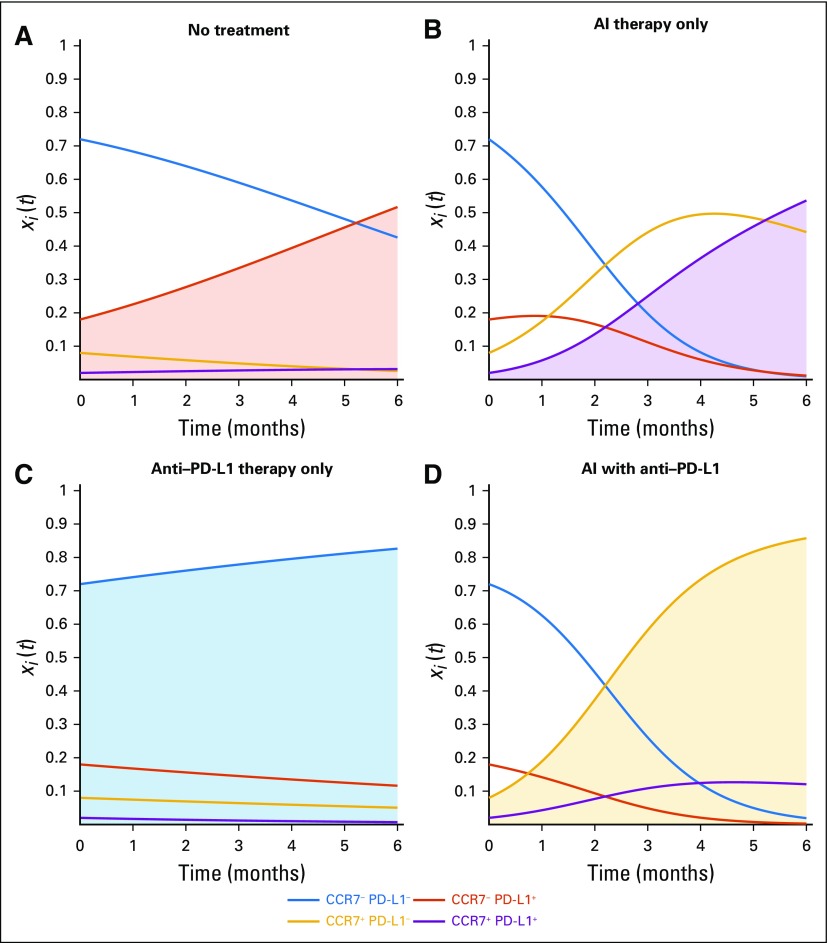
To assess long-term outcomes, an evolutionarily stable strategy can be directly calculated from the payoff table (Fig 2D), which indicates which phenotype will eventually dominant the tumor population. Each evolutionarily stable strategy shown shaded in Figure 4 holds for specific conditions (ie, inequalities).55 Without treatment, the CCR7−/PD-L1+ (Fig 4A, red) dominates if the cost of developing the PD-L1 strategy is less than immune-cell kill rate in the absence of the immune escape mechanism (c2 < kT), otherwise the negative-negative phenotype wins. Under continuous AI treatment, the CCR7+/PD-L1+ phenotype wins (Fig 4B, purple) if the cost of developing CCR7 expression is less than the kill rate due to AI drug therapy (c1 < d1) and the costs to CCR7/PD-L1 expression outweigh the cheating benefit of residing near a PD-L1+ cell in the presence of the AI drug [−(c1 +c2) > b2 -kT (1−d2)−d1]. Under continuous checkpoint inhibitor treatment, the CCR7−/PD-L1− phenotype wins (Fig 4C, blue) if the costs to CCR7/PD-L1 expression are positive (c1 > 0; c2 > 0), otherwise neutral dynamics play out. Under continuous combination treatment, the CCR7+/PD-L1− phenotype wins (Fig 4D, gold) if the cost to PD-L1 outweighs the difference between PD-L1 expressing and non-expressing cells during checkpoint inhibitor treatment [c2 > kT(1-d2)]. Interestingly, each of the four treatment scenarios results in a different dominant phenotype. This implies that the underlying phenotypic evolution may be controllable to any desired CCR7/PD-L1 expression by choosing which treatments to apply in sequence.
FIG 4.
Evolutionary dynamics under continuous treatment. Underlying phenotypic dynamics (xi[t], bottom; eq 1) are shown under (A) no treatment, (B) aromatase inhibitor (AI) treatment, (C) checkpoint inhibitor treatment, and (D) both therapies. Interestingly, the emerging dominant phenotype for each treatment is different. (c1 = c2 = b2 = f1 = 0.1; f2 = 0.2; λ = 0.5; kT = 0.4; d1 = 1.1; d2 = 0.95).
Transient Dynamics: A Virtual PEPI Score
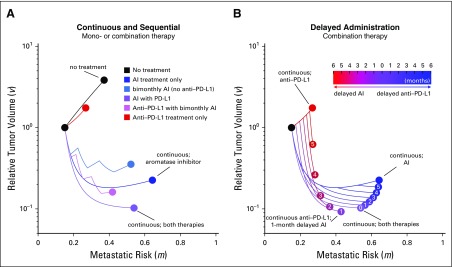
To fully explore the trade-off between tumor regression and metastatic risk, it is useful to visualize these dueling axes of the trade-off between metastatic risk and tumor regression, as shown in Figure 5. All therapies begin with an identical initial condition (black dot) and track tumor volume (vertical axis) and time-weighted average metastatic risk (horizontal axis) for 6 months of neoadjuvant therapy. Here, the optimal therapy would direct the curve toward the origin.
FIG 5.
Mono- and combination therapies. Dynamics for two essential components of the PEPI score (metastatic risk and tumor volume) are shown for (A) continuous or sequential administration and (B) delayed administration treatment schedules. Parameter values are as follows: c1 = c2 = b2 = f2 = 0.1; λ = 0.5; kT = 0.4; d1 = 1.1; d2 = 0.95. AI, aromatase inhibitor.
The model’s true utility comes when describing the transient dynamics of the underlying PEPI indicators. In Figure 5A, the trajectory of monotherapies and combination therapies is shown for no treatment (black) and five different treatment regimens. Intermittent checkpoint inhibitor schedules were not analyzed owing to anti–PD-L1 having a long effective half-life in patients. The optimal metastatic risk score (horizontal axis) is associated with checkpoint inhibitor monotherapy (red dot), but this is the second worst tumor regression (vertical axis). The current standard of care (ie, AI; blue dot) decreases tumor volume compared with no treatment (black dot) but is the worst outcome for metastatic risk. Continuous AI and checkpoint inhibitor therapy results in a better overall outcome than the standard of care by lowering both tumor regression and metastatic risk.
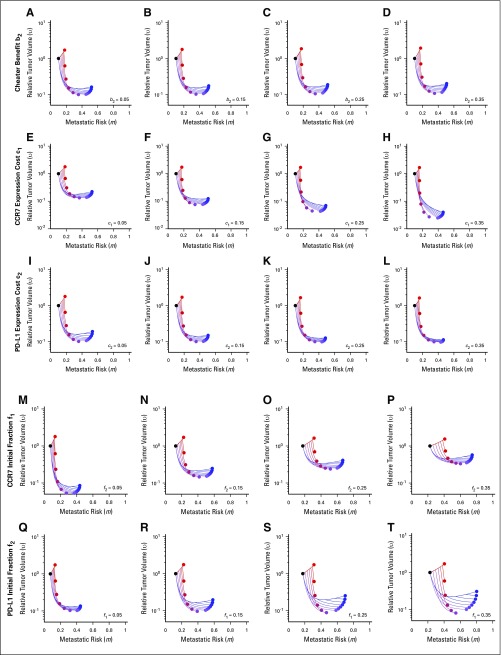
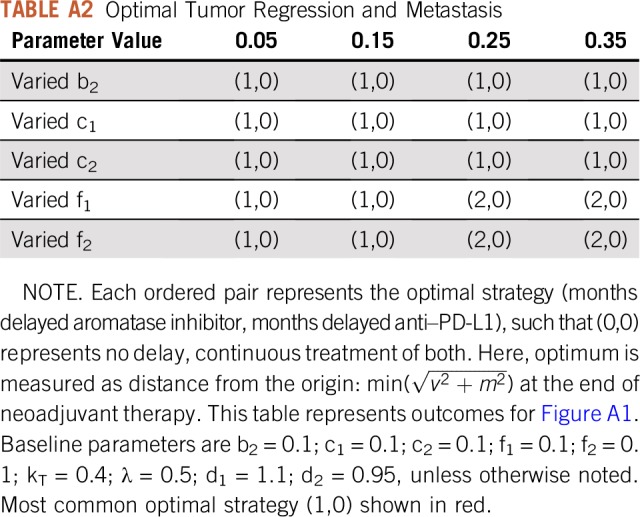
Delayed treatment strategies are tested in Figure 5B. The legend shows the delay time (months) of one drug with respect to continuous (6-month) administration of the other; the zero entry indicates continuous treatment of both. The model predicts that the global optimum tumor regression is achieved through continuous checkpoint inhibitor therapy coupled with 1-month delayed AI. This results in a temporary increase in tumor volume for the first month. However, fast regression for the final 5 months of neoadjuvant therapy leads to the smallest tumor burden at time of surgery. These results are relatively robust to changes in parameters, provided the inequalities described in the section headed “Phenotypic Evolution Under Mono- and Combination Therapy” remain true. These inequalities determine the long-term dominant phenotypes, and variations in parameters show that continuous checkpoint inhibitor and 1-month delayed AI remains optimal in most circumstances (Appendix Fig A1; Appendix Tables A1 and A2), except for the cases of large costs or low initial expression of CCR7 or PD-L1.
DISCUSSION
The PEPI score is used to predict prognosis after neoadjuvant therapy, and combines tumor size, Ki-67 proliferation index, hormone status, and lymph node involvement. The PEPI score aims to optimize all four, yet gives no information about transient scores or which of the four factors to prioritize. The purpose of this study was to highlight the inherent trade-off between two of these indicators: metastatic risk and tumor regression. Our results suggest that 1 month of delayed AI therapy combined with continuous checkpoint inhibitors leads to optimal tumor regression. However, we can imagine scenarios where other factors might be prioritized. A patient with a large, aggressive, invasive tumor may opt to receive a stronger dose of combination therapy, lowering the tumor volume (Fig 5, vertical axis) at the expense of increased metastatic risk (Fig 5, lateral axis). On the other hand, because neoadjuvant therapy is followed by surgery at the end of the 6-month therapy, in some instances, it is wise to optimize lowering a patient’s metastatic risk rather than decreasing tumor burden. In other scenarios, surgery may not be plausible. The two axes need to be considered concurrently as they are coupled; a higher metastatic score with a small tumor is likely less dangerous than the same with a large tumor at the end of neoadjuvant therapy. Interestingly, using a simple minimization of distance to the origin (Fig 5) resulted in the same optimal treatment of 1-month delayed AI under a variety of parameters tested (Table 1).
We are often inclined to define the success of a therapy as the eradication of the tumor. Neoadjuvant therapies are followed by surgical removal of the primary tumor, altering the desired treatment outcome. Clinicians are tasked with creating or maintaining an operable tumor volume with the primary goal of delaying or even preventing postsurgical recurrence. This setting allows for more nuanced approaches. We no longer have to maximize tumor-cell killing at the risk of driving drug resistance or increasing metastatic potential. We can begin to optimize metrics such as long-lasting systemic immune memory and selection for less aggressive phenotypes if recurrence does arise. As treatment options become more diverse and more sophisticated, so too will our applications of such treatments and, therefore, the need for applying more integrated approaches like the one we developed here.
Optimizing multiple output variables (eg, regression and metastasis) is not a straightforward task, but mathematical models are a powerful abstraction of clinical intuition, enabling hypothesis generation and testing of clinical assumptions. Especially when developed in collaboration with clinicians, such models provide clarity and power despite their simplicity and built-in assumptions, emphasizing their ability to define novel therapeutic regimens. Here, we have found that combination therapy is likely to be better than either monotherapy for reducing both tumor burden and metastatic risk. Furthermore, introducing a 1-month delay for AI can strengthen the outcome.
ACKNOWLEDGMENT
We gratefully acknowledge the 7th Annual Moffitt IMO workshop on Evolutionary Therapy, where this project was conceived.
Appendix
FIG A1.
Parameter sensitivity analysis. Baseline parameters are b2 = 0.1; c1 = 0.1; c2 = 0.1; f1 = 0.1; f1 = 0.1; kT = 0.4; λ = 0.5; d1 = 1.1; d2 = 0.95, unless otherwise noted.
TABLE A1.
Optimal Tumor Regression
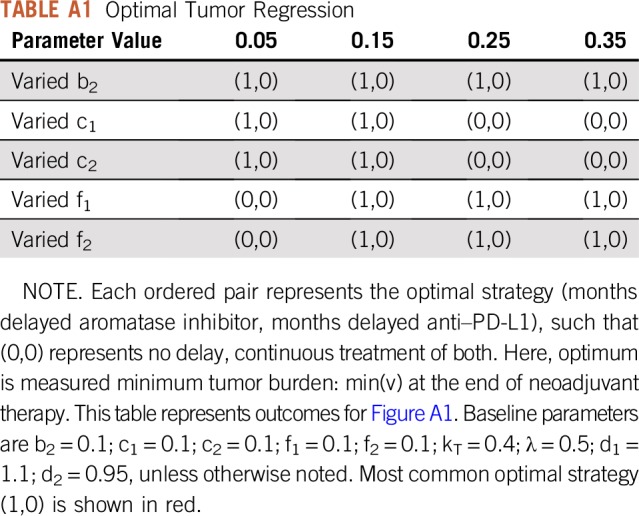
TABLE A2.
Optimal Tumor Regression and Metastasis
Footnotes
Supported by the Physical Sciences Oncology Network at the National Cancer Institute Grant No. U54CA193489 (J.W., M.R.-T., J.B., A.R.A.A.).
AUTHOR CONTRIBUTIONS
Conception and design: Jeffrey West, Mark Robertson-Tessi, Kimberly Luddy, Derek S. Park, Cathal Harmon, Hung T. Khong, Joel Brown, Alexander R.A. Anderson
Collection and assembly of data: Derek S. Park
Data analysis and interpretation: Jeffrey West, Mark Robertson-Tessi, Kimberly Luddy, Derek S. Park, Drew F.K. Williamson, Cathal Harmon, Joel Brown, Alexander R.A. Anderson
Manuscript writing: All authors
Final approval of manuscript: All authors
Accountable for all aspects of the work: All authors
AUTHORS' DISCLOSURES OF POTENTIAL CONFLICTS OF INTEREST
The following represents disclosure information provided by authors of this manuscript. All relationships are considered compensated. Relationships are self-held unless noted. I = Immediate Family Member, Inst = My Institution. Relationships may not relate to the subject matter of this manuscript. For more information about ASCO's conflict of interest policy, please refer to www.asco.org/rwc or ascopubs.org/jco/site/ifc.
Hung T. Khong
Stock and Other Ownership Interests: Exelixis, Apricus Biosciences, Aptose Biosciences, Array BioPharma, MEI Pharma, TG Therapeutics, Immunomedics, Savara, Molecular Templates
Research Funding: Celgene (Inst), Bristol-Myers Squibb (Inst)
No other potential conflicts of interest were reported.
REFERENCES
- 1.Swart M, Verbrugge I, Beltman JB. Combination approaches with immune-checkpoint blockade in cancer therapy. Front Oncol. 2016;6:233. doi: 10.3389/fonc.2016.00233. [DOI] [PMC free article] [PubMed] [Google Scholar]
- 2.Hodi FS, O’Day SJ, McDermott DF, et al. Improved survival with ipilimumab in patients with metastatic melanoma. N Engl J Med. 2010;363:711–723. doi: 10.1056/NEJMoa1003466. [DOI] [PMC free article] [PubMed] [Google Scholar]
- 3.Robert C, Thomas L, Bondarenko I, et al. Ipilimumab plus dacarbazine for previously untreated metastatic melanoma. N Engl J Med. 2011;364:2517–2526. doi: 10.1056/NEJMoa1104621. [DOI] [PubMed] [Google Scholar]
- 4.Topalian SL, Hodi FS, Brahmer JR, et al. Safety, activity, and immune correlates of anti-PD-1 antibody in cancer. N Engl J Med. 2012;366:2443–2454. doi: 10.1056/NEJMoa1200690. [DOI] [PMC free article] [PubMed] [Google Scholar]
- 5.Brahmer JR, Tykodi SS, Chow LQ, et al. Safety and activity of anti-PD-L1 antibody in patients with advanced cancer. N Engl J Med. 2012;366:2455–2465. doi: 10.1056/NEJMoa1200694. [DOI] [PMC free article] [PubMed] [Google Scholar]
- 6.Ott PA, Hodi FS, Kaufman HL, et al. Combination immunotherapy: A road map. J Immunother Cancer. 2017;5:16. doi: 10.1186/s40425-017-0218-5. [DOI] [PMC free article] [PubMed] [Google Scholar]
- 7.Patel SA, Minn AJ. Combination cancer therapy with immune checkpoint blockade: Mechanisms and strategies. Immunity. 2018;48:417–433. doi: 10.1016/j.immuni.2018.03.007. [DOI] [PMC free article] [PubMed] [Google Scholar]
- 8.Demaria S, Kawashima N, Yang AM, et al. Immune-mediated inhibition of metastases after treatment with local radiation and CTLA-4 blockade in a mouse model of breast cancer. Clin Cancer Res. 2005;11:728–734. [PubMed] [Google Scholar]
- 9.Twyman-Saint VC, Rech AJ, Maity A, et al. Radiation and dual checkpoint blockade activate non-redundant immune mechanisms in cancer. Nature. 2015;520:373–377. doi: 10.1038/nature14292. [DOI] [PMC free article] [PubMed] [Google Scholar]
- 10.Poleszczuk JT, Luddy KA, Prokopiou S, et al. Abscopal benefits of localized radio- therapy depend on activated T-cell trafficking and distribution between metastatic lesions. Cancer Res. 2016;76:1009–1018. doi: 10.1158/0008-5472.CAN-15-1423. [DOI] [PubMed] [Google Scholar]
- 11.Chappell M, Chelliah V, Cherkaoui M, et al. Mathematical modelling for combinations of immuno-oncology and anti-cancer therapies – report of the QSP UK meeting. 2015
- 12.Serre R, Benzekry S, Padovani L, et al. Mathematical modeling of cancer immunotherapy and its synergy with radiotherapy. Cancer Res. 2016;76:4931–4940. doi: 10.1158/0008-5472.CAN-15-3567. [DOI] [PubMed] [Google Scholar]
- 13.Langer C, Gaddgeel SM, Borghaei H, et al. Randomized, phase 2 study of carboplatin and pemetrexed with or without pembrolizumab as first-line therapy for advanced NSCLC: Keynote-021 cohort G. Ann Oncol. 2016;27(suppl 6) [Google Scholar]
- 14.Pfirschke C, Engblom C, Rickelt S, et al. Immunogenic chemotherapy sensitizes tumors to checkpoint blockade therapy. Immunity. 2016;44:343–354. doi: 10.1016/j.immuni.2015.11.024. [DOI] [PMC free article] [PubMed] [Google Scholar]
- 15.Radfar S, Wang Y, Khong HT. Activated CD4+ T cells dramatically enhance chemotherapeutic tumor responses in vitro and in vivo. J Immunol. 2009;183:6800–6807. doi: 10.4049/jimmunol.0901747. [DOI] [PubMed] [Google Scholar]
- 16.Wheeler CJ, Das A, Liu G, et al. Clinical responsiveness of glioblastoma multiforme to chemotherapy after vaccination. Clin Cancer Res. 2004;10:5316–5326. doi: 10.1158/1078-0432.CCR-04-0497. [DOI] [PubMed] [Google Scholar]
- 17.Gribben JG, Ryan DP, Boyajian R, et al. Unexpected association between induction of immunity to the universal tumor antigen CYP1B1 and response to next therapy. Clin Cancer Res. 2005;11:4430–4436. doi: 10.1158/1078-0432.CCR-04-2111. [DOI] [PubMed] [Google Scholar]
- 18.Antonia SJ, Mirza N, Fricke I, et al. Combination of p53 cancer vaccine with chemotherapy in patients with extensive stage small cell lung cancer. Clin Cancer Res. 2006;12:878–887. doi: 10.1158/1078-0432.CCR-05-2013. [DOI] [PubMed] [Google Scholar]
- 19.Arlen PM, Gulley JL, Parker C, et al. A randomized phase II study of concurrent docetaxel plus vaccine versus vaccine alone in metastatic androgen-independent prostate cancer. Clin Cancer Res. 2006;12:1260–1269. doi: 10.1158/1078-0432.CCR-05-2059. [DOI] [PMC free article] [PubMed] [Google Scholar]
- 20.Schlom J, Arlen PM, Gulley JL. Cancer vaccines: Moving beyond current paradigms. Clin Cancer Res. 2007;13:3776–3782. doi: 10.1158/1078-0432.CCR-07-0588. [DOI] [PMC free article] [PubMed] [Google Scholar]
- 21.Deng L, Liang H, Xu M, et al. STING-dependent cytosolic DNA sensing promotes radiation-induced type I interferon-dependent antitumor immunity in immunogenic tumors. Immunity. 2014;41:843–852. doi: 10.1016/j.immuni.2014.10.019. [DOI] [PMC free article] [PubMed] [Google Scholar]
- 22.Goel S, DeCristo MJ, Watt AC, et al. CDK4/6 inhibition triggers anti-tumour immunity. Nature. 2017;548:471–475. doi: 10.1038/nature23465. [DOI] [PMC free article] [PubMed] [Google Scholar]
- 23.Zhang J, Bu X, Wang H, et al. Cyclin D-CDK4 kinase destabilizes PD-L1 via cullin 3-SPOP to control cancer immune surveillance. Nature. 2018;553:91–95. doi: 10.1038/nature25015. [DOI] [PMC free article] [PubMed] [Google Scholar]
- 24.Cooper ZA, Juneja VR, Sage PT, et al. Response to BRAF inhibition in melanoma is enhanced when combined with immune checkpoint blockade. Cancer Immunol Res. 2014;2:643–654. doi: 10.1158/2326-6066.CIR-13-0215. [DOI] [PMC free article] [PubMed] [Google Scholar]
- 25.Frederick DT, Piris A, Cogdill AP, et al. BRAF inhibition is associated with enhanced melanoma antigen expression and a more favorable tumor microenvironment in patients with metastatic melanoma. Clin Cancer Res. 2013;19:1225–1231. doi: 10.1158/1078-0432.CCR-12-1630. [DOI] [PMC free article] [PubMed] [Google Scholar]
- 26.Anderson ARA, Maini PK. Mathematical oncology. Bull Math Biol. 2018;80:945–953. doi: 10.1007/s11538-018-0423-5. [DOI] [PubMed] [Google Scholar]
- 27.Kuznetsov VA, Makalkin IA, Taylor MA, et al. Nonlinear dynamics of immunogenic tumors: parameter estimation and global bifurcation analysis. Bull Math Biol. 1994;56:295–321. doi: 10.1007/BF02460644. [DOI] [PubMed] [Google Scholar]
- 28.Kirschner D, Panetta JC. Modeling immunotherapy of the tumor-immune interaction. J Math Biol. 1998;37:235–252. doi: 10.1007/s002850050127. [DOI] [PubMed] [Google Scholar]
- 29.de Pillis LG, Radunskaya AE, Wiseman CL. A validated mathematical model of cell-mediated immune response to tumor growth. Cancer Res. 2005;65:7950–7958. doi: 10.1158/0008-5472.CAN-05-0564. [DOI] [PubMed] [Google Scholar]
- 30.Robertson-Tessi M, El-Kareh A, Goriely A. A model for effects of adaptive immunity on tumor response to chemotherapy and chemoimmunotherapy. J Theor Biol. 2015;380:569–584. doi: 10.1016/j.jtbi.2015.06.009. [DOI] [PubMed] [Google Scholar]
- 31.Nikolopoulou E, Johnson LR, Harris D, et al. Tumour-immune dynamics with an immune checkpoint inhibitor. Lett Biomath. 2018;5(suppl 1):S137–S159. [Google Scholar]
- 32.Turnbull AK, Arthur LM, Renshaw L, et al. Accurate prediction and validation of response to endocrine therapy in breast cancer. J Clin Oncol. 2015;33:2270–2278. doi: 10.1200/JCO.2014.57.8963. [DOI] [PubMed] [Google Scholar]
- 33.Wimberly H, Brown JR, Schalper K, et al. PD-L1 expression correlates with tumor-infiltrating lymphocytes and response to neoadjuvant chemotherapy in breast cancer. Cancer Immunol Res. 2015;3:326–332. doi: 10.1158/2326-6066.CIR-14-0133. [DOI] [PMC free article] [PubMed] [Google Scholar]
- 34.Ali HR, Glont SE, Blows FM, et al. PD-L1 protein expression in breast cancer is rare, enriched in basal-like tumours and associated with infiltrating lymphocytes. Ann Oncol. 2015;26:1488–1493. doi: 10.1093/annonc/mdv192. [DOI] [PubMed] [Google Scholar]
- 35.Mazel M, Jacot W, Pantel K, et al. Frequent expression of PD-L1 on circulating breast cancer cells. Mol Oncol. 2015;9:1773–1782. doi: 10.1016/j.molonc.2015.05.009. [DOI] [PMC free article] [PubMed] [Google Scholar]
- 36.Ellis MJ, Tao Y, Luo J, et al. Outcome prediction for estrogen receptor-positive breast cancer based on postneoadjuvant endocrine therapy tumor characteristics. J Natl Cancer Inst. 2008;100:1380–1388. doi: 10.1093/jnci/djn309. [DOI] [PMC free article] [PubMed] [Google Scholar]
- 37.Wei W-Z, Lopez DM, editors. Immunology of Breast Cancer. Amsterdam, Netherlands; IOS Press; 2004. Vol. 20. [Google Scholar]
- 38.Tutunea-Fatan E, Majumder M, Xin X, et al. The role of CCL21/CCR7 chemokine axis in breast cancer-induced lymphangiogenesis. Mol Cancer. 2015;14:35. doi: 10.1186/s12943-015-0306-4. [DOI] [PMC free article] [PubMed] [Google Scholar]
- 39.Cunningham HD, Shannon LA, Calloway PA, et al. Expression of the C-C chemokine receptor 7 mediates metastasis of breast cancer to the lymph nodes in mice. Transl Oncol. 2010;3:354–361. doi: 10.1593/tlo.10178. [DOI] [PMC free article] [PubMed] [Google Scholar]
- 40.Mo M, Zhou M, Wang L, et al. CCL21/CCR7 enhances the proliferation, migration, and invasion of human bladder cancer T24 cells. PLoS One. 2015;10:e0119506. doi: 10.1371/journal.pone.0119506. [DOI] [PMC free article] [PubMed] [Google Scholar]
- 41.Xu B, Zhou M, Qiu W, et al. CCR7 mediates human breast cancer cell invasion, migration by inducing epithelial-mesenchymal transition and suppressing apoptosis through AKT pathway. Cancer Med. 2017;6:1062–1071. doi: 10.1002/cam4.1039. [DOI] [PMC free article] [PubMed] [Google Scholar]
- 42.Li X, Sun S, Li N, et al. High expression of CCR7 predicts lymph node metastasis and good prognosis in triple negative breast cancer. Cell Physiol Biochem. 2017;43:531–539. doi: 10.1159/000480526. [DOI] [PubMed] [Google Scholar]
- 43.Axelrod R, Axelrod DE, Pienta KJ. Evolution of cooperation among tumor cells. Proc Natl Acad Sci USA. 2006;103:13474–13479. doi: 10.1073/pnas.0606053103. [DOI] [PMC free article] [PubMed] [Google Scholar]
- 44.Nowak MA. Evolutionary Dynamics. Cambridge, MA: Harvard University Press; 2006. [Google Scholar]
- 45.Hummert S, Bohl K, Basanta D, et al. Evolutionary game theory: Cells as players. Mol Biosyst. 2014;10:3044–3065. doi: 10.1039/c3mb70602h. [DOI] [PubMed] [Google Scholar]
- 46.Merlo LM, Pepper JW, Reid BJ, et al. Cancer as an evolutionary and ecological process. Nat Rev Cancer. 2006;6:924–935. doi: 10.1038/nrc2013. [DOI] [PubMed] [Google Scholar]
- 47.Attolini CS, Michor F. Evolutionary theory of cancer. Ann N Y Acad Sci. 2009;1168:23–51. doi: 10.1111/j.1749-6632.2009.04880.x. [DOI] [PubMed] [Google Scholar]
- 48.Greaves M, Maley CC. Clonal evolution in cancer. Nature. 2012;481:306–313. doi: 10.1038/nature10762. [DOI] [PMC free article] [PubMed] [Google Scholar]
- 49.Nowell PC. The clonal evolution of tumor cell populations. Science. 1976;194:23–28. doi: 10.1126/science.959840. [DOI] [PubMed] [Google Scholar]
- 50.Zhang J, Cunningham JJ, Brown JS, et al. Integrating evolutionary dynamics into treatment of metastatic castrate-resistant prostate cancer. Nat Commun. 2017;8:1816. doi: 10.1038/s41467-017-01968-5. [DOI] [PMC free article] [PubMed] [Google Scholar]
- 51.Kaznatcheev A, Peacock J, Basanta D, et al. Fibroblasts and alectinib switch the evolutionary games that non-small cell lung cancer plays. bioRxiv. 2017. 179259. [DOI] [PMC free article] [PubMed]
- 52.West J, Newton PK. Chemotherapeutic dose scheduling based on tumor growth rates provides a case for low-dose metronomic high-entropy therapies. Cancer Res. 2017;77:6717–6728. doi: 10.1158/0008-5472.CAN-17-1120. [DOI] [PMC free article] [PubMed] [Google Scholar]
- 53.West J, Ma Y. Capitalizing on competition: An evolutionary model of competitive release in metastatic castrate resistant prostate cancer treatment. J Theor Biol. 2018;455:249–260. doi: 10.1016/j.jtbi.2018.07.028. [DOI] [PMC free article] [PubMed] [Google Scholar]
- 54.Basanta D, Gatenby RA, Anderson AR. Exploiting evolution to treat drug resistance: Combination therapy and the double bind. Mol Pharm. 2012;9:914–921. doi: 10.1021/mp200458e. [DOI] [PMC free article] [PubMed] [Google Scholar]
- 55.Maynard Smith J. Game Theory and the Evolution of Fighting. Edinburgh, UK: Edinburgh University Press; 1972. pp. 8–28. [Google Scholar]


