Abstract
Purpose
To develop a public-private partnership to study the feasibility of a new approach in collecting and analyzing clinically annotated imaging data from landmark phase III trials in advanced solid tumors.
Patients and Methods
The collection of clinical trials fulfilled the following inclusion criteria: completed randomized trials of > 300 patients, highly measurable solid tumors (non–small-cell lung cancer, colorectal cancer, renal cell cancer, and melanoma), and required sponsor and institutional review board sign-offs. The new approach in analyzing computed tomography scans was to transfer to an academic image analysis laboratory, draw contours semi-automatically by using in-house–developed algorithms integrated into the open source imaging platform Weasis, and perform serial volumetric measurement.
Results
The median duration of contracting with five sponsors was 12 months. Ten trials in 7,085 patients that covered 12 treatment regimens across 20 trial arms were collected. To date, four trials in 3,954 patients were analyzed. Source imaging data were transferred to the academic core from 97% of trial patients (n = 3,837). Tumor imaging measurements were extracted from 82% of transferred computed tomography scans (n = 3,162). Causes of extraction failure were nonmeasurable disease (n = 392), single imaging time point (n = 224), and secondary captured images (n = 59). Overall, clinically annotated imaging data were extracted in 79% of patients (n = 3,055), and the primary trial end point analysis in each trial remained representative of each original trial end point.
Conclusion
The sharing and analysis of source imaging data from large randomized trials is feasible and offer a rich and reusable, but largely untapped, resource for future research on novel trial-level response and progression imaging metrics.
INTRODUCTION
Historically, cancer drug development has had a high failure rate with an atypically high frequency of failure at late stages.1-12 New trial designs and regulatory approaches are intended to reduce the total costs to reach one new investigational oncology drug approval, which is estimated at $1 billion.13 The success of clinical trials partially depends on the end points, and as more therapeutic agents have been approved for expanded indications in oncology, modern trials have been less likely to use the clinical end point of overall survival (OS).
The commonly used imaging end points of objective response rate (ORR) and progression-free survival (PFS) have remained relatively unchanged in recent decades.14 Each is based on consensus categorical criteria, such as the Response Evaluation Criteria in Solid Tumors (RECIST).15-18 Briefly, the objective criteria require the treating clinical team to identify up to five target lesions at initiation of treatment as well as nonmeasurable and nontarget lesions. The sum of the longest diameter of each target lesion is then recorded throughout the treatment and used to reflect the total tumor burden. The evolution of nontarget lesions as well as new lesions is recorded as a qualitative metric. A ≥ 30% decrease in target lesions is the threshold for an objective partial response. The appearance of new lesions, or a 20% increase from the smallest measured burden, determines progressive disease, with the time until the patient’s disease meets that category, the PFS. However, tumor diameter measurements and qualitative metrics collected at sites on case report forms (CRFs) over the course of a trial are limited and lead to a potentially flawed estimation of tumor burden and representation of treatment effect.19
Interest in the power of data sharing and big data to fill knowledge gaps has surged. One such knowledge gap is an understanding of which imaging end points are most reliable and efficient for characterizing therapeutic effect in clinical trials. The revisiting of imaging data from completed clinical trials is an example of a big data approach to identifying alternative metrics that can predict success of a new therapy. We hypothesized that such alternative metrics outperform existing imaging end points such as ORR and PFS. The advent of a new generation of anticancer therapies challenges the current discretization of treatment effect by RECIST 1.1 into four categories of response and progression used to calculate ORR and PFS.14 First, cytostatic targeted molecular therapies do not shrink tumors by the same magnitude as cytotoxic therapy while still providing clear clinical benefit.20 Second, the rapid rise of immune checkpoint blockade agents has produced an increasing number of trials with unusual patterns of response and progression.21
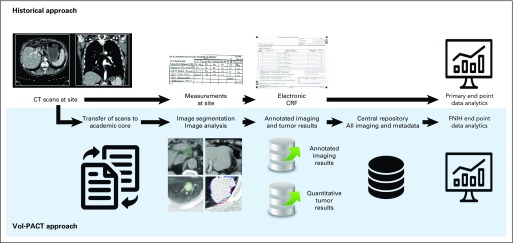
In this new era of personalized oncology care, the design and conduct of clinical trials has not yet implemented new imaging biomarkers derived from widely available standard clinical trial imaging techniques.22-24 Our group has developed comprehensive, semi-automated tools for deciphering tumor imaging phenotype.25 However, these tools need the collection and segmentation of source imaging data rather than simple measurements of tumor diameter at sites (Fig 1). The critical need to develop new prognostic and predictive imaging metrics fostered a public-private partnership through the creation of Vol-PACT (Advanced Metrics and Modeling With Volumetric Computed Tomography for Precision Analysis of Clinical Trial Results). The ultimate goal of Vol-PACT is to deploy quantitative imaging metrics that can improve clinical trial analytics and reliably predict clinical trial outcomes.
Fig 1.
Flow diagram: comparison of historical and Vol-PACT (Advanced Metrics and Modeling With Volumetric Computed Tomography [CT] for Precision Analysis of Clinical Trial Results) approaches. The historical approach relies on the measurement of target lesion diameters at site. Vol-PACT has developed more comprehensive tools for imaging assessment, but these tools need source imaging data rather than simple measurements. CRF, case report file; FNIH, Foundation for the National Institutes of Health.
Well-annotated imaging data represent a unique challenge because of the size and complexity of these data sets. We present an initial report on the feasibility of central collection and analysis of clinically annotated imaging data from landmark phase III trials in advanced solid tumors with the intention that these data permit the development of new computed tomography (CT)–based imaging metrics for describing therapeutic effect.
PATIENTS AND METHODS
Research Consortium
Academic research partners.
Vol-PACT was initially conceptualized through a working group of the Biomarkers Consortium, a public-private biomedical research partnership managed by the Foundation for the National Institutes of Health (FNIH). Vol-PACT was afforded oversight by members of the National Cancer Institute and Food and Drug Administration. It includes participating industrial partnership and federal oversight as well as the clinical investigators at Dana-Farber Cancer Institute, the Computational Image Analysis Laboratory (CIAL) at Columbia University Medical Center, the therapeutics research team of the Inova Center for Personalized Health, and statisticians at Memorial Sloan Kettering Cancer Center. Each academic institution executed an independent Research Collaboration Agreement with FNIH. These agreements define project team members and describe the roles of sites and their relationships with each institution about how data will flow among them.
Institutional review board considerations.
After the research collaboration agreements were signed and the project funded and launched, investigators received independent nonhuman subjects research approval from their institutional review board.
Selection of eligible trials.
Trials registered at ClinicalTrials.gov were screened for the following inclusion criteria: phase II or III trial with two or more intervention arms sponsored by industry; completed study; primary tumor type with a large proportion of measurable, quantifiable disease (non–small-cell lung cancer [NSCLC], colorectal cancer [CRC], renal cell cancer [RCC], and melanoma); ≥ 300 patients accrued; primary end point of either OS or PFS; and CT images centrally collected and archived. We selected completed trials according to published hazard ratios (HRs) for OS or PFS value and aimed to include trials with both negative and positive findings so that imaging metrics could be studied across a range of trial outcomes.
Data sharing agreement.
Each pharmaceutical company negotiated a data sharing agreement. The FNIH Biomarkers Consortium’s Intellectual Property and Data Sharing Guidelines accompany the data sharing agreements executed by the companies. Proprietary company data are shared with the Vol-PACT project team but cannot be shared externally or made publicly available. The entire Vol-PACT project team committed to communally publishing trial-level results as a requirement of the FNIH Biomarkers Consortium.
Data Sharing Pipeline
De-identification and anonymization.
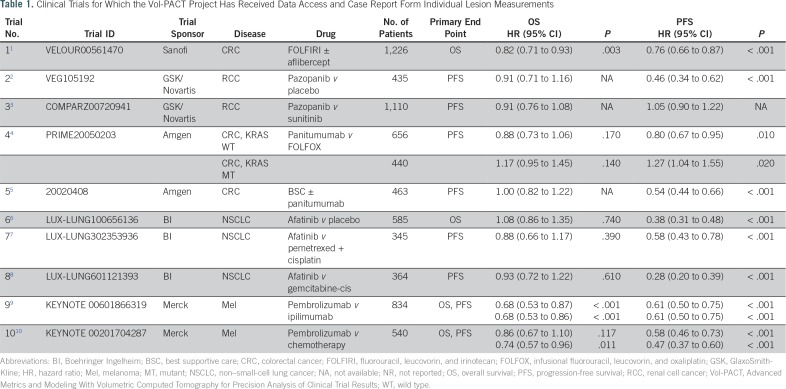
Imaging data and clinical information were shared by different sources (Table 1). In cases where data sets were already preanonymized, a single unified identifier was used by the company, and no test transfer occurred. Otherwise, de-identification process steps were required to ensure that both sets of data matched accurately. This process involved patient de-identification, with a combined key for both images and clinical data, and to ensure anonymization, the offsetting of key data values. Finally, for each trial, a test data transfer was performed. After each step was successfully achieved, the requested data were transferred and the source anonymization key destroyed.
Table 1.
Clinical Trials for Which the Vol-PACT Project Has Received Data Access and Case Report Form Individual Lesion Measurements
De-identified transfer of data.
Each company provided the intention-to-treat population and shared data directly either through an encrypted hard drive or through a secured Web-accessible SAS Clinical Trials Data Transparency (CTDT) portal (SAS Institute, Cary, NC). Some companies concerned about reinterpretation of published data did not transfer an entire study data set. The data were transferred separately in three files: patient-level de-identified Digital Imaging and Communications in Medicine (DICOM) images with a list of patient IDs and CT scan time points with corresponding scan dates; a generic set as well as a study-specific set (ie, cancer specific, treatment specific) of relevant baseline and on-treatment clinical data recorded for each patient for whom image files were shared; and a study-specific set of clinical data, including time-dependent longitudinal measurements and observations. Alternatively, some sponsors elected to share the entire coded clinical data file directly with the investigators or provided a set of investigators with registered access to the CTDT portal.
Standardization of the reference point.
We standardized the reference point for imaging data and initial treatment administration. The reference was the on-treatment date, an on-study date when a patient received the initial dose of any treatment. Some sponsors replaced actual dates by the delay after the on-treatment date, which was called day 1.
Clinical data.
To facilitate transfer among the companies, imaging contract research organization, and academic institutions and to ensure utility of the data once received, the team developed a data dictionary to describe the fields in the data sets. The clinical metadata and imaging files must have contained the same patient identifiers: study ID, patient ID, and date or study day. The clinical metadata provided the follow-up time or data cutoff date. A statement was included about whether the data cutoff was the same as that reported in the primary publications.
Computation of Imaging Features
Segmentation.
To better assess tumor burden, up to 10 target lesions > 1 cm in diameter at baseline were measured. All target lesions and new lesions upon appearance were segmented and measured at each scan time point by using the CIAL response assessment system built on open source software, the Weasis imaging platform.26 Three semi-automated algorithms developed for segmenting lesions in lung,27 liver,28 and lymph nodes along with a contour modification tool were used. The segmentation was supervised wherein computer-generated tumor contours were superimposed on the original images, reviewed by a radiologist, and corrected if not deemed visually accurate by the reviewing radiologist.
Extraction of imaging features.
On the basis of the final contours, the tumor axial maximal diameter, maximal perpendicular diameter, and volume were automatically calculated. Internal quality assurance programs, including target lesion matching among multiple scan time points and measurement outlier checking, were performed before the measurement result file was submitted.
Output.
At the end of the image analysis, a spreadsheet was provided to the statistical team under the supervision of independent quality control. The spreadsheet contained the following fields: patient ID, study date, number of target lesions, target lesion site, unidimensional measurement (in millimeters), perpendicular diameter (in millimeters), bidimensional measurement (the product of the maximal and the maximal perpendicular diameters [in square millimeters]), volume (in cubic millimeters), and comment (which documents information such as the existence of a nontarget lesion or new lesion that was not measured). The data management team extracted the patients who had both qualified imaging tumor measurements and clinical metadata into two separate spreadsheets that contained the same patient ID. Patients who had no target lesions measured at baseline were excluded.
Quality Control
Quality control of data transfer.
The CIAL received directly de-identified CT images in DICOM format and conducted an initial quality check, including the number of patients and scan time points and readability/measurability of the DICOM images against the transmittal form. The data management team compared the number of patients provided by the CIAL against the clinical metadata and/or publications as well as ascertained that each patient ID in the transmittal form accompanying the DICOM imaging files existed in the clinical metadata files and vice versa. After these initial quality control steps were completed, the data management team notified CIAL to start the imaging processing/analysis.
Quality control of tumor measurements.
The data management team conducted the following quality control checks on the tumor measurement spreadsheets provided by CIAL to determine whether errors existed or the file could otherwise be unified: visits with date and time point inconsistencies; visits with dates before the baseline visit dates; follow-up visits with dates before the randomization date; unidimensional, bidimensional, and volume measurements out of reasonable ranges; and duplicate lesion measurements on the same patient ID or date.
Quality control of clinical data.
The data management team examined key data elements in the clinical metadata, including the number of deaths and the number of progression-free events, to ascertain that they closely reflected the follow-up time/data cutoff date provided by the company and/or the published results.
RESULTS
Agreement to Share by Sponsor
Eighteen sponsors were approached. Five industry partners agreed to share data and committed to providing imaging and de-identified clinical data from 10 completed phase III trials: Sanofi (one trial), GlaxoSmithKline/Novartis (two trials), Amgen (two trials), Boehringer Ingelheim (three trials), and Merck (two trials). The implementation of contracting agreements took a median of 12 months across the five partners (range, 6 to 18 months). To date, we have received clinical and imaging data from eight trials. Clinical data were transferred by an encrypted hard drive for three trials and were made accessible in the SAS CTDT portal for five trials. The imaging data were transferred directly by an encrypted hard drive for eight trials (Fig 1).
Clinical Trial Characteristics
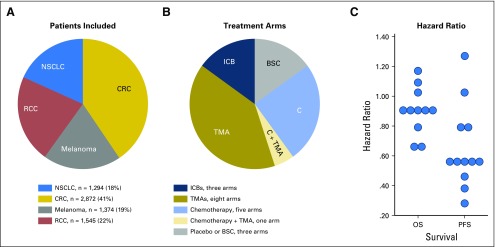
In the 10 committed phase III trials was a total of 7,085 patients (Table 1; Fig 2). Cancer types were CRC (three trials; 2,872 patients), RCC (two trials; 1,545 patients), NSCLC (three trials; 1,294 patients), and melanoma (two trials; 1,374 patients). The primary end point was PFS in six trials, OS in two trials, and both OS and PFS in two trials. In the 10 committed trials, the median trial HR for OS was 0.90 (range, 0.63 to 1.08) and for PFS, 0.58 (range, 0.28 to 1.05). Twenty treatment arms that covered 12 treatment regimens were analyzed.
Fig 2.
Clinical trial characteristics. (A) Ten trials have been committed, including 7,085 patients and four highly measurable solid tumors. (B) We balanced trials with positive and negative findings as demonstrated by the primary end point data analytics (progression-free survival [PFS] and/or overall survival [OS]) in each original trial. BSC, best supportive care; C, chemotherapy; CRC, colorectal cancer; ICB, immune checkpoint blocker; NSCLC, non–small-cell lung cancer; RCC, renal cell cancer; TMA, targeted molecular agent.
Feasibility of the Extraction of Imaging Features at Baseline
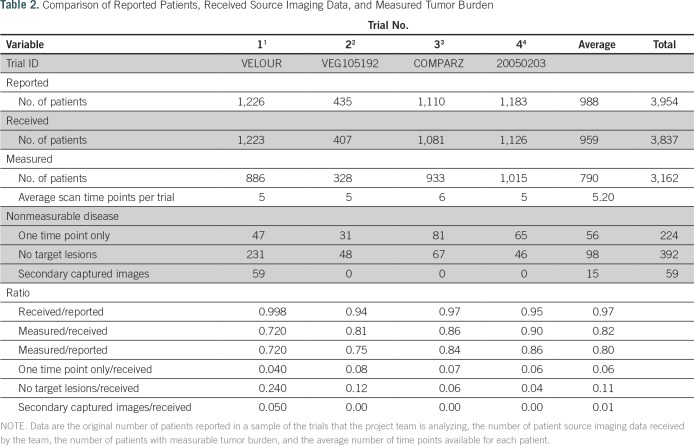
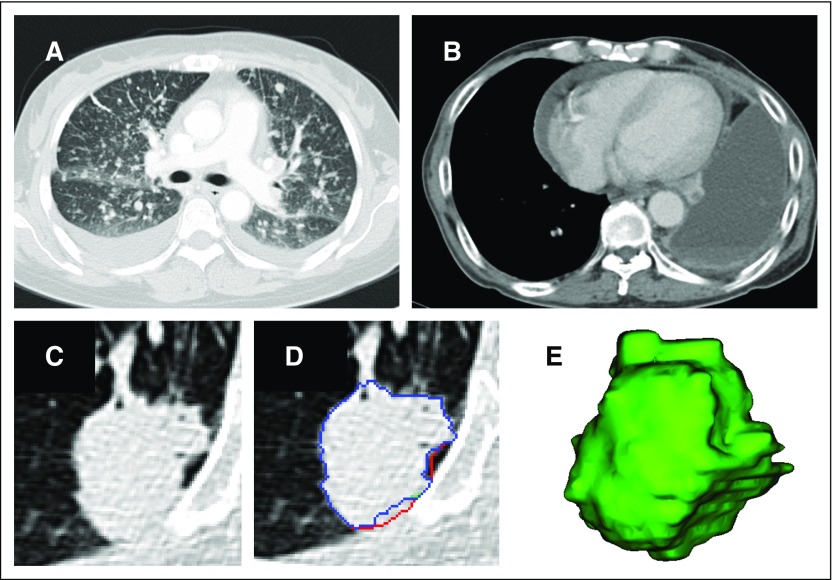
To date, semi-automated tumor measurement has been performed on data from four of the trials, which encompassed 3,954 patients; measurement is under way for four additional trials. Sponsors provided source imaging data from 3,837 of 3,954 patients included in the original clinical trial, which resulted in a transfer rate of source imaging data of 97% (range, 94% to 99.8%). We segmented target lesion volume with the intention to extract tumor imaging biomarkers in 80% (range, 72% to 86%) of all trial patients (3,162 of 3,954) and 82% (range, 72% to 90%) of patients for whom we received imaging data (3,162 of 3,837). We excluded 675 patients (18%) from imaging analysis because of the absence of measurable target lesions per RECIST 1.1 found at baseline (n = 392 [10%]), the availability of only one time point scan (n = 224 [6%]), or low-quality secondary captured images (n = 59 [1%]; Table 2; Fig 3). Each patient had an average of five scan time points.
Table 2.
Comparison of Reported Patients, Received Source Imaging Data, and Measured Tumor Burden
Fig 3.
Measurable and nonmeasurable disease. (A and B) If there is no measurable disease, then no tumor imaging biomarker can be extracted. (C) If a lesion is measurable according to Response Evaluation Criteria in Solid Tumors (RECIST) 1.1, radiologists can segment the tumor. (D and E) The three different colors show the contours delineated by three different radiologists in three dimensions (volume rendering) by using the semi-automated segmentation described in the Patients and Methods section.
Primary End Point in the Cohort
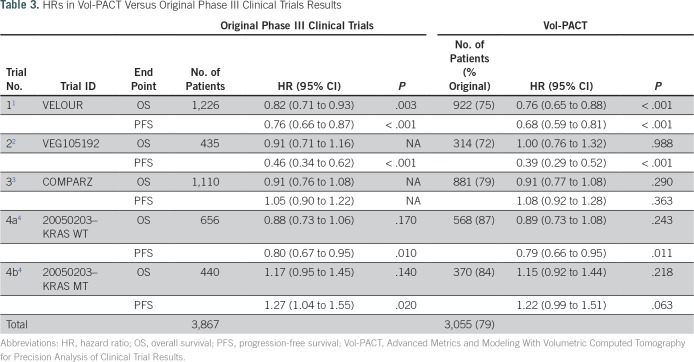
Clinical and imaging data were available for 3,055 (79%) of 3,867 patients to permit analysis of the primary end point for each of the four trials studied (Table 3). Note that the primary analysis of one trial was performed in two strata on the basis of KRAS mutation status and was therefore treated as two separate trials in our primary end point analyses: KRAS wild type (4a) and KRAS mutant (4b). In this trial, results only provide survival information in 93% of the 1,183 patients randomly assigned according to their KRAS exon 2 mutational status.4,29 The primary end point analysis for the subset of patients measured suggests that each trial cohort is representative of each original cohort, with the original HR for OS and PFS replicated across the five clinical trials arms (Table 3).
Table 3.
HRs in Vol-PACT Versus Original Phase III Clinical Trials Results
DISCUSSION
The FNIH Vol-PACT project measures and analyzes tumor images directly from landmark phase III trials in advanced solid tumors. The feasibility of such a data sharing effort creates an opportunity for other teams to join with the goal of developing new trial-level end points to improve the prediction of phase III trial success.
We demonstrated that the segmentation of target lesions is feasible in 80% of patients from the original phase III cohorts at an average of five time points. This will ultimately allow for a dynamic analysis of the kinetics and magnitude of tumor regression and growth.30-32 We showed that tumor imaging phenotype was not extractable in 18% of patients because of the absence of measurable target lesions on CT scan (10%), the discontinuation of treatment before the scheduled follow-up CT scan (6%), or the reception of secondary captured images that were not sufficient to extract imaging biomarkers (1%).
To date, 10 trials, including 7,085 patients, four cancer types (CRC, RCC, NSCLC, melanoma), and 20 treatment arms, have been committed. Our data set covers 12 treatment regimens, which permitted the analysis of response phenotypes33 across the full range of the current oncologic drug landscape (chemotherapy and targeted molecular agents and immune checkpoint blockers). We hypothesized that continuous imaging metrics that measure treatment-induced changes will be prognostic, and predictive biomarkers at a trial level will provide greater clarity for go/no-go decisions about drug development, accelerate cancer therapeutic development, and allow better patient care.
Toward this end, the FNIH Vol-PACT program proposes to generate new end points systematically by aggregating three types of metrics: lesion measurement (longest diameter, bidimensional, and volumetric) and log transformation of lesion measurement; time points (two fixed points, maximum and average over the study duration), including baseline and first or second cycle or midpoint of planned treatment (6 months if the plan is to treat until progression); and aggregation (of time points, tumor burden, lesion profile, and heterogeneity in response). We approach this challenge by simulating the transition from phase II to phase III trials by using a resampling strategy to generate 1,000 randomized phase II trials from a given phase III data set. We are then able to calibrate the sensitivity, specificity, and predictive values of the new imaging metrics for the best prediction of the necessary difference magnitude between two trial arms to call a trial positive or negative.
Our benchmark standards will be RECIST 1.1, immune-related RECIST,34 and CRFs. The reference metric will be RECIST ORR, a standard regulatory end point for single-agent anticancer therapy efficacy in phase II trials.35 In our three arms of patients who received immune checkpoint inhibitors (anti–programmed death 1 and anti–cytotoxic T-cell lymphocyte-4), we also will evaluate immune RECIST, including immune PFS. Vol-PACT has been closely collaborating with the European Organization for Research and Treatment of Cancer to generate consensus guidelines in immuno-oncology trials. CRFs are a potentially flawed but highly scalable resource given their wide availability. We will determine the reliability of completed CRF data and share CRF data with the European Organization for Research and Treatment of Cancer. To date, we received CRFs from four of eight clinical trials. In addition, we will evaluate how advanced metrics derived directly from imaging (eg, surrogate of shape, heterogeneity, necrosis, vascularity) as well as complete information about nontarget lesions and new lesions improve drug development compared with CRFs.
In conclusion, medical imaging end points are widely used in drug discovery and clinical trials to determine treatment effect through calculation of response rate and PFS. Historically, imaging end points have been determined through collection of serial measurements of simple tumor diameters, a limited approach that incompletely captures tumor burden and treatment effect. As an alternative, we studied the feasibility of central collection of CT images from landmark clinical trials to allow semi-automated calculation of tumor burden and treatment effect by aiming to develop a data set that will permit the study of alternate imaging-based trial end points. We find that advanced tumor burden measurement can be extracted in 80% of patients from completed randomized trials without biasing primary trial end point analysis. These methods could allow the widespread study of kinetics of tumor response and progression as well as of spatial and temporal heterogeneity, which would facilitate translational analysis of trial results and guide individual patient care. Most importantly, the size and complexity of such well-annotated imaging data sets should not be an impediment to creative analysis ideas because through such analysis, we create an opportunity to advance the clinical application of imaging science.
Footnotes
Scientific and financial support for the Foundation for the National Institutes of Health Biomarkers Consortium project Vol-PACT (Advanced Metrics and Modeling With Volumetric Computed Tomography for Precision Analysis of Clinical Trial Results) by Amgen, Boehringer Ingelheim, Merck, Genentech, Merck Sharp & Dohme, Regeneron Pharmaceuticals, and Takeda Pharmaceuticals. In-kind donations of phase II and III trial data to support the project are being provided to Foundation for the National Institutes of Health by Amgen, Boehringer Ingelheim, Novartis, Merck Sharp & Dohme, and Sanofi. Also supported by the National Institutes of Health (U01 CA140207) and a Cancer Clinical Investigator Team Leadership Award by the National Cancer Institute through a supplement to P30 CA006516. Support provided to Memorial Sloan Kettering by the core grant P30 CA008748.
AUTHOR CONTRIBUTIONS
Conception and design: All authors
Administrative support: Dana E. Connors, Ying Tang, Stacey J. Adam
Provision of study materials or patients: All authors
Collection and assembly of data: All authors
Data analysis and interpretation: All authors
Manuscript writing: All authors
Final approval of manuscript: All authors
AUTHORS' DISCLOSURES OF POTENTIAL CONFLICTS OF INTEREST
The following represents disclosure information provided by authors of this manuscript. All relationships are considered compensated. Relationships are self-held unless noted. I = Immediate Family Member, Inst = My Institution. Relationships may not relate to the subject matter of this manuscript. For more information about ASCO's conflict of interest policy, please refer to www.asco.org/rwc or ascopubs.org/jco/site/ifc.
Laurent Dercle
No relationship to disclose
Dana E. Connors
No relationship to disclose
Ying Tang
No relationship to disclose
Stacey J. Adam
No relationship to disclose
Mithat Gönen
Consulting or Advisory Role: Tesaro
Patrick Hilden
No relationship to disclose
Sanja Karovic
No relationship to disclose
Michael Maitland
Consulting or Advisory Role: Gilead Sciences (I)
Consulting or Advisory Role: Bayer AG (I), Merck Sharp & Dohme (I), United Therapeutics (I)
Chaya S. Moskowitz
Consulting or Advisory Role: BioClinica
Gary Kelloff
No relationship to disclose
Binsheng Zhao
Patents, Royalties, Other Intellectual Property: Varian Medical Systems
Geoffrey R. Oxnard
Honoraria: Chugai Pharmaceutical, Bio-Rad, Sysmex, Guardant Health
Consulting or Advisory Role: AstraZeneca, Inivata, Boehringer Ingelheim, Takeda Pharmaceuticals, Genentech, Roche, Novartis, Loxo Oncology, Ignyta, DropWorks
Patents, Royalties, Other Intellectual Property: Co-author of Dana-Farber Cancer Institute patent pending titled “Non-invasive blood-based monitoring of genomic alterations in cancer” (Inst)
Lawrence H. Schwartz
Consulting or Advisory Role: Novartis, GlaxoSmithKline
Research Funding: Eli Lilly (Inst), Astellas Pharma (Inst), Merck Sharp & Dohme (Inst), Pfizer (Inst)
Patents, Royalties, Other Intellectual Property: Varian Medical Systems
REFERENCES
- 1.Tabernero J, Van Cutsem E, Lakomý R, et al. : Aflibercept versus placebo in combination with fluorouracil, leucovorin and irinotecan in the treatment of previously treated metastatic colorectal cancer: Prespecified subgroup analyses from the VELOUR trial. Eur J Cancer 50:320-331, 2014 [DOI] [PubMed] [Google Scholar]
- 2.Sternberg CN, Davis ID, Mardiak J, et al. : Pazopanib in locally advanced or metastatic renal cell carcinoma: Results of a randomized phase III trial. J Clin Oncol 28:1061-1068, 2010 [DOI] [PubMed] [Google Scholar]
- 3.Motzer RJ, Hutson TE, Cella D, et al. : Pazopanib versus sunitinib in metastatic renal-cell carcinoma. N Engl J Med 369:722-731, 2013 [DOI] [PubMed] [Google Scholar]
- 4.Douillard JY, Siena S, Cassidy J, et al. : Final results from PRIME: Randomized phase III study of panitumumab with FOLFOX4 for first-line treatment of metastatic colorectal cancer. Ann Oncol 25:1346-1355, 2014 [DOI] [PubMed] [Google Scholar]
- 5.Peeters M, Douillard J-Y, Van Cutsem E, et al. : Mutant KRAS codon 12 and 13 alleles in patients with metastatic colorectal cancer: Assessment as prognostic and predictive biomarkers of response to panitumumab. J Clin Oncol 31:759-765, 2012 [DOI] [PubMed] [Google Scholar]
- 6.Miller VA, Hirsh V, Cadranel J, et al. : Afatinib versus placebo for patients with advanced, metastatic non-small-cell lung cancer after failure of erlotinib, gefitinib, or both, and one or two lines of chemotherapy (LUX-Lung 1): A phase 2b/3 randomised trial. Lancet Oncol 13:528-538, 2012 [DOI] [PubMed] [Google Scholar]
- 7.Yang JC-H, Schuler MH, Yamamoto N, et al. : LUX-Lung 3: A randomized, open-label, phase III study of afatinib versus pemetrexed and cisplatin as first-line treatment for patients with advanced adenocarcinoma of the lung harboring EGFR-activating mutations. J Clin Oncol 30, 2012 (suppl; abstr LBA7500) [Google Scholar]
- 8.Wu YL, Zhou C, Hu C-P, et al. : LUX-Lung 6: A randomized, open-label, phase III study of afatinib (A) versus gemcitabine/cisplatin (GC) as first-line treatment for Asian patients (pts) with EGFR mutation-positive (EGFR M+) advanced adenocarcinoma of the lung. J Clin Oncol 31, 2013 (suppl; abstr 8016) [Google Scholar]
- 9.Robert C, Schachter J, Long GV, et al. : Pembrolizumab versus ipilimumab in advanced melanoma. N Engl J Med 372:2521-2532, 2015 [DOI] [PubMed] [Google Scholar]
- 10.Ribas A, Puzanov I, Dummer R, et al. : Pembrolizumab versus investigator-choice chemotherapy for ipilimumab-refractory melanoma (KEYNOTE-002): A randomised, controlled, phase 2 trial. Lancet Oncol 16:908-918, 2015 [DOI] [PMC free article] [PubMed] [Google Scholar]
- 11.DiMasi JA, Grabowski HG: Economics of new oncology drug development. J Clin Oncol 25:209-216, 2007 [DOI] [PubMed] [Google Scholar]
- 12.Gan HK, You B, Pond GR, et al. : Assumptions of expected benefits in randomized phase III trials evaluating systemic treatments for cancer. J Natl Cancer Inst 104:590-598, 2012 [DOI] [PubMed] [Google Scholar]
- 13.Adams CP, Brantner VV: Estimating the cost of new drug development: Is it really 802 million dollars? Health Aff (Millwood) 25:420-428, 2006 [DOI] [PubMed] [Google Scholar]
- 14.Oxnard GR, Morris MJ, Hodi FS, et al. : When progressive disease does not mean treatment failure: Reconsidering the criteria for progression. J Natl Cancer Inst 104:1534-1541, 2012 [DOI] [PMC free article] [PubMed] [Google Scholar]
- 15.Schwartz LH, Mazumdar M, Brown W, et al. : Variability in response assessment in solid tumors: Effect of number of lesions chosen for measurement. Clin Cancer Res 9:4318-4323, 2003 [PubMed] [Google Scholar]
- 16.Zhao B, Tan Y, Bell DJ, et al. : Exploring intra- and inter-reader variability in uni-dimensional, bi-dimensional, and volumetric measurements of solid tumors on CT scans reconstructed at different slice intervals. Eur J Radiol 82:959-968, 2013 [DOI] [PMC free article] [PubMed] [Google Scholar]
- 17.Oxnard GR, Zhao B, Sima CS, et al. : Variability of lung tumor measurements on repeat computed tomography scans taken within 15 minutes. J Clin Oncol 29:3114-3119, 2011 [DOI] [PMC free article] [PubMed] [Google Scholar]
- 18.Zhao B, James LP, Moskowitz CS, et al. : Evaluating variability in tumor measurements from same-day repeat CT scans of patients with non-small cell lung cancer. Radiology 252:263-272, 2009 [DOI] [PMC free article] [PubMed] [Google Scholar]
- 19.Li CH, Bies RR, Wang Y, et al. : Comparative effects of CT imaging measurement on RECIST end points and tumor growth kinetics modeling. Clin Transl Sci 9:43-50, 2016 [DOI] [PMC free article] [PubMed] [Google Scholar]
- 20.Benjamin RS, Choi H, Macapinlac HA, et al. : We should desist using RECIST, at least in GIST. J Clin Oncol 25:1760-1764, 2007 [DOI] [PubMed] [Google Scholar]
- 21.Chiou VL, Burotto M: Pseudoprogression and immune-related response in solid tumors. J Clin Oncol 33:3541-3543, 2015 [DOI] [PMC free article] [PubMed] [Google Scholar]
- 22.Maitland ML, Bies RR, Barrett JS: A time to keep and a time to cast away categories of tumor response. J Clin Oncol 29:3109-3111, 2011 [DOI] [PubMed] [Google Scholar]
- 23.Maitland ML, Schilsky RL: Clinical trials in the era of personalized oncology. CA Cancer J Clin 61:365-381, 2011 [DOI] [PMC free article] [PubMed] [Google Scholar]
- 24.Maitland ML: Volumes to learn: Advancing therapeutics with innovative computed tomography image data analysis. Clin Cancer Res 16:4493-4495, 2010 [DOI] [PMC free article] [PubMed] [Google Scholar]
- 25.Zhao B, Tan Y, Tsai WY, et al. : Reproducibility of radiomics for deciphering tumor phenotype with imaging. Sci Rep 6:23428, 2016 [DOI] [PMC free article] [PubMed] [Google Scholar]
- 26.Yang H, Schwartz LH, Zhao B: A response assessment platform for development and validation of imaging biomarkers in oncology. Tomography 2:406-410, 2016 [DOI] [PMC free article] [PubMed] [Google Scholar]
- 27.Tan Y, Schwartz LH, Zhao B: Segmentation of lung lesions on CT scans using watershed, active contours, and Markov random field. Med Phys 40:043502, 2013 [DOI] [PMC free article] [PubMed] [Google Scholar]
- 28.Yan J, Schwartz LH, Zhao B: Semiautomatic segmentation of liver metastases on volumetric CT images. Med Phys 42:6283-6293, 2015 [DOI] [PMC free article] [PubMed] [Google Scholar]
- 29.Douillard JY, Siena S, Cassidy J, et al. : Randomized, phase III trial of panitumumab with infusional fluorouracil, leucovorin, and oxaliplatin (FOLFOX4) versus FOLFOX4 alone as first-line treatment in patients with previously untreated metastatic colorectal cancer: The PRIME study. J Clin Oncol 28:4697-4705, 2010 [DOI] [PubMed] [Google Scholar]
- 30.Jain RK, Lee JJ, Ng C, et al. : Change in tumor size by RECIST correlates linearly with overall survival in phase I oncology studies. J Clin Oncol 30:2684-2690, 2012 [DOI] [PMC free article] [PubMed] [Google Scholar]
- 31.Stein WD, Wilkerson J, Kim ST, et al. : Analyzing the pivotal trial that compared sunitinib and IFN-α in renal cell carcinoma, using a method that assesses tumor regression and growth. Clin Cancer Res 18:2374-2381, 2012 [DOI] [PMC free article] [PubMed] [Google Scholar]
- 32.Stein WD, Wilkerson J, Kim ST, et al. : Analyzing the pivotal trial that compared sunitinib and IFN-α in renal cell carcinoma, using a method that assesses tumor regression and growth. Clin Cancer Res 18:2374-2381, 2012 [DOI] [PMC free article] [PubMed] [Google Scholar]
- 33.Oxnard GR, Schwartz LH: Response phenotype as a predictive biomarker to guide treatment with targeted therapies. J Clin Oncol 31:3739-3741, 2013 [DOI] [PubMed] [Google Scholar]
- 34.Seymour L, Bogaerts J, Perrone A, et al. : iRECIST: Guidelines for response criteria for use in trials testing immunotherapeutics. Lancet Oncol 18:e143-e152, 2017 [DOI] [PMC free article] [PubMed] [Google Scholar]
- 35.Oxnard GR, Wilcox KH, Gonen M, et al. : Response rate as a regulatory end point in single-arm studies of advanced solid tumors. JAMA Oncol 2:772-779, 2016 [DOI] [PMC free article] [PubMed] [Google Scholar]


