Abstract
PURPOSE
Natural language processing (NLP) techniques have been adopted to reduce the curation costs of electronic health records. However, studies have questioned whether such techniques can be applied to data from previously unseen institutions. We investigated the performance of a common neural NLP algorithm on data from both known and heldout (ie, institutions whose data were withheld from the training set and only used for testing) hospitals. We also explored how diversity in the training data affects the system’s generalization ability.
METHODS
We collected 24,881 breast pathology reports from seven hospitals and manually annotated them with nine key attributes that describe types of atypia and cancer. We trained a convolutional neural network (CNN) on annotations from either only one (CNN1), only two (CNN2), or only four (CNN4) hospitals. The trained systems were tested on data from five organizations, including both known and heldout ones. For every setting, we provide the accuracy scores as well as the learning curves that show how much data are necessary to achieve good performance and generalizability.
RESULTS
The system achieved a cross-institutional accuracy of 93.87% when trained on reports from only one hospital (CNN1). Performance improved to 95.7% and 96%, respectively, when the system was trained on reports from two (CNN2) and four (CNN4) hospitals. The introduction of diversity during training did not lead to improvements on the known institutions, but it boosted performance on the heldout institutions. When tested on reports from heldout hospitals, CNN4 outperformed CNN1 and CNN2 by 2.13% and 0.3%, respectively.
CONCLUSION
Real-world scenarios require that neural NLP approaches scale to data from previously unseen institutions. We show that a common neural NLP algorithm for information extraction can achieve this goal, especially when diverse data are used during training.
INTRODUCTION
Given the prohibitive cost of manual curation of electronic health records, there has been substantial interest in adopting natural language processing (NLP) techniques to automate this task.1-5 In past decades, these approaches have been successfully applied to extract relevant information about patients, their health conditions, and the state of their treatments. Advances in deep learning have further increased the accuracy of these systems, making them applicable to the clinical setting.3
Widely known is that the performance of NLP techniques depends on access to high-quality annotated data for training. To learn what to extract, these approaches need to observe a large number of electronic health records examples, annotated by experts with the relevant information. For instance, if the goal is to extract hormonal characteristics of the tumor from pathology notes, training reports need to be provided together with such information explicitly annotated. The collection of these annotations is, however, expensive and time consuming.
CONTEXT
Key Objective
Do neural information extraction algorithms generalize across institutions? Can they be applied to data from previously unseen organizations without being retrained?
Knowledge Generated
With an experiment on 24,881 breast pathology reports originated in seven hospitals, we show that a common neural natural language processing algorithm for information extraction generalizes well on data from different sources and attains high accuracy on reports from heldout organizations. Specifically, we trained a convolutional neural network to extract nine attributes from breast pathology reports and evaluated its performance on data from both known and heldout institutions. We show that the addition of diversity (ie, reports from multiple institutions) during training helps the generalization ability of the system when enough data are available.
Relevance
Neural information extraction algorithms can be trained on data from a few institutions and then can be applied to data from previously unseen hospitals and clinics. This helps to reduce the burden and cost of collecting annotations and retraining the system for each organization. Our experiments support the creation of diverse training sets.
NLP techniques assume that training examples are representative of the way information will be expressed in the reports on which the system will be applied. If reports provided for testing are written in a different format or style from those on which the model was trained, performance drops would be anticipated. Practically, this means that models trained on reports from one hospital may not generalize to data from previously unseen institutions.
In the clinical literature, it is customary to train and test NLP algorithms on data coming from the same organization.1-4 In a real-world scenario, however, the NLP systems may need to be applied also to reports from institutions that were not known at the time of training. This raises the question about whether these technologies can scale to such institutions without forcing them to retrain the models on newly collected data. Systems that can generalize without requiring new annotations will be essential for bringing this technology to practical use.
We assessed whether a state-of-the-art neural NLP algorithm generalizes across known and heldout (ie, institutions whose data were withheld from the training set and only used for testing) hospitals. In addition, we explore how introducing diversity in the training data affects model performance and robustness across institutions. Past work in clinical NLP looked at this question only in the context of non-neural models for information extraction.5 This investigation, however, becomes more pertinent in the context of neural algorithms, which are currently the state-of-the-art approaches and place substantial demand on the size of the training data, making the need for multi-institutional scalability even more acute.
METHODS
Data and Algorithm
Data collection and annotation.
With the approval of the institutional review boards of the respective hospitals, involved in this study, we obtained a total of 24,881 breast pathology reports that covered the clinical history of patients between 1987 and 2017. On the basis of a sample of 1,408 patients for whom meta-data were collected, patients were on average 56.16 years old and exhibited the following race distribution: 77% white, 4% African American, 3.5% Hispanic, 2% Asian, 13.5% unknown.
Reports came from the seven institutions with which we had active collaborations, namely five hospitals from the Boston area (ie, Massachusetts General Hospital [MGH], Brigham and Women’s Hospital [BWH], North Shore Medical Center, Brigham and Women’s Faulkner Hospital [FH], Newton-Wellesley Hospital [NWH]) and two other organizations (ie, Henry Ford Hospital [HFH; Detroit], Liaquat National Hospital & Medical College [Pakistan]). For HFH, we only had access to the diagnostic section of the breast pathology reports.
These reports were annotated with nine binary attributes by MGH physicians: breast side, invasive ductal carcinoma, invasive lobular carcinoma, ductal carcinoma in situ (DCIS), lobular carcinoma in situ, lobular neoplasia, atypical lobular hyperplasia, atypical ductal hyperplasia (ADH), and severe ADH. Other than breast side, where output values can be either left or right, all the other attributes can be either absent or present.
A subset of 180 annotations (ie, 10 randomly extracted annotations for each of the binary values of the nine attributes) was evaluated by an MGH physician who did not participate in the initial collection. The evaluation resulted in 96.6% agreement with the original annotations.
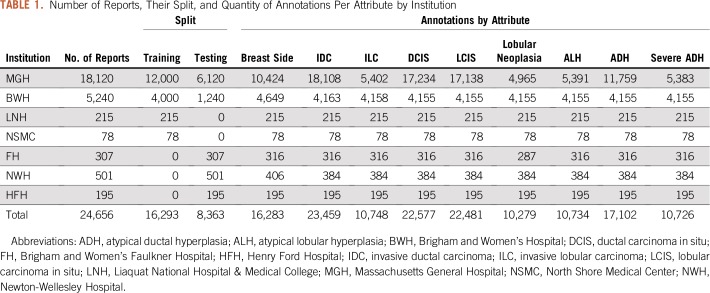
Annotations are not equally distributed across reports, that is, not every report contains annotations for each attribute. A breakdown of the number of reports and their annotations per institution is listed in Table 1.
TABLE 1.
Number of Reports, Their Split, and Quantity of Annotations Per Attribute by Institution
Algorithm.
A standard text processing pipeline was adopted for all institutions. It included splitting the reports into words (ie, tokenization) and removing meaningless characters, such as multiple hyphens that mark the report sections.
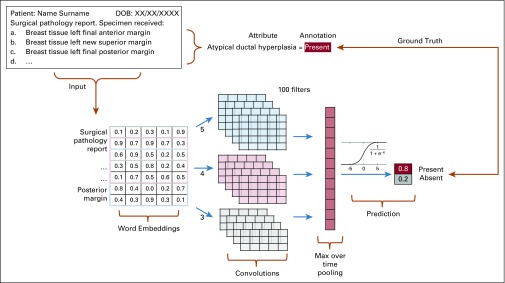
After processing, every report was represented as lists of embeddings,6 which are dense vectors that describe the semantics of the words contained in the document. The next step consisted of entering the embedding list as input to our system, which runs a word-level convolutional neural network (CNN)3,7 and returns the probability over the expected attribute values (ie, left/right, absent/present). Figure 1 illustrates a CNN extraction of the value present for the attribute ADH.
FIG 1.
Word-level convolutional neural network for extracting the absence or presence of atypical ductal hyperplasia from a breast pathology report. The free-text report (top left) is turned into a list of embeddings (bottom left). Convolutions, nonlinear projections, and the max over time pooling are then performed to allow the SoftMax function to predict the value probability. The extracted value is finally compared with the annotation in the ground truth. DOB, date of birth.
The CNN captures lexical and semantic regularities between chunks of contiguous words (ie, n-grams) in the reports. It does so by performing three basic operations over the embedding list representation: convolution, which consists of striding filters over the list of embeddings and passing the dot product to the next layer; nonlinear projection, which denoises the information, turns low signal to zero, and pushes high signal to one; and max pooling reduction, which shrinks the number of calculations by forwarding to the following layer only maximum values within a given window. The processed information finally is sent to a fully connected layer and passed to the SoftMax function, which outputs the probability distribution over the binary values of each attribute (ie, left/right, absent/present).
As for any other machine learning method, our algorithm has to go through three steps: training, validation, and testing. Training consists of an iterative process aimed at learning the best parameters to extract the correct information. Validation is iteratively alternated with training steps to estimate the best hyperparameter configuration for the model and to assess the learning progress over fresh data (ie, development set) to avoid overfitting the training set. Finally, when no more improvements are expected in the development set, the trained model can be tested on new examples (ie, test set). Code is available at https://github.com/yala/oncotext.
Evaluation
Data variance.
To quantify the format and style variance across institutions, for every organization, we analyzed the average report length (in both words and sentences) and the vocabulary diversity (in terms of unique tokens), and we listed the most frequently used words.
Train and test similarities.
Another way to measure the variance is to calculate the similarity between the n-gram vectors representing the train and test data. These vectors encode the relevance of contiguous words in the reports. For our experiments, we have chosen chunks between one and five words and measured their relevance with term frequency-inverse document frequency, which is a commonly adopted measure in NLP. Similarity between train and test is calculated with vector cosine, which returns a score between 0 and 1, where 1 means equality.
Settings and splits.
To evaluate the system performance and assess whether diversity helps it to generalize to heldout institutions, we tested three training settings: only one institution (CNN1); only two institutions (CNN2); and only four institutions (CNN4). The system trained in each setting was evaluated on data from five institutions, including both known-during-training and heldout hospitals.
CNN1 is meant to show whether the system trained on data from a single institution are able to generalize to reports from other sources. In this case, the training set consists of 12,000 MGH reports. CNN2 is meant to assess whether introducing annotated reports from another institution during training helps the system to achieve higher performance and generalizability. In this case, the training set consisted of 4,000 BWH reports integrated with 8,000 MGH reports from CNN1 (to total to 12,000 reports, as in the previous setting). Finally, CNN4 is meant to verify whether further diversifying the training set has a positive impact on the performance and generalizability. The training set for this setting consisted of 215 HFH and 78 North Shore Medical Center reports integrated with 4,000 BWH and 7,707 MGH reports (again, to total to 12,000 reports, as in the previous settings) respectively extracted from settings CNN2 and CNN1. The union of reports reserved for training amounts to 16,293, whereas the union of reports reserved for testing is 8,363 (a breakdown of the splits by institution is listed in Table 1).
Because reports did not contain annotations for every attribute, the CNNs were trained on the highest number of annotated reports (among 3,000, 5,000, and 6,000) available for all settings. For instance, if for a given attribute we had fewer than 5,000 annotations in CNN1, all the settings had to be trained for that attribute on 3,000 annotations. Of the selected number, 500 annotations were reserved for validation and constituted our development set.
Hyperparameters.
For all settings, we adopted batch size (32), dropout (0.25), initial learning rate (0.0001), weight decay (0.00005), hidden dimension (100), number of layers (one), kernel sizes (3, 4, 5), number of filters (100), maximum number of training epochs (75), maximum number of considered words (720), and tuning metric (accuracy). Weighted batches were used to ensure that under-represented labels (some attributes have skewed label distribution) were seen by the system more often.
Metrics.
For every setting, we report the system accuracy on each attribute by institution together with the average accuracy among the known-during-training, the heldout, and all institutions. Accuracy was defined as the portion of times the extracted values agree with those annotated in the ground truth. The provided scores were calculated with the models trained on the largest number of available annotated reports, as described in the Hyperparameters section.
Learning curves.
We also provide learning curves that show how much data every setting needed to perform well on reports from both the known-during-training and the heldout sources. Learning curves average the system performance across attributes in the various settings for the following a priori established training sizes: 500, 1,500, 2,500, 4,500, and 5,500.
RESULTS
Data Variance
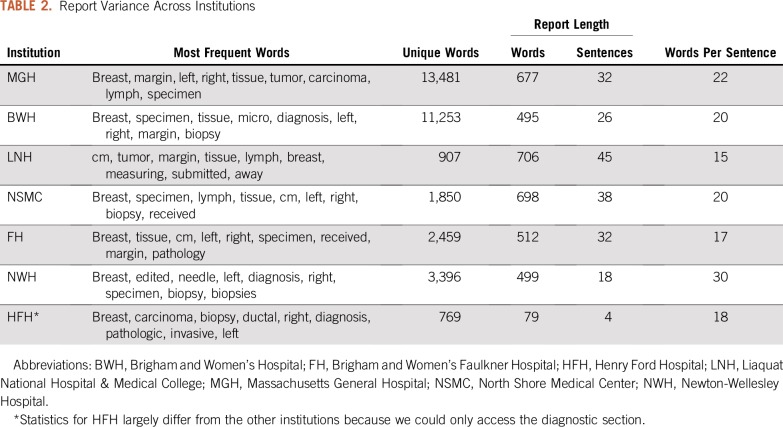
Table 2 lists the statistics on variance in word distribution across hospitals. The longest reports came from Liaquat National Hospital & Medical College and consisted of an average of 706 words organized in an average of 45 sentences, with approximately 15 words per sentence. The shortest reports came from HFH because for this institution, we could only access the diagnostic section of the reports. Their length was quantified as an average of 79 words organized in four sentences, with approximately 18 words per sentence.
TABLE 2.
Report Variance Across Institutions
Differences also can be seen at the lexical level. The vocabulary size informs us about how formulaic the reports are. This number largely varied across institutions. MGH had the most unique tokens (ie, 13,481, which is proportionally comparable to the 11,253 tokens of BWH), whereas HFH had the least unique tokens (ie, 769) because of access being restricted to the diagnostic section. Furthermore, while looking at the most frequent words by institution, we could find rank differences that are representative of the way reports are written.
Train and Test Similarities
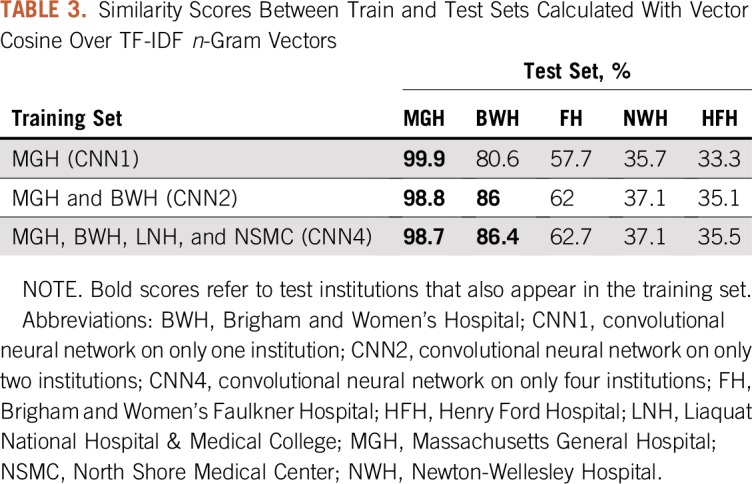
Table 3 lists the similarity scores between train and test sets. As we could expect, these scores were high when the test institution was represented in the training data (eg, in the cases of MGH and BWH). Scores were instead lower for the other institutions. In particular, FH was still relatively similar to MGH and BWH, whereas NWH and HFH seemed different. Vertically, the data listed in Table 3 show that similarity between train and test data decreased for MGH and increased for all the other institutions because more diversity was introduced in the training (with a minor exception for NWH).
TABLE 3.
Similarity Scores Between Train and Test Sets Calculated With Vector Cosine Over TF-IDF n-Gram Vectors
Settings
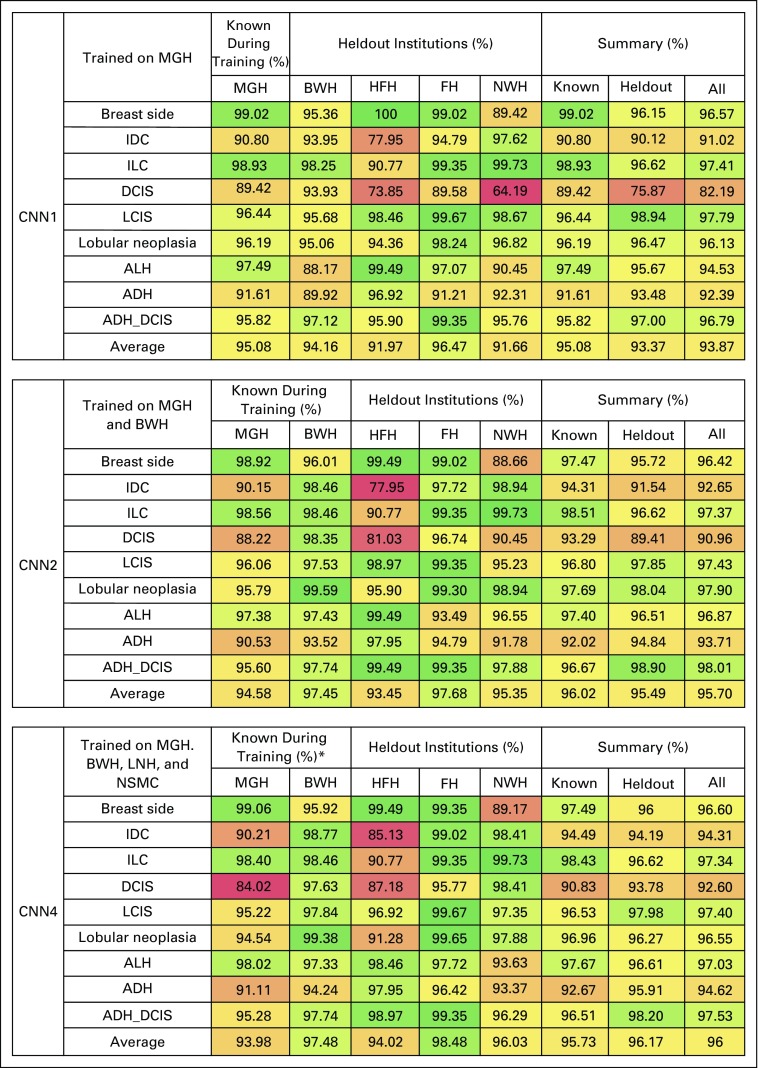
Figure 2 lists the accuracy scores obtained by the system in the three settings. Performance ranged between 91.66% (NWH in CNN1) and 98.48% (FH in CNN4).
FIG 2.
Accuracy scores per attribute by institution in the three settings: convolutional neural network (CNN) in only one institution (CNN1) trained on only Massachusetts General Hospital (MGH); CNN in only two institutions (CNN2) trained on MGH and Brigham and Women’s Hospital (BWH); and CNN in only four institutions (CNN4) trained on MGH, BWH, Liaquat National Hospital & Medical College (LNH), and North Shore Medical Center (NSMC). (*) LNH and NSMC do not appear because all of their reports were used for training. ADH, atypical ductal hyperplasia; ALH, atypical lobular hyperplasia; DCIS, ductal carcinoma in situ; FH, Brigham and Women’s Faulkner Hospital; HFH, Henry Ford Hospital; IDC, invasive ductal carcinoma; ILC, invasive lobular carcinoma; LCIS, lobular carcinoma in situ; NWH, Newton-Wellesley Hospital.
The average accuracy across attributes for all institutions monotonically grew as data diversity increased (93.87%, 95.7%, and 96% for CNN1, CNN2, and CNN4, respectively). The accuracy on the subset of known-during-training institutions followed an irregular pattern, which grew from 95.08% to 96.02% between CNN1 and CNN2 and dropped again to 95.73% in CNN4. The performance on data from the subset of new sources grew monotonically (93.37%, 95.49%, and 96.17% for CNN1, CNN2, and CNN4, respectively).
The gap between CNN2 and CNN1 is larger than the one between CNN4 and CNN2 (ie, 1.83% v 0.3%). Yet, despite the small amount of added diversity (ie, 293 reports from institutions other than MGH and BWH), CNN4 still gained 0.68% on the heldout institutions over CNN2.
While looking at the various institutions, a decrease in performance was noticeable on the MGH data as diversity in the training set increased (−0.5% in CNN2 and −1.1% in CNN4). On all the other institutions instead, performance raised proportionally to the amount of diversity introduced.
With respect to the attributes, invasive ductal carcinoma and DCIS seemed the most difficult to extract, particularly in HFH and NWH. DCIS is the major cause of performance drop on MGH reports in CNN4.
Learning Curves
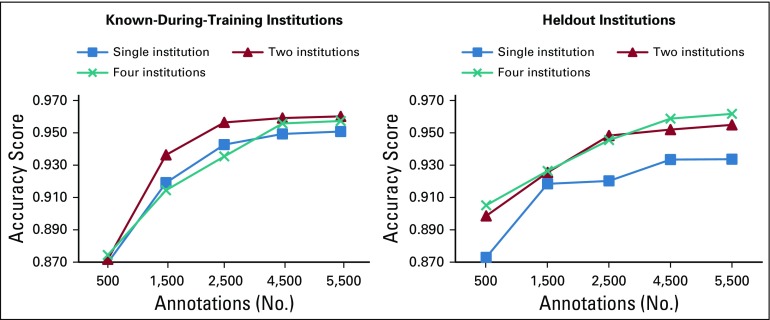
Figure 3 shows the learning curves of the three settings on both the known-during-training and the heldout institutions. When tested on known-during-training institutions, all settings achieved approximately 87% accuracy with 500 training reports. CNN2 was the best-performing setting in the entire curve, which achieved 96% when trained on 5,500 annotations. CNN4 performed the worst until it was trained on 3,000 reports. From that point on, its accuracy outperformed CNN1, almost reaching CNN2.
FIG 3.
Learning curves on data from both the known-during-training and the heldout institutions for the three settings. Accuracy scores represent the average across attributes for systems trained on 500, 1,500, 2,500, 4,500, and 5,500 annotations plus 500 annotations reserved for the validation set. The learning curve training sizes were determined a priori.
When tested on data from heldout institutions instead, CNN1 started much lower than the other two settings (ie, 87% v approximately 90%), and it never reached their accuracies. CNN2 and CNN4 instead grew regularly until achieving 96%. Of note, with more than 3,000 reports, CNN4 outperformed CNN2 on reports from new sources.
DISCUSSION
Breast pathology reports in our data set exhibited a wide variance at several levels, such as document length, average sentence length, and vocabulary diversity. This variance poses a challenge for any information extraction system.
The variance was not equally distributed across institutions. This was explained by the train versus test similarity assessment, which showed a relatively high n-gram similarity among reports from MGH, BWH, and FH and large differences with reports from NWH and HFH. Of note, the similarity scores correlate to the performance of the system on those institutions: In most settings, accuracy was higher for MGH, BWH, and FH than for NWH and HFH.
Despite the large variance, the CNN-based algorithm consistently achieved high performance across institutions (ie, always above 91.66%). CNN1, which was trained only on data from a single institution, obtained 87% accuracy already when trained on 500 reports and reached approximately 95% in known-during-training institutions and 93% in heldout institutions when 5,500 reports were used for training.
The best performances, however, were obtained by the diverse settings, namely CNN2 and CNN4. In particular, CNN2 gains 2.12% over CNN1, and CNN4 further gains 0.68% over CNN2. This is particularly interesting given that CNN4 includes only 293 reports from institutions other than MGH and BWH, which are those used by CNN2. These results are only partially explainable by the reduction in distance between training and test sets when diversity is introduced (see Table 3) because the reduction is not large. More likely, the CNN algorithm avoids overfitting specific patterns and learns instead from the diverse training reports on how to tolerate higher degrees of variance.
From the learning curves reported in Figure 3, we can observe that the majority of learning (ie, the steeper part of the curves) happens between 500 and 2,500 reports. The only setting that showed a relatively steep growth after 2,500 reports is CNN4, which suggests that more diverse settings need more data to reach higher generalization abilities. When the necessary amount of data is not available, these diverse settings perform equally or worse than the less diverse ones (ie, CNN1, CNN2). Therefore, a trade-off exists between the training size and the quantity of diversity that can be introduced in it. This trade-off needs to be carefully investigated in future studies.
To summarize, our experiments demonstrate that in information extraction, the CNN algorithm generalizes well across institutions and benefits from the introduction of multi-institutional data during training. Our findings are different from those obtained by Zech et al8 in a similar investigation carried out in the medical imaging space. In their experiments about pneumonia screening, these authors found that multi-institutional training did not help the CNNs on data from external sources. Their conclusion was more likely a result of the wide differences in pneumonia relevance between the used training institutions (ie, 34.2% and 1.2%), which may have caused the CNNs to be biased toward distributions that were not attested in the test set. In our case, attribute values have more similar distributions in the training and test institutions.
The current work has two practical implications. The first is that it is possible to develop neural information extraction systems that work efficiently in the cross-institutional setting, and the second is that there is a need for building diverse and multi-institutional training corpora, which will make neural information extraction systems more accurate and robust.
In conclusion, we have shown that a common neural NLP algorithm for information extraction from pathology reports can scale to a real-world multi-institutional scenario and be applicable to reports from previously unseen institutions, without the need of being retrained on their data. Our assessment was performed on a large data set that contained 24,881 reports from seven hospitals. Results show that the system generalizes well on reports from both known and heldout institutions. We also proved that diversity in the training data further boosts the system’s generalization ability. These findings support the construction of large and diverse data sets.
AUTHOR CONTRIBUTIONS
Conception and design: Enrico Santus, Clara Li, Adam Yala, Rong Tang, Regina Barzilay, Kevin Hughes
Administrative support: Isra Mamshad, Kevin Hughes
Provision of study material or patients: Rufina Soomro, Naveen Faridi, Isra Mamshad, Kevin Hughes
Collection and assembly of data: Clara Li, Rufina Soomro, Naveen Faridi, Isra Mamshad, Rong Tang, Conor R. Lanahan, Kevin Hughes
Data analysis and interpretation: Enrico Santus, Clara Li, Adam Yala, Donald Peck, Naveen Faridi, Rong Tang, Regina Barzilay, Kevin Hughes
Manuscript writing: All authors
Final approval of manuscript: All authors
Accountable for all aspects of the work: All authors
AUTHORS' DISCLOSURES OF POTENTIAL CONFLICTS OF INTEREST
The following represents disclosure information provided by authors of this manuscript. All relationships are considered compensated. Relationships are self-held unless noted. I = Immediate Family Member, Inst = My Institution. Relationships may not relate to the subject matter of this manuscript. For more information about ASCO's conflict of interest policy, please refer to www.asco.org/rwc or ascopubs.org/cci/author-center.
Adam Yala
Patents, Royalties, Other Intellectual Property: Several patents for my work in breast cancer risk modeling, which has no relationship with the work presented here (Inst)
Rufina Soomro
Travel, Accommodations, Expenses: Roche
Kevin Hughes
Stock and Other Ownership Interests: CRA Health (formerly Hughes RiskApps)
Honoraria: 23andMe, Hologic
No other potential conflicts of interest were reported.
REFERENCES
- 1.Yala A, Barzilay R, Salama L, et al. Using machine learning to parse breast pathology reports. Breast Cancer Res Treat. 2017;161:203–211. doi: 10.1007/s10549-016-4035-1. [DOI] [PubMed] [Google Scholar]
- 2. Li P, Huang H: Clinical information extraction via convolutional neural network. arXiv:1603.09381, 2016.
- 3.Wieneke AE, Bowles EJ, Cronkite D, et al. Validation of natural language processing to extract breast cancer pathology procedures and results. J Pathol Inform. 2015;6:38. doi: 10.4103/2153-3539.159215. [DOI] [PMC free article] [PubMed] [Google Scholar]
- 4.Buckley JM, Coopey SB, Sharko J, et al. The feasibility of using natural language processing to extract clinical information from breast pathology reports. J Pathol Inform. 2012;3:23. doi: 10.4103/2153-3539.97788. [DOI] [PMC free article] [PubMed] [Google Scholar]
- 5.Hassanpour S, Langlotz CP. Information extraction from multi-institutional radiology reports. Artif Intell Med. 2016;66:29–39. doi: 10.1016/j.artmed.2015.09.007. [DOI] [PMC free article] [PubMed] [Google Scholar]
- 6. Mikolov T, Chen K, Corrado G, et al: Efficient estimation of word representations in vector space. arXiv:1301.3781, 2013.
- 7. Kim Y: Convolutional neural networks for sentence classification. arXiv:1408.5882, 2014.
- 8. Zech JR, Badgeley MA, Liu M, et al: Variable generalization performance of a deep learning model to detect pneumonia in chest radiographs: A cross-sectional study. PLoS Med 15:e1002683, 2018. [DOI] [PMC free article] [PubMed]


