Abstract
Purpose
New response patterns to anticancer drugs have led tumor size–based response criteria to shift to also include density measurements. Choi criteria, for instance, categorize antiangiogenic therapy response as a decrease in tumor density > 15% at the portal venous phase (PVP). We studied the effect that PVP timing has on measurement of the density of liver metastases (LM) from colorectal cancer (CRC).
Methods
Pretreatment PVP computed tomography images from 291 patients with LM-CRC from the CRYSTAL trial (Cetuximab Combined With Irinotecan in First-Line Therapy for Metastatic Colorectal Cancer; ClinicalTrials.gov identifier: NCT00154102) were included. Four radiologists independently scored the scans’ timing according to a three-point scoring system: early, optimal, late PVP. Using this, we developed, by machine learning, a proprietary computer-aided quality-control algorithm to grade PVP timing. The reference standard was a computer-refined consensus. For each patient, we contoured target liver lesions and calculated their mean density.
Results
Contrast-product administration data were not recorded in the digital imaging and communications in medicine headers for injection volume (94%), type (93%), and route (76%). The PVP timing was early, optimal, and late in 52, 194, and 45 patients, respectively. The mean (95% CI) accuracy of the radiologists for detection of optimal PVP timing was 81.7% (78.3 to 85.2) and was outperformed by the 88.6% (84.8 to 92.4) computer accuracy. The mean ± standard deviation of LM-CRC density was 68 ± 15 Hounsfield units (HU) overall and 59.5 ± 14.9 HU, 71.4 ± 14.1 HU, 62.4 ± 12.5 HU at early, optimal, and late PVP timing, respectively. LM-CRC density was thus decreased at nonoptimal PVP timing by 14.8%: 16.7% at early PVP (P < .001) and 12.6% at late PVP (P < .001).
Conclusion
Nonoptimal PVP timing should be identified because it significantly decreased tumor density by 14.8%. Our computer-aided quality-control system outperformed the accuracy, reproducibility, and speed of radiologists’ visual scoring. PVP-timing scoring could improve the extraction of tumor quantitative imaging biomarkers and the monitoring of anticancer therapy efficacy at the patient and clinical trial levels.
INTRODUCTION
In clinical trials and daily routine, anticancer treatment efficacy is appraised by the measurement of treatment-induced changes in the imaging phenotype of target cancer lesions. Response Evaluation Criteria in Solid Tumors version 1.1 (RECIST 1.1) response criteria are the most widely used standards and classify patients as responders if a significant decrease in the size of up to five target lesions is observed. Treatment-induced size changes have proven robust for response category classification; lesion sampling,1 acquisition protocol,2,3 and observer4 induce < 10% variability.2-4
Researchers have suggested moving toward alternative criteria such as density-based response evaluation criteria5-8 in new agents targeting specific molecular pathways. Due to their differing mechanisms of action, treatment efficacy can be misclassified per RECIST 1.1. For instance, antiangiogenic treatments interfere with the neovascularization process necessary for the diffusion of nutrients within tumors > 2 to 3 mm. An effective antiangiogenic treatment may not translate into tumor shrinkage but rather a stable disease (ie, cytostatic effect) or trigger a pseudoprogression (ie, due to intratumor edema or hemorrhage9). Tumor density, as reflected by mean tumor attenuation on computed tomography (CT) scans was proposed, therefore, as a metric to appraise tumor vascularity. Choi criteria first categorized treatment response as a 15% treatment-induced decrease in tumor density during the portal venous phase (PVP).6-8 Then, Choi-derived clinical decision support tools were developed at the arterial phase5-7 or designed to predict outcome and recurrence,10-13 subsequently outperforming RECIST in specific indications.7,14
Colorectal cancer (CRC) is the second leading cause of cancer death and liver metastasis (LM) concerns more than half of patients with CRC.15 The assessment of systemic treatment regimen efficacy relies heavily on radiographic response end points in patients with metastatic CRC if there is a curative intention after maximal shrinkage of metastases, and if there is palliative intention.15 We evaluated patients from the CRYSTAL (Cetuximab Combined With Irinotecan in First-Line Therapy for Metastatic Colorectal Cancer) study, which showed that overall survival of patients with advanced CRC with RAS wild-type is improved by cetuximab,16-19 a chimeric monoclonal antibody that binds to and inhibits the epidermal growth factor receptor pathway (implicated in tumor progression, tumor neoangiogenesis, invasion, and metastasis).
From a broader perspective, analysis of source imaging (digital imaging and communications in medicine (DICOM) data from large randomized oncological trials such as CRYSTAL offers a rich resource for tailoring precision oncology care and research. The CRYSTAL study showed that early tumor shrinkage at 8 weeks after start of treatment was associated with an improvement in long-term outcome.20 A better understanding of treatment-induced changes in the tumor imaging phenotype (eg, tumor density) could further improve the early identification of responders to cetuximab.
Strikingly, the reproducibility of tumor density measurement remains unknown.14,21,22 The complexity and heterogeneity of the imaging dataset derived from the CRYSTAL multicenter clinical trials provided a unique opportunity to fill this knowledge gap using standard of care abdominal CT scan.
Using LM-CRC as a paradigm, we hypothesized that nonoptimal timing of the PVP contrast-CT scan acquisition might significantly alter the measurement of LM-CRC density and thus interfere with both the care of patients and the interpretation of clinical trial results. To test this hypothesis, we first proposed a three-point quality-control metric for PVP timing (early, optimal, and late: score 1, 2, and 3, respectively) and then we evaluated if the density of LM-CRCs were influenced by the PVP timing.
METHODS
Study Design Overview
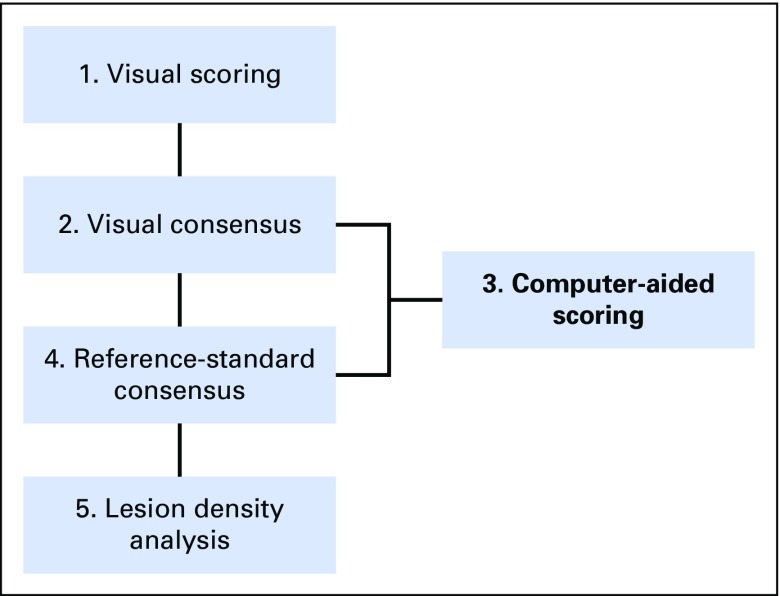
Figure 1 outlines the study workflow.
Fig 1.
Study overview. First, two pairs of experienced radiologists individually performed a visual scoring of each scan’s PVP (portal venous phase) timing based on a three-point scoring system. Any scan with differing scores was reevaluated by both radiologists and a consensus score was reached. Using these values, a computer-aided scoring algorithm of the PVP timing (CASAPVP) was developed. Potentially misclassified PVP timings were detected by the CASAPVP and referred to the radiologists for a new consensus reading. The results of this new consensus reading then served as the reference standard for grading the accuracy of visual and computer scoring methods, as well as for studying the density variation of colorectal cancer with liver metastases due to PVP timing.
Patient Image Data
Imaging data from 291 patients with LM-CRC were collected consecutively from the CRYSTAL trial (ClinicalTrials.gov identifier: NCT00154102). Patients’ treatment group information (folinic acid, fluorouracil, and irinotecan [FOLFIRI] plus cetuximab v FOLFIRI) and KRAS mutational status (mutant v wild type) were known. All patients had pretreatment contrast-enhanced CT scans acquired at the PVP and a follow-up CT scan at a mean of 8 (standard deviation [SD], ±3.6) weeks.
CT-Scan Acquisition Protocol
Standard-of-care CT-scan acquisitions were performed at the PVP after intravenous injection of a iodinated contrast-enhancement product (Table 1). The PVP acquisition used fixed delay times after contrast injection; timing was neither tailored to patient body habitus nor circulatory changes. The mean (SD) CT-imaging acquisition protocol observed was smooth reconstruction convolution Kernel, 4.9 (1.3) mm slice interval, 5.1 (1.0) mm slice thickness, 0.72 (0.09) mm pixel spacing, 788 (409) ms exposure time, 242 (99) mA, and 122 (6) kVP.
Table 1.
CT Scan Characteristics and Content of the Digital Imaging and Communications in Medicine Headers

Initial Visual Scoring
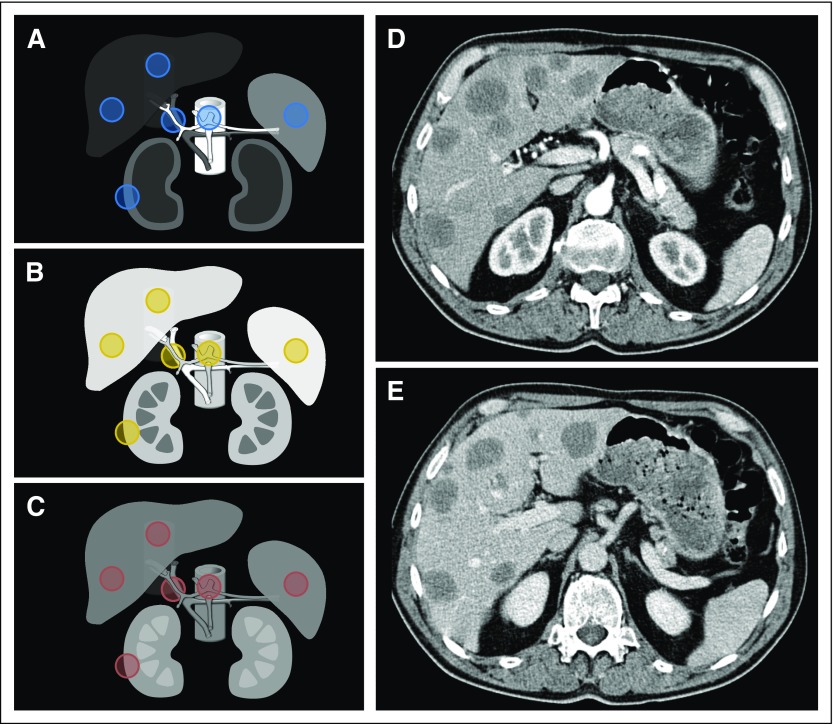
We categorized the PVP timing as early, optimal, or late (score: 1, 2, or 3, respectively). The definition was based on the relative contrast enhancement within vessels and tissues23-27 (Fig 2). Early PVP was defined by contrast still predominantly in the arterial supply as compared with the portal vein (score, 1; Fig 2A). Optimal PVP demonstrated peak enhancement of the liver parenchyma and portal vein, as well as some enhancement of the hepatic veins (score, 2; Fig 2B). Late PVP was associated with a wash out of the hepatic contrast enhancement and approached the nephrogenic phase with more enhancement of the renal medulla (score, 3; Fig 2C).
Fig 2.
PVP (portal venous phase) timing and region of interest (ROI) selection. Relative contrast enhancement of soft tissues at (A) early, (B) optimal, and (C) late PVP timing. (A–C) ROIs were delineated in normal tissues (ie, aorta, portal vein, inferior vena cava, liver, spleen, and kidney), as illustrated in the circles (excluding psoas). (D, E) All patients had computed tomography acquisition intended at PVP, although we sometimes observed significant differences in the acquisition timing between (D) baseline (early) and (E) follow-up (optimal), even within the same patient, as demonstrated by the computed tomography scans in this figure.
Initial Visual Consensus
The patient data were randomly divided between two pairs (2 × 2) of four trained radiologists. The radiologists independently read their CT scans and scored the PVP timing. If the two radiologists’ scores agreed, then the score was finalized. If the two radiologists disagreed, then a joint consensus reading was performed between both radiologists after a time interval to avoid memory bias. If the two radiologists from one pair could not reach an agreement during the consensus reading, then a third radiologist, from the other pair, was involved to reach a majority consensus for the score.
Computer-Aided Scoring Algorithm of the PVP Timing
The design of the computer-aided scoring algorithm of the PVP timing (CASAPVP) is provided in the Appendix (online only).
Reference-Standard Consensus
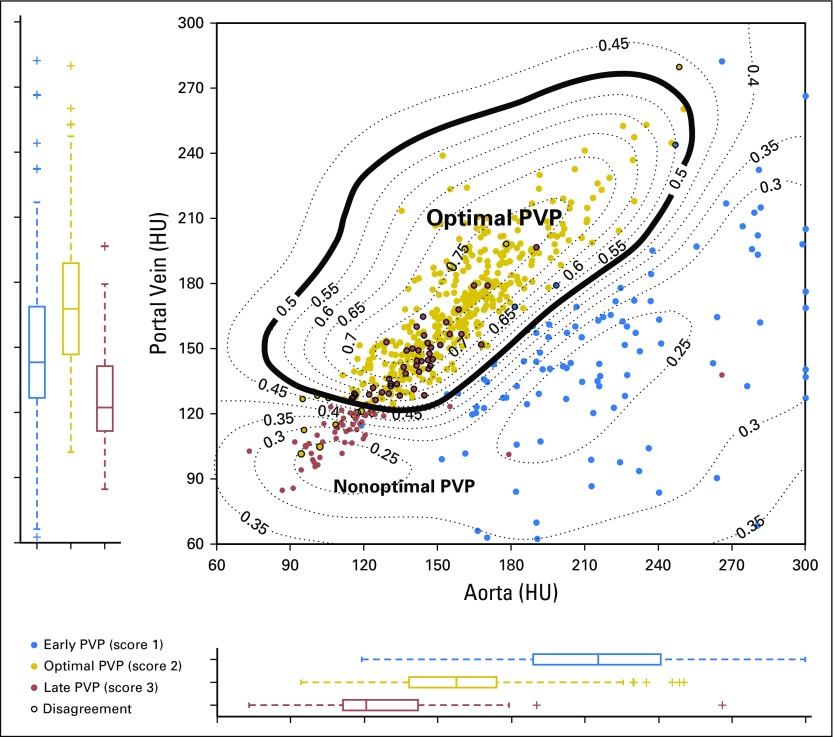
The CASAPVP output was in the form of a probability map that the PVP timing was optimal (ie, from 0 to 1); we defined optimal PVP timing by a probability > 0.5 (Fig 3). For any CASAPVP classification that differed from the initial visual consensus, a new consensus reading was performed by the radiologists to determine whether the computer’s result was incorrect. The reference-standard PVP-timing consensus for all subsequent analyses resulted from (1) a visual consensus between a pair or trio of radiologists, (2) a computer-aided detection of potentially misclassified patients, and (3) a final visual consensus by a pair or trio of radiologists for potentially misclassified patients (Fig 1).
Fig 3.
Computer-aided scoring output. Output in the form of isoprobability curves indicating the probability that PVP timing is optimal (eg, 0.5 = 50%). This study used a cutoff of 0.5 to determine optimal PVP. For comparison, cases are also color coded by their visual consensus scores (blue: early, 1; gold: optimal, 2; red: late, 3). Most of the discrepancies in both human and computer scoring were between scores 2 and 3. HU, Hounsfield unit; PVP, portal venous phase.
Accuracy of Scoring
The accuracy of the visual scoring and of CASAPVP was defined as the percentage of patients correctly classified using the reference-standard consensus as a gold standard. The CASAPVP was validated using the follow-up CT scans of the 291 patients included in our series.
Reproducibility of Scoring
The reproducibility of the three-score system was analyzed by κ statistic through the measurement of the degree of agreement between two observers.
LM-CRC Density Analysis
We studied the distribution of LM-CRC density at early, optimal, and late PVP. To this end, each patient at baseline had up to five LM-CRCs selected as target lesions per RECIST 1.1 and contoured for analysis. The mean Hounsfield unit (HU) LM-CRCs density reported here were calculated from the mean values of all delineated target-lesion volumes per patient.
Statistical Methods
The degree of agreement was analyzed with the Cohen κ coefficient. Descriptive statistics used conventional metrics: mean, SD, and 95% CIs. The 95% CI of binary variables was calculated assuming a binomial distribution. The correlation between density of regions of interest (ROIs) in different tissues in the same patient was performed using Spearman rank correlations. Univariate and multivariate linear regression analyses evaluated the association between LM-CRC density and contrast enhancement of normal tissues. Analysis of variance (ANOVA) analyses were used to compare the distribution of the ROIs density between different groups (PVP timing, KRAS mutational status, treatment arms). Student t test determined if early and late PVP timings were significantly different from optimal PVP timing. Statistical analyses were performed using Matlab 2016a (MathWorks, Natick, MA) and SPSS version 23.0 (IBM, Armonk, NY).
RESULTS
DICOM Header
Contrast-product administration data (Table 1) were mostly not recorded in the DICOM headers for the contrast-bolus injection volume (94%), the type of contrast product (93%), and the contrast-bolus route (76%).
Accuracy and Reproducibility of Visual Scoring
The Cohen κ coefficient analysis (P < .001) showed significant interobserver agreement between radiologists from pair 1 (κ = 0.50) and pair 2 (κ = 0.66), as well as the agreement between each of the four radiologists and the reference-standard consensus (κ = 0.66, 0.75, 0.76, and 0.77).
The mean (95% CI) accuracy of the four radiologists’ initial visual scoring of PVP timing (optimal v nonoptimal) was 81.7% (78.3 to 85.2). The respective accuracy of each radiologist was as follows: 72.6% (64 to 80), 82.6% (76 to 89), 82.6% (76 to 89), and 88.9% (82 to 94). There was a 78% agreement between the trained radiologists. The 22% disagreement can be broken down as follows: (1) optimal versus late: 73.2%; (2) early versus optimal: 28.3%; and (3) early versus late: 1.6%. Visual score agreement tended to increase with practice across the series (reading batches 1, 2, 3, and 4: 69.4%, 68.0%, 82.6%, and 91.7%, respectively).
Accuracy of Computer-Aided Scoring
The CASAPVP achieved an accuracy of 88.6% (95% CI, 84.8 to 92.4) compared with the reference-standard consensus and disagreed with the initial visual consensus in 63 patients (21.6%). Reevaluation of these patients led to no category change for 33 patients (11.3%), reclassification for 30 patients (10.3%), and the subsequent reference-standard consensus. We further validated the accuracy of CASAPVP in the same patient dataset at the 8-week follow-up: 87.9% (95% CI, 83.7 to 91.5).
Reference-Standard Consensus
The distribution of PVP timing (early, optimal, or late) in the 291 patients’ baseline scans was 52, 194, and 45, respectively. Overall, PVP timing was optimal in only 66.7% of CT scans.
Lesion-Density Analysis
Overall LM-CRC density distribution.
The overall mean (±SD) LM-CRC density was 68 (±15) HU at baseline.
LM-CRC density distribution at different PVP timings.
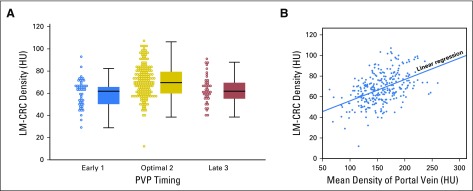
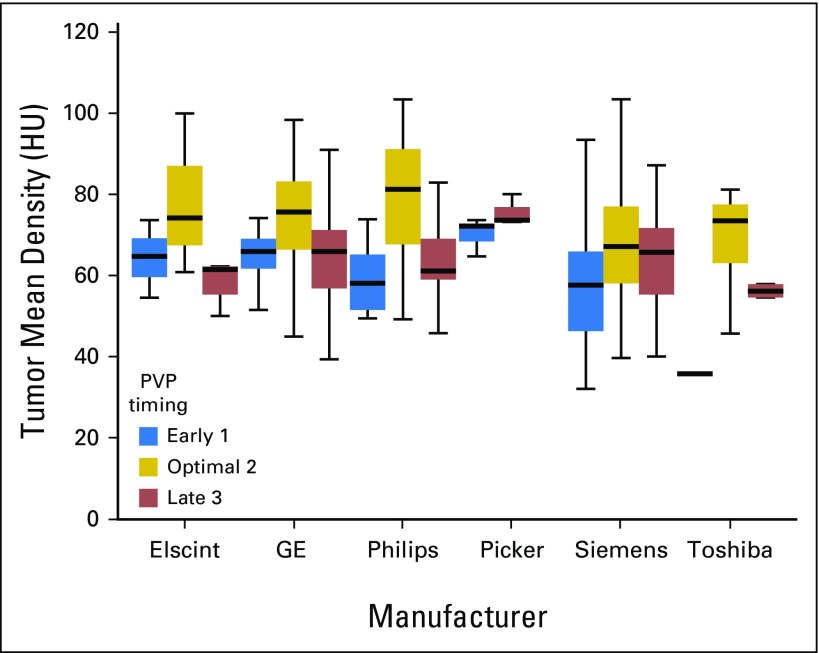
We found variability in the mean baseline LM-CRC densities at early, optimal, and late PVP timing (59.5 ± 14.9 HU, 71.4 ± 14.1 HU, and 62.4 ± 12.5 HU, respectively; Fig 4A). The overall decrease in tumor density attributable to nonoptimal PVP timing was 14.8%; early PVP and late PVP decreased tumor density significantly by 16.7% (t test P < .001) and 12.6% (P < .001), respectively. We performed a center-based analysis by pooling data using the same CT-scan manufacturers (Table 1). We validated our observations (Appendix Fig A1, online only) and showed that the tumor density was not associated with the manufacturer (ANOVA P = .17).
Fig 4.
LM-CRC density variability. (A) There was a significant decrease (P < .001) in the density of LM-CRCs at nonoptimal PVP timing (early, 1; or late, 3). (B) The density of the LM-CRC is a function of the density in the portal vein (R2 = 0.23; P < .001): A decrease of 50 HU in portal vein density triggers a 15% (10 HU) decrease in LM-CRC density. HU, Hounsfield unit; LM-CRC, colorectal cancer with liver metastases; PVP, portal venous phase.
Relationship between LM-CRC density and vasculature enhancement.
A linear regression showed that the mean LM-CRC density is a function of portal vein mean density (coefficient of determination R2 = 0.23; P < .001): LM-CRCdensity at baseline (HU) = 0.2 × PVdensity at baseline (HU) + 35. In this formula, LM-CRC density is increased by 10 HU when portal vein density is increased by 50 HU (Fig 4B). LM-CRC density was not a function of aorta mean density (R2 = 0.007; P = .17). The LM-CRC density prediction model was not considerably improved by combining the portal vein, aorta, and inferior vena cava (R2 = 0.25; P < .001).
Prediction of normal tissue density.
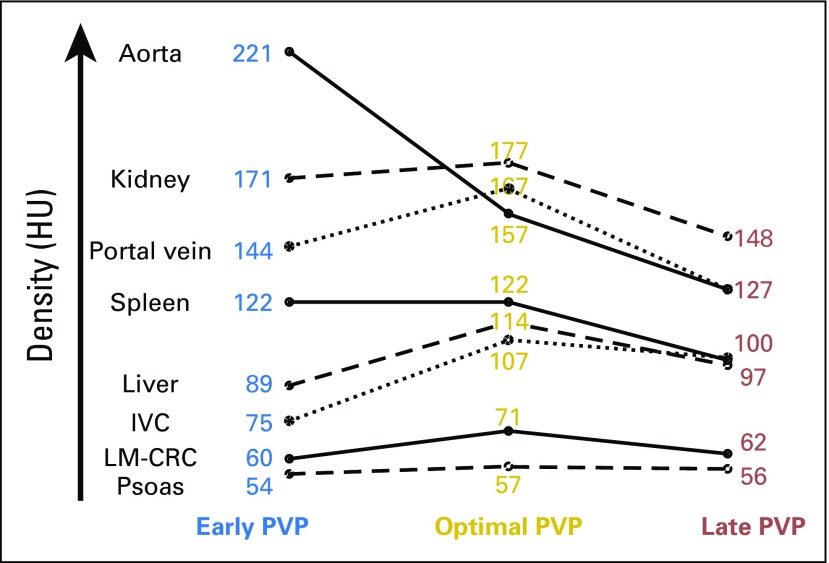
The distribution of the density of ROIs was significantly different between early versus optimal versus late PVP timing in all tissue types, including LM-CRC (ANOVA analysis P < .001). The Appendix Figure A2 (online only) shows, at baseline, the peak contrast enhancement of the vasculature, normal tissues, and cancer tissues (LM-CRC) at optimal PVP timing.
The measurement of the mean density in the portal vein allowed a good prediction of the mean density (a surrogate of contrast enhancement) of normal homogeneous tissue such as the liver (R2 = 0.48), spleen (R2 = 0.75), and kidney (R2 = 0.61) according to univariate linear regression analysis. The portal vein density was, indeed, strongly correlated (P < .001 in all cases) with the spleen, kidney, and liver density (ρ = 0.87, 0.81, and 0.69, respectively).
Treatment-Induced Changes
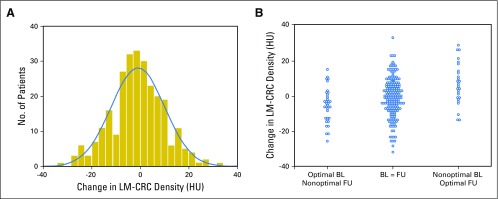
We evaluated if variability in PVP timing alters the measurement of treatment-induced changes in tumor density at 8 weeks (Fig 5). The mean treatment-induced change in tumor density was −0.9 HU (±10.9).
Fig 5.
Validation of our observations by the comparison of baseline (BL) and follow-up (FU) computed tomography scans. (A) The mean treatment-induced change in tumor density at 8 weeks was −0.9 HU. (B) The mean change in tumor density when the PVP timing was worsened, the same, or better than baseline is shown from the left to the right. The mean density change was, respectively, −8.4 HU, −2.1 HU, and +3.3 HU. These data confirm our conclusion that change in PVP timing will lead to a mimicking or masking of treatment-induced change in tumor vascularity. HU, Hounsfield unit; LM-CRC, colorectal cancer with liver metastases; PVP, portal venous phase.
First, we categorized the evolution of PVP timing from baseline to follow-up as (1) identical, (2) change from optimal to nonoptimal, or (3) change from nonoptimal to optimal. We observed that the changes in tumor density were significantly different among the three categories (ANOVA P = .001).
A multivariate linear regression analysis showed that the change in tumor density was associated with change in contrast enhancement of the portal vein (P < .001) and aorta (P < .001) rather than by treatment (P = .75) or mutational status (P = .40). Additionally, there were no significant differences between treatment groups (FOLFIRI ± cetuximab) and between KRAS mutational status (ANOVA P > .78).
DISCUSSION
New anticancer agents differ from cytotoxic therapy in terms of pattern of progression28-30 and response.31-33 Single-center trials have demonstrated that tumor density reduction is a metric of response predicting overall survival and progression-free survival. However, a clinically relevant biomarker must be reproducibly measurable. Our study showed a 14.8% variability in tumor density measurement induced by variation in PVP-acquisition timing.
A tumor’s density is a reflection of its biology and a surrogate of tumor vascularity; such a biomarker has the potential for wide-ranging application across cancer therapies. However, our data showed that nonoptimal PVP timing confounded the accurate assessment of the observed LM-CRC density through mean decrease of 14.8%. An early acquisition (leaning toward the arterial phase) decreased observed tumor density by 11.9 HU (16.7%), whereas a late acquisition (leaning toward the nephrogenic phase) decreased tumor density by 9 HU (12.6%). This is significant because it will potentially mask or mimic treatment effect by increasing or decreasing tumor density, respectively. Therefore, caution should be exercised in interpreting the significance of < 9-HU variation in LM-CRC density across the treatment sequence.
Contrast timing is crucial for liver or abdominal CT imaging. Although our results are directly applicable only to the measurement of LM-CRC, they are also likely to be observed in other organs and primary tumor types. In a single-center institution, when bolus tracking and state-of-the-art technologies are used for tightly controlled contrast acquisition, we expect our software to detect only proper optimal PVP timing. For instance, Choi criteria5-7 defined treatment response as a 15% decrease in tumor density based on observations from a single institution (n = 40 patients with 172 metastatic gastrointestinal stromal tumor lesions with mean density of 73 HU at the PVP).
In comparison, our multicenter, precision medicine clinical trial series (n = 291 patients with LM-CRC with mean tumor density of 68 HU at the PVP) found a 14.8% decrease in tumor density attributed solely to PVP timing. We subsequently showed the critical need to standardize image-acquisition protocols when tumor density is being used as a clinical decision support tool. Using both baseline and follow-up standard-of-care CT scans, we observed that optimal PVP timing was achieved in 66.7% of CT scans at baseline, and 43% of patients at two consecutive time points (ie, baseline and follow-up). Finally, we showed that DICOM headers do not give any information about the contrast-enhancement protocol in the vast majority of cases. In that context, our CASAPVP appears a relevant option to effectively analyze the quality of thousands of CT scans.
The relevant, historical, contrast-enhancement quality metric is a 60-second delay between contrast-agent product injection and image acquisitions. This was designed to ensure a satisfactory contrast enhancement at the PVP23 in normal livers34 because it was shown to be the most critical factor for LM detection.35 However, individuals’ peak hepatic enhancement timing cannot be assumed a priori, because it is associated with multiple variables such as increased volume of contrast material (higher peak) or rate of injection (delayed peak with slower injection), as well as the contrast-enhancement product itself.36 Pharmacokinetic distribution of the iodinated contrast agent is expected to be even more heterogeneous in patients with metastatic CRC, because their anthropomorphic characteristics and hemodynamic status might significantly change throughout the course of disease.
Several solutions exist to ensure optimal PVP timing. First, we should standardize image-acquisition protocols according to Quantitative Imaging Biomarkers Alliance guidelines.37 Second, the change in tumor density used to classify patients as responders (ie, a fixed 15% threshold) should take into account the eventual changes in PVP timing. Third, Choi and morphology, attenuation, size, and structure (MASS) criteria should be used with caution when the phase of contrast acquisition is nonoptimal. Finally, we proposed a computer-aided quality-assurance program.
We developed a CASAPVP that outperformed radiologists’ visual assessments of the quality of the PVP timing. As shown in Fig 3, this CASAPVP creates a probability map that can be immediately used in patient care and clinical trials to improve therapeutic response assessment and the extraction of quantitative imaging biomarkers. The CASAPVP offers several advantages for monitoring anticancer therapeutic response: (1) it is quick to implement and only requires measurement of aorta and portal vein density; (2) its accuracy and reproducibility outperform radiologists’ visual assessments; (3) its probability map is objective, easy to use, and provides the opportunity for great flexibility in future patient care and clinical trials; (4) it does not depend on liver attenuation that might be abnormally lowered by fatty liver infiltration (9% of our series demonstrated fatty liver). Specifically, certain studies or patient populations may require tighter control of optimal PVP timing, for instance, in which case a tighter cutoff of 0.7 (ie, 70% probability) may be more appropriate. Conversely, fewer scans will be excluded as outliers if a loose cutoff of 0.3 were chosen.
In the field of radiomics, our CASAPVP could be implemented in a capacity that allows for correction or normalization of the inherent timing-induced density variability, allowing for the extraction of more robust imaging metrics on CT scan.38-41 This would further improve the development of radiomic signatures associated with the identification of patients with CRC who have reduced survival,24 advanced stage,25 and the presence of lymph node metastasis.26 Additionally, it could aid in making more precise assessments of whole-tumor vascularity, a hallmark of cancer involved in treatment response,42,43 tumor invasion, metastasis, drug delivery, immune response, and prognosis.44 This is particularly important given that tumor vascularity cannot be quantified by a sole histologic marker.44
In conclusion, we have demonstrated that differential timing of PVP acquisition causes significant variability in observed tumor density. We defined a machine-learning–derived PVP-timing scoring system that outperformed radiologists’ visual assessments in terms of accuracy, reproducibility, and speed. Because optimal PVP-timing image-acquisition consistency can never be perfectly controlled by the traditional 60-second timing, because of to individual patients’ heterogeneity, this work may constitute a basis for reconsidering what qualifies as tumor response. In addition, our quality-assurance model could improve both the extraction of tumor quantitative imaging biomarkers and the monitoring of therapeutic response at the patient and clinical trial levels.
Acknowledgment
Imaging data were received from Merck.
Appendix
Computer-Aided Scoring Algorithm of the Portal Venous Phase
Based on the initial visual consensus, we developed a single time-point computer-aided scoring algorithm of the PVP timing (CASAPVP) that uses the comparison of Hounsfield unit (HU) densities among six regions of interest (ROIs) in normal tissues and vascular structures (initially seven ROIs, see below for exclusion of psoas muscle; Fig 2). Regions were chosen at the beginning of the study on the basis of what the radiologists predicted as the most robustly indicative of the three contrast scores (ie, reliably discernible enhancement between scores, nonredundant enhancement compared with other ROIs, easy to delineate without interfering anatomy). The ROIs were drawn inside the lumen of the aorta at the level of the celiac trunk, the portal trunk wherever the cross-section of lumen was greatest, the inferior vena cava below the hepatic vein, the liver, the spleen, the renal cortex, and the psoas muscle at the level of L3. Parenchyma-based ROIs were drawn with attention to include only nondiseased tissue and to exclude any vasculature.
One radiologist defined the ROIs for each patient, because the concordance correlation coefficient (CCC) of the measurements of mean density within ROIs delineated individually by two radiologists in a subset of 36 patients was > 0.96 for aorta, spleen, kidney, portal vein, inferior vena cava, and normal liver parenchyma. Ilio-psoas ROIs (CCC = 0.77) were excluded from further analysis because CCC < 0.9. Using these ROIs, all 291 baseline computed tomography scans were used to train the CASAPVP to stratified computed tomography scans into two groups: nonoptimal PVP (scores 1 and 3) versus optimal PVP (score 2) on the basis of the initial visual consensus scores. Each scan was represented through a six-dimensional digital vector based on the six ROIs’ mean densities. By using the feature forward selection approach45 and support vector machine algorithm,46 the optimal ROI’s mean densities were selected and combined to construct the final score prediction model. The performance of the prediction model was evaluated by using the area under the curve of receiver operating characteristic curves. Internal validation was done by using five-fold cross-validation45 with further validation by applying the prediction model to the 8-week follow-up data.
We found the aorta to be the most accurate sole predictor of optimal PVP timing, at 75.9% (expressing the computer accuracy as percentage agreement between the software and the reference-standard consensus). Then, using an ROI forward search (sequentially adding the ROIs that most improve predictive performance), accuracy was improved to 88.6% when the portal vein was added, 89.0% with the inferior vena cava, 89.4% with the spleen, 89.4% with the liver, and 85.9% with the kidney. The model was optimal after two ROIs (aorta plus portal vein) with only marginal improvement from the incorporation of further ROIs. Consequently, our CASAPVP was based on these two ROIs.
Fig A1.
Density variability of colorectal cancer tumors with liver metastases by computed tomography scanner manufacturer. HU, Hounsfield unit; PVP, portal venous phase.
Fig A2.
Peak contrast enhancement of soft tissues and LM-CRC is observed at optimal PVP timing. HU, Hounsfield unit; IVC, inferior vena cava; LM-CRC, colorectal cancer with liver metastases; PVP, portal venous phase.
Footnotes
Supported by National Institutes of Health Grant No. U01 CA140207 and by a grant from the Philanthropia Fundation, Geneva, Switzerland (to L.D.) and the Fondation ARC, Villejuif, France (to L.D.).
The authors are fully responsible for the content of this manuscript, and the views and opinions described in the publication reflect solely those of the authors.
AUTHOR CONTRIBUTIONS
Conception and design: Laurent Dercle, Philip Lichtenstein, Lawrence H. Schwartz, Binsheng Zhao
Financial support: Lawrence H. Schwartz, Binsheng Zhao
Administrative support: Lawrence H. Schwartz
Collection and assembly of data: Laurent Dercle, Philip Lichtenstein, Hao Yang, Feiyin Wu, Hubert Piessevaux
Data analysis and interpretation: Laurent Dercle, Lin Lu, Philip Lichtenstein, Deling Wang, Jianguo Zhu; Hubert Piessevaux, Lawrence H. Schwartz, Binsheng Zhao
Manuscript writing: All authors
Final approval of manuscript: All authors
Accountable for all aspects of the work: All authors
AUTHORS' DISCLOSURES OF POTENTIAL CONFLICTS OF INTEREST
The following represents disclosure information provided by authors of this manuscript. All relationships are considered compensated. Relationships are self-held unless noted. I = Immediate Family Member, Inst = My Institution. Relationships may not relate to the subject matter of this manuscript. For more information about ASCO's conflict of interest policy, please refer to www.asco.org/rwcorascopubs.org/jco/site/ifc.
Laurent Dercle
No relationship to disclose
Lin Lu
No relationship to disclose
Philip Lichtenstein
No relationship to disclose
Hao Yang
No relationship to disclose
Deling Wang
No relationship to disclose
Jianguo Zhu
No relationship to disclose
Feiyun Wu
No relationship to disclose
Hubert Piessevaux
Honoraria: Menarini
Lawrence H. Schwartz
Consulting or Advisory Role: Novartis, GlaxoSmithKline
Research Funding: Eli Lilly (Inst), Astellas Pharma (Inst), Merck (Inst), Pfizer (Inst)
Patents, Royalties, Other Intellectual Property: Varian Medical Systems
Binsheng Zhao
Patents, Royalties, Other Intellectual Property: Varian Medical Systems
REFERENCES
- 1.Schwartz LH, Mazumdar M, Brown W, et al. : Variability in response assessment in solid tumors: Effect of number of lesions chosen for measurement. Clin Cancer Res 9:4318-4323, 2003 [PubMed] [Google Scholar]
- 2.Oxnard GR, Zhao B, Sima CS, et al. : Variability of lung tumor measurements on repeat computed tomography scans taken within 15 minutes. J Clin Oncol 29:3114-3119, 2011 [DOI] [PMC free article] [PubMed] [Google Scholar]
- 3.Zhao B, James LP, Moskowitz CS, et al. : Evaluating variability in tumor measurements from same-day repeat CT scans of patients with non-small cell lung cancer. Radiology 252:263-272, 2009 [DOI] [PMC free article] [PubMed] [Google Scholar]
- 4.Zhao B, Tan Y, Bell DJ, et al. : Exploring intra- and inter-reader variability in uni-dimensional, bi-dimensional, and volumetric measurements of solid tumors on CT scans reconstructed at different slice intervals. Eur J Radiol 82:959-968, 2013 [DOI] [PMC free article] [PubMed] [Google Scholar]
- 5.Brufau BP, Cerqueda CS, Villalba LB, et al. : Metastatic renal cell carcinoma: Radiologic findings and assessment of response to targeted antiangiogenic therapy by using multidetector CT. Radiographics 33:1691-1716, 2013 [DOI] [PubMed] [Google Scholar]
- 6.Benjamin RS, Choi H, Macapinlac HA, et al. : We should desist using RECIST, at least in GIST. J Clin Oncol 25:1760-1764, 2007 [DOI] [PubMed] [Google Scholar]
- 7.Choi H, Charnsangavej C, Faria SC, et al. : Correlation of computed tomography and positron emission tomography in patients with metastatic gastrointestinal stromal tumor treated at a single institution with imatinib mesylate: Proposal of new computed tomography response criteria. J Clin Oncol 25:1753-1759, 2007 [DOI] [PubMed] [Google Scholar]
- 8.Choi H, Charnsangavej C, de Castro Faria S, et al. : CT evaluation of the response of gastrointestinal stromal tumors after imatinib mesylate treatment: A quantitative analysis correlated with FDG PET findings. AJR Am J Roentgenol 183:1619-1628, 2004 [DOI] [PubMed] [Google Scholar]
- 9.Shinagare AB, Jagannathan JP, Krajewski KM, et al. : Liver metastases in the era of molecular targeted therapy: New faces of treatment response. AJR Am J Roentgenol 201:W15-W28, 2013 [DOI] [PubMed] [Google Scholar]
- 10.Smith AD, Shah SN, Rini BI, et al. : Morphology, attenuation, size, and structure (MASS) criteria: Assessing response and predicting clinical outcome in metastatic renal cell carcinoma on antiangiogenic targeted therapy. AJR Am J Roentgenol 194:1470-1478, 2010 [DOI] [PubMed] [Google Scholar]
- 11.Smith AD, Lieber ML, Shah SN: Assessing tumor response and detecting recurrence in metastatic renal cell carcinoma on targeted therapy: Importance of size and attenuation on contrast-enhanced CT. AJR Am J Roentgenol 194:157-165, 2010 [DOI] [PubMed] [Google Scholar]
- 12.Krajewski KM, Guo M, Van den Abbeele AD, et al. : Comparison of four early posttherapy imaging changes (EPTIC; RECIST 1.0, tumor shrinkage, computed tomography tumor density, Choi criteria) in assessing outcome to vascular endothelial growth factor-targeted therapy in patients with advanced renal cell carcinoma. Eur Urol 59:856-862, 2011 [DOI] [PubMed] [Google Scholar]
- 13.Ammari S, Thiam R, Cuenod CA, et al. : Radiological evaluation of response to treatment: Application to metastatic renal cancers receiving anti-angiogenic treatment. Diagn Interv Imaging 95:527-539, 2014 [DOI] [PubMed] [Google Scholar]
- 14.van der Veldt AA, Meijerink MR, van den Eertwegh AJ, et al. : Choi response criteria for early prediction of clinical outcome in patients with metastatic renal cell cancer treated with sunitinib. Br J Cancer 102:803-809, 2010 [DOI] [PMC free article] [PubMed] [Google Scholar]
- 15.Van Cutsem E, Cervantes A, Nordlinger B, et al. : Metastatic colorectal cancer: ESMO Clinical Practice Guidelines for diagnosis, treatment and follow-up. Ann Oncol 25(Suppl 3):iii1-iii9, 2014 [DOI] [PubMed] [Google Scholar]
- 16.Van Cutsem E, Köhne CH, Hitre E, et al. : Cetuximab and chemotherapy as initial treatment for metastatic colorectal cancer. N Engl J Med 360:1408-1417, 2009 [DOI] [PubMed] [Google Scholar]
- 17.Karapetis CS, Khambata-Ford S, Jonker DJ, et al. : K-ras mutations and benefit from cetuximab in advanced colorectal cancer. N Engl J Med 359:1757-1765, 2008 [DOI] [PubMed] [Google Scholar]
- 18.Van Cutsem E, Lenz HJ, Köhne CH, et al. : Fluorouracil, leucovorin, and irinotecan plus cetuximab treatment and RAS mutations in colorectal cancer. J Clin Oncol 33:692-700, 2015 [DOI] [PubMed] [Google Scholar]
- 19.Van Cutsem E, Köhne CH, Láng I, et al. : Cetuximab plus irinotecan, fluorouracil, and leucovorin as first-line treatment for metastatic colorectal cancer: Updated analysis of overall survival according to tumor KRAS and BRAF mutation status. J Clin Oncol 29:2011-2019, 2011 [DOI] [PubMed] [Google Scholar]
- 20.Piessevaux H, Buyse M, Schlichting M, et al. : Use of early tumor shrinkage to predict long-term outcome in metastatic colorectal cancer treated with cetuximab. J Clin Oncol 31:3764-3775, 2013 [DOI] [PubMed] [Google Scholar]
- 21.Ljungberg B, Cowan NC, Hanbury DC, et al. : EAU guidelines on renal cell carcinoma: The 2010 update. Eur Urol 58:398-406, 2010 [DOI] [PubMed] [Google Scholar]
- 22.Ljungberg B, Bensalah K, Canfield S, et al. : EAU guidelines on renal cell carcinoma: 2014 Update. Eur Urol 67:913-924, 2015 [DOI] [PubMed] [Google Scholar]
- 23.Soyer P, Poccard M, Boudiaf M, et al. : Detection of hypovascular hepatic metastases at triple-phase helical CT: Sensitivity of phases and comparison with surgical and histopathologic findings. Radiology 231:413-420, 2004 [DOI] [PubMed] [Google Scholar]
- 24.Ganeshan B, Miles KA, Young RC, et al. : Hepatic enhancement in colorectal cancer: Texture analysis correlates with hepatic hemodynamics and patient survival. Acad Radiol 14:1520-1530, 2007 [DOI] [PubMed] [Google Scholar]
- 25.Liang C, Huang Y, He L, et al. : The development and validation of a CT-based radiomics signature for the preoperative discrimination of stage I-II and stage III-IV colorectal cancer. Oncotarget 7:31401-31412, 2016 [DOI] [PMC free article] [PubMed] [Google Scholar]
- 26.Huang YQ, Liang CH, He L, et al. : Development and validation of a radiomics nomogram for preoperative prediction of lymph node metastasis in colorectal cancer. J Clin Oncol 34:2157-2164, 2016 [DOI] [PubMed] [Google Scholar]
- 27.Silverman PM, Brown B, Wray H, et al. : Optimal contrast enhancement of the liver using helical (spiral) CT: Value of SmartPrep. AJR Am J Roentgenol 164:1169-1171, 1995 [DOI] [PubMed] [Google Scholar]
- 28.Dercle L, Seban RD, Lazarovici J, et al. : (18)F-FDG PET and CT-scan detect new imaging patterns of response and progression in patients with Hodgkin lymphoma treated by anti-PD1 immune checkpoint inhibitor. J Nucl Med [epub ahead of print on June 8, 2017] [DOI] [PubMed] [Google Scholar]
- 29.Champiat S, Dercle L, Ammari S, et al. : Hyperprogressive disease is a new pattern of progression in cancer patients treated by anti-PD-1/PD-L1. Clin Cancer Res 23:1920-1928, 2017 [DOI] [PubMed] [Google Scholar]
- 30.Chiou VL, Burotto M: Pseudoprogression and immune-related response in solid tumors. J Clin Oncol 33:3541-3543, 2015 [DOI] [PMC free article] [PubMed] [Google Scholar]
- 31.Michot JM, Mazeron R, Dercle L, et al. : Abscopal effect in a Hodgkin lymphoma patient treated by an anti-programmed death 1 antibody. Eur J Cancer 66:91-94, 2016 [DOI] [PubMed] [Google Scholar]
- 32.Dercle L, Chisin R, Ammari S, et al. : Nonsurgical giant cell tumour of the tendon sheath or of the diffuse type: Are MRI or 18F-FDG PET/CT able to provide an accurate prediction of long-term outcome? Eur J Nucl Med Mol Imaging 42:397-408, 2015 [DOI] [PubMed] [Google Scholar]
- 33.Seymour L, Bogaerts J, Perrone A, et al. : iRECIST: Guidelines for response criteria for use in trials testing immunotherapeutics. Lancet Oncol 18:e143-e152, 2017 [DOI] [PMC free article] [PubMed] [Google Scholar]
- 34.Leggett DA, Kelley BB, Bunce IH, et al. : Colorectal cancer: Diagnostic potential of CT measurements of hepatic perfusion and implications for contrast enhancement protocols. Radiology 205:716-720, 1997 [DOI] [PubMed] [Google Scholar]
- 35.Tirumani SH, Kim KW, Nishino M, et al. : Update on the role of imaging in management of metastatic colorectal cancer. Radiographics 34:1908-1928, 2014 [DOI] [PMC free article] [PubMed] [Google Scholar]
- 36.Heiken JP, Brink JA, McClennan BL, et al. : Dynamic contrast-enhanced CT of the liver: comparison of contrast medium injection rates and uniphasic and biphasic injection protocols. Radiology 187:327-331, 1993 [DOI] [PubMed] [Google Scholar]
- 37.Radiological Society of North America . Quantitative imaging biomarkers alliance (QIBA). www.rsna.org/QIBA
- 38.Zhao B, Tan Y, Tsai WY, et al. : Reproducibility of radiomics for deciphering tumor phenotype with imaging. Sci Rep 6:23428, 2016 [DOI] [PMC free article] [PubMed] [Google Scholar]
- 39.Dercle L, Ammari S, Bateson M, et al. : Limits of radiomic-based entropy as a surrogate of tumor heterogeneity: ROI-area, acquisition protocol and tissue site exert substantial influence. Sci Rep 7:7952, 2017 [DOI] [PMC free article] [PubMed] [Google Scholar]
- 40.Limkin EJ, Sun R, Dercle L, et al. : Promises and challenges for the implementation of computational medical imaging (radiomics) in oncology. Ann Oncol 28:1191-1206, 2017 [DOI] [PubMed] [Google Scholar]
- 41.Dercle L, Ammari S, Champiat S, et al. : Rapid and objective CT scan prognostic scoring identifies metastatic patients with long-term clinical benefit on anti-PD-1/-L1 therapy. Eur J Cancer 65:33-42, 2016 [DOI] [PubMed] [Google Scholar]
- 42.Sahani DV, Kalva SP, Hamberg LM, et al. : Assessing tumor perfusion and treatment response in rectal cancer with multisection CT: Initial observations. Radiology 234:785-792, 2005 [DOI] [PubMed] [Google Scholar]
- 43.Bellomi M, Petralia G, Sonzogni A, et al. : CT perfusion for the monitoring of neoadjuvant chemotherapy and radiation therapy in rectal carcinoma: Initial experience. Radiology 244:486-493, 2007 [DOI] [PubMed] [Google Scholar]
- 44.Li ZP, Meng QF, Sun CH, et al. : Tumor angiogenesis and dynamic CT in colorectal carcinoma: Radiologic-pathologic correlation. World J Gastroenterol 11:1287-1291, 2005 [DOI] [PMC free article] [PubMed] [Google Scholar]
- 45.Russel S, Norvig P: Artificial Intelligence: A Modern Approach. Upper Saddle River, NJ, Prentice Hall, 2003 [Google Scholar]
- 46.Cortes C, Vapnik V: Support-vector networks. Machine Learning 20:273-297, 1995 [Google Scholar]


