Abstract
Splenomegaly segmentation on computed tomography (CT) abdomen anatomical scans is essential for identifying spleen biomarkers and has applications for quantitative assessment in patients with liver and spleen disease. Deep convolutional neural network automated segmentation has shown promising performance for splenomegaly segmentation. However, manual labeling of abdominal structures is resource intensive, so the labeled abdominal imaging data are rare resources despite their essential role in algorithm training. Hence, the number of annotated labels (e.g., spleen only) are typically limited with a single study. However, with the development of data sharing techniques, more and more publicly available labeled cohorts are available from different resources. A key new challenging is to co-learn from the multi-source data, even with different numbers of labeled abdominal organs in each study. Thus, it is appealing to design a co-learning strategy to train a deep network from heterogeneously labeled scans. In this paper, we propose a new deep convolutional neural network (DCNN) based method that integrates heterogeneous multi-resource labeled cohorts for splenomegaly segmentation. To enable the proposed approach, a novel loss function is introduced based on the Dice similarity coefficient to adaptively learn multi-organ information from different resources. Three cohorts were employed in our experiments, the first cohort (98 CT scans) has only splenomegaly labels, while the second training cohort (100 CT scans) has 15 distinct anatomical labels with normal spleens. A separate, independent cohort consisting of 19 splenomegaly CT scans with labeled spleen was used as testing cohort. The proposed method achieved the highest median Dice similarity coefficient value (0.94), which is superior (p-value<0.01 against each other method) to the baselines of multi-atlas segmentation (0.86), SS-Net segmentation with only spleen labels (0.90) and U-Net segmentation with multi-organ training (0.91). Our approach for adapting the loss function and training structure is not specific to the abdominal context and may be beneficial in other situations where datasets with varied label sets are available.
Keywords: spleen segmentation, computed tomography, deep convolutional neural networks, multi-organ segmentation, weakly supervised learning
1. INTRODUCTION
Splenomegaly, the enlargement of spleen, is an essential marker for liver disease [1], cancer [2] and infection [3]. Spleen segmentation with computed tomography (CT), and magnetic resonance imaging (MRI) is critical for clinical and scientific research. With different levels of red blood cell destruction and inflation, spleen radiographies have high variance. Manually annotated clinical slices are resource intensive and time consuming, which are not suitable for large scale studies. To reduce the effort of radiologists as well as to improve efficiency in practical use, several algorithms have been designed for automatic splenomegaly segmentation [4–7].
Briefly, multi-atlas segmentation (MAS) using context learning based estimation framework was proposed [7] to achieve promising segmentation result using semi-automated iterative method for obtaining probability maps of spleen. Another direction of methods is neural network-based prediction of the segmentation map, which sought to seek higher accuracy with deeper networks and more efficient loss functions. The learning-based endeavors achieved encouraging performance on consistent datasets. In recent years, UNet [8], Global Convolutional Network (GCN) [9], splenomegaly segmentation network (SS-Net) [6] achieved reasonable performance in spleen segmentation tasks. Historically, these methods have been shown efficient on normal spleen cases and with images are scanned in single research protocol. One key benefit for consistent data is that it is easier for networks to learn feature patterns.
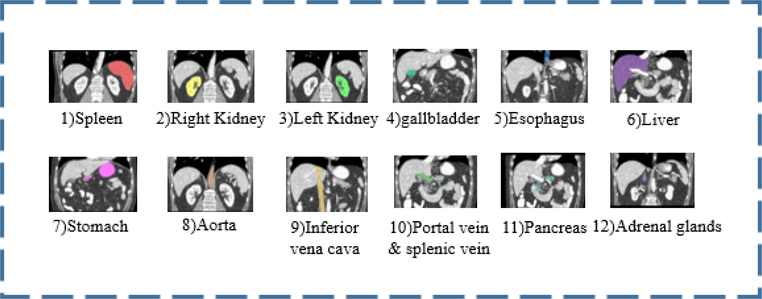
In this paper, we propose a convolutional-based image to image network for unevenly labeled images. The target dataset contains 100 normal (15 labels) and 117 splenomegaly (1 label) cases (which is split into 98 cases for training and 19 withheld cases for testing). A novel loss function, called Multi-Sourced Dice Loss, is proposed to incorporate the multi-resource training cohorts with different number of manually annotated labels. Figure 2 illustrates organs in which we are interested.
Figure 2.
Twelve anatomies of interest above and 2 extra body-bone segmented maps. Labels are selected corresponding to the tag of certain slice.
2. METHOD
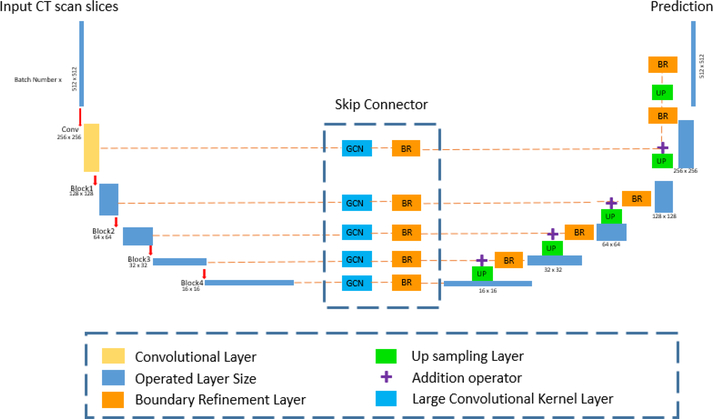
In this paper, we propose the Multi-Sourced Dice Loss along with large kernel splenomegaly segmentation network (SSnet), which is presented in Figure 3 and Figure 4. Additionally, we present a multi-organ segmentation pipeline for improving the accuracy of splenomegaly, which used all available annotated information.
Figure 3.
This network figure shows the whole pipeline of learning process. The input image will be 512×512 before being feed into the network. The left side is the encoder formed by convolutional layer and Resnet-50 blocks. The middle section is the Skip-Connector with GCN followed by Boundary Refinement (BR) layer. The right side is the decoder consisting of up-sampling and BR layers.
Figure 4.
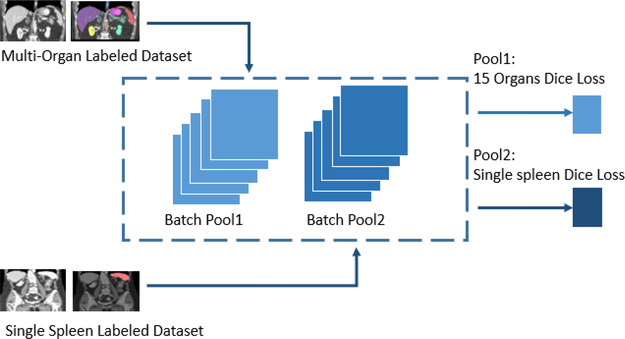
Tensor pool for unbalanced data and multi-sourced Dice loss architecture.
2.1. Preprocessing
The intensities of each CT abdomen volumes were normalized to −1 to 1 scale, which contains 300–600 2D slices to feed the proposed 2D network. We set a threshold filtered the 0.25% above minimal and 0.25% below maximal intensity values for excluding imaging outliers. Then, we resample and resize every slice to 512×512 using bilinear interpolation method. For labels, we obtain the body and bone segmentation following [10] which is a non-parametric method for classification and regression. To improve performance, we augment the acquired data with the automated body and bone segmentation masks.
2.2. Network
The network architecture presented in Figure 3 follows our previous efforts [6]. The framework contains 1) encoder by resnet50 [9], 2) skip connector, 3) decoder, and 4) tensor pool for uneven datasets.
Encoder:
The path follows a convolution layer and four ResNet-50 blocks. We use three same channels to simulate the RGB images.
Skip Connector:
The GCN based network contains a 2D convolutional layer with large size kernels and variant channels are involved. The GCN connector are showed as GCN in Fig. and table.
Decoder:
The up-sampling path of the network is bilinearly up sampled feature maps from previous layer and from skip connector. The Boundary Refinement layer are added before each skip connector and up sampled feature maps.
Tensor Pool:
The tensor pool (Figure 4) operates on top of the core network architecture (Figure 3, Table 1) to divide the training data into batches based on the available labels.
Table 1.
The network details of each part of SSNet used in the experiment.
| Convolutional Layer | Input Channel=3, Output Channel=64, Stride=2. Padding=3 BatchNorm2D ReLU() MaxPooling(Stride=2, padding=1, dilation=1) |
| ResNet50 Block1 | Bottleneck (64, 256) |
| ResNet50 Block2 | Bottleneck (256, 512) |
| ResNet50 Block3 | Bottleneck (512, 1024) |
| ResNet50 Block4 | Bottleneck (1024, 2048) |
| Boundary Refinement Layer | BatchNorm2D () ReLU () Conv2d (Input Channel=2, Output Channel=2, Stride=1, Padding=1) |
| Up-Sampling | Bilinear Decoder |
| GCN Connector | Conv2d (Kernel Size=7, Stride=1, Padding=3) |
2.3. Loss Functions for multi-sourced data
A new tensor pooling method was introduced for co-training on different numbers of manually labeled organs. Briefly, the image pools were used for the different two classes of labeled data: one for subjects labeled with only spleen labels and body-bone maps, and a second for datasets labeled with 13 anatomies and body-bone maps. The tensor pool architecture assembled separated datasets into two stacked pools. In the first pool, we push only spleen Dice loss in the back propagation step, while in the second tensor pool, we push all 15 anatomies through average Dice loss in backprop and optimization process. Then, the proposed Multi-Sourced Dice Loss was performed on the batches from the tensor pooling mechanism. We performed the Multi-Sourced Dice Loss with batch size 10, the batch level calculation can exclude the outliers of some slices without spleen.
To efficiently incorporate the loss function, we set each slice a tag to mark which annotated organs it includes. Then, we calculate the corresponding number of channels in Dice loss and Dice coefficients. During training, small anatomies like esophagus and small veins are hard to recognized with limited label data in real practice, thus tagging each slice with valid number of anatomies will give the loss more accurate influence.
Dice Loss (DL):
where R is the voxel values and P is the segmentation predicted probability map. ∈ ensures the stability of the loss function. Hence, ∈ was used in computing the prediction and voxel value correlation. The Dice Loss function was iteratively optimized using Adam optimization [11].
Multi-Sourced Dice Loss (MSDL):
Multi-Sourced Dice Loss was proposed as a way of evaluating datasets with varying labels with a single score. We proposed the loss function for neural networking training, the function takes the form:
where A denotes the number of anatomies and w represents the variance to different label set properties. In our experiments, we adopted 2 anatomies and 15 anatomies. The contribution of each label is annotated by the tag we set. This loss can be expanded to more classes.
3. DATA AND EXPERIMENTS
3.1. Data and platform
100 whole abdominal CT volumes from subjects with normal spleens were used as the first part of the experiment. The volume size and modality of each people is normal (from 140 cc to 500 cc) and labeled by all 15 anatomies. 117 splenomegaly CT scans were used as the second part of the training. These volumes have large variance of modality, shape and size, which spleen size varies from 143 cubic centimeter (cc) to 3045 cc. The splenomegaly cases were only segmented with single spleen label. We used all 100 normal and randomly picked 90 percent of splenomegaly cases for training while 10 percent of splenomegaly data for validation and 19 special splenomegaly patients for testing. In preprocessing, we randomly cropped and scaled each slice to 512×512 before training. The in-plane resolution ranged from 0.59 × 0.59 mm2 to 0.98 × 0.98 mm2.
3.2. Experiment Design
We compared the following four methods:
3.2.1. Multi-atlas Segmentation
The multi-atlas segmentation experiment was performed as the baseline to show the state-of-the-art result for CT splenomegaly segmentation [7]. Briefly, the atlas was first registered to the image then select the certain atlas using expectation-maximization (EM) based method. Next, several atlas were fused to one segmentation map. Final, a graph cut method was used for post-processing.
3.2.2. SSNet Single Spleen
The proposed SSNet [6] was used for training with all single spleen label on entirely 216 cases. The network remained the same as we performed on multi-sourced label. We set the learning rate =0.0001, all parameters were set as originally published. Traditional Dice loss (DL) was used. Segmentation maps were obtained by single channel output.
3.2.3. UNet Multi-Sourced Labels
UNet is a CNN architecture for fast and precise segmentation of images [8]. We adapted the original UNet to use the Multi-Sourced Dice Loss (MSDL). Training was stopped at 50 epochs based on the internal validation cohort (10%).
3.2.4. SSNet Multi-Sourced Labels
The primary contribution of this paper was MSDL as evaluated with SSNet. Training was stopped at 50 epochs based on the internal validation cohort (10%).
4. RESULTS
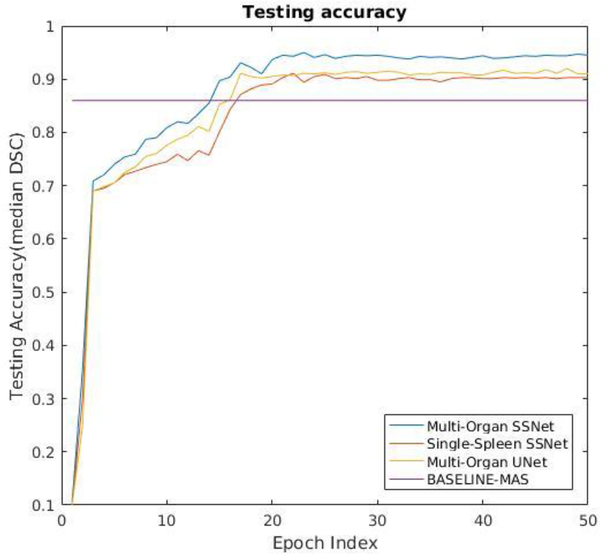
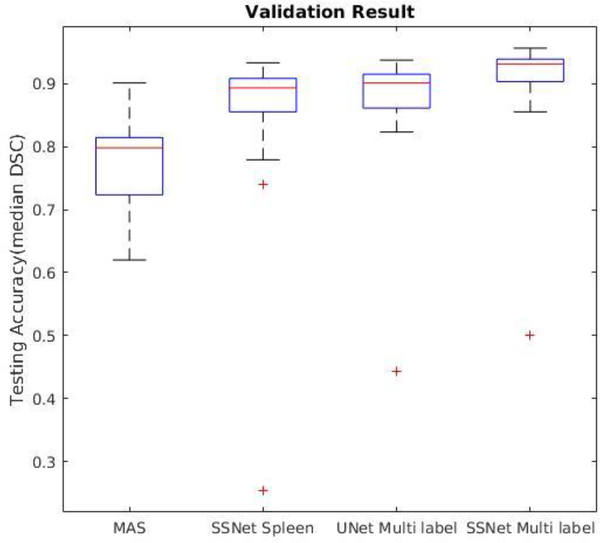
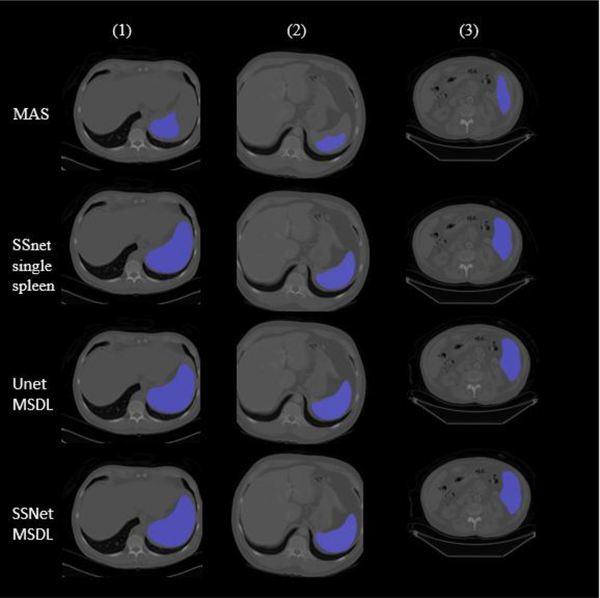
Figure 5 presents the testing accuracy on the withheld dataset as evaluated as a function of training epoch. Note that performance is essentially constant after 30 epochs, which is consistent with the observed performance on the internal validation 10% (i.e., the non-withheld data, not shown). For the remainder of consideration, we characterize the models at 50 epochs. Figure 6 and Table 2 present the Dice loss of each method on the 19 withheld datasets. Based on a paired Wilcox signed rank test, the SSNet Multi Labels were superior to MAS (p<0.001), SSNet spleen (p<0.001) and UNet Multi Labels (p<0.01). In terms of computational performance, SSNet had 30% less training time than SSNet Multi Labels, while UNet trained 20% faster than SSNet Multi Labels. Figure 7 presents qualitative results.
Figure 5.
Testing accuracy as a function of training epoch on 19 withheld datasets on four presented methods
Figure 6.
Dice similarity coefficient of 19 withheld datasets on four methods.
Table 2.
Median and mean Dice similarity coefficients of testing scores on the withheld dataset.
| Methods | MAS | SSNet spleen | UNet Multi Labels | SSNet Multi Labels |
|---|---|---|---|---|
| DSC (median) | 0.860 | 0.903 | 0.910 | 0.945 |
| DSC (mean) | 0.855 ± 0.07 | 0.884 ± 0.04 | 0.894 ± 0.04 | 0.921 ± 0.03 |
Figure 7.
Three cases of Four methods’ segmentation result with MAS failure, CNN with MSDL better than single spleen result.
5. CONCLUSION
The proposed MSDL integrates unbalanced data and differently labeled sets to create an effective spleen segmentation method. When integrated with either UNet or SSnet, the MSDL method yields improved performance over the state of the art SSnet. The loss function is not specific to spleen segmentation or the underlying segmentation works. Hence, MSDL could be adapted for other tasks. In particular, generalization to 3D networks would be of interest.
Figure 1.
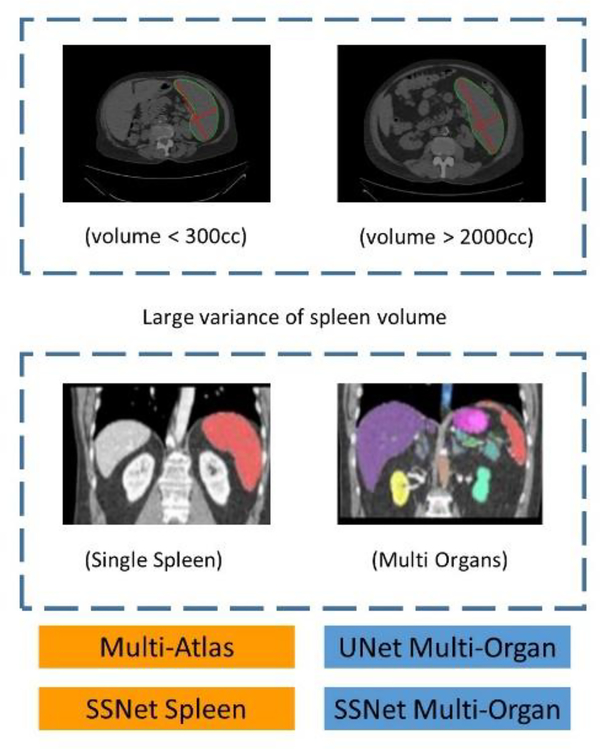
Spleen size and Multi-Sourced labeled datasets. Volume varies form 140 cc to 3500 cc. Top left: Small and normal spleen volume smaller than 300 cc. Top right: Larger splenomegaly cases larger 2000 cc. Bottom left: Single spleen labeled dataset. Bottom right: Multi-sourced labeled dataset.
6. ACKNOWLEDGEMENTS
This research was supported by NSF CAREER 1452485, NIH grants, 1R21NS064534, 2R01EB006136 (Dawant), 1R01EB017230 (Landman), and R01NS095291 (Dawant), InCyte Corporation (Abramson/Landman). This research was conducted with the support from Intramural Research Program, National Institute on Aging, NIH. This study was in part using the resources of the Advanced Computing Center for Research and Education (ACCRE) at Vanderbilt University, Nashville, TN. This project was supported in part by ViSE/VICTR VR3029 and the National Center for Research Resources, Grant UL1 RR024975-01, and is now at the National Center for Advancing Translational Sciences, Grant 2 UL1 TR000445-06. We gratefully acknowledge the support of NVIDIA Corporation with the donation of the Titan X Pascal GPU used for this research. The imaging dataset(s) used for the analysis described were obtained from ImageVU, a research resource supported by the VICTR CTSA award (ULTR000445 from NCATS/NIH), Vanderbilt University Medical Center institutional funding and Patient-Centered Outcomes Research Institute (PCORI; contract CDRN-1306-04869).
7. REFERENCES
- [1].McCormick PA, and Murphy KM, “Splenomegaly, hypersplenism and coagulation abnormalities in liver disease,” Baillieres Best Pract Res Clin Gastroenterol, 14(6), 1009–31 (2000). [DOI] [PubMed] [Google Scholar]
- [2].Klein B, Stein M, Kuten A et al. , “Splenomegaly and solitary spleen metastasis in solid tumors,” Cancer, 60(1), 100–2 (1987). [DOI] [PubMed] [Google Scholar]
- [3].Woodruff AW, “Mechanisms involved in anaemia associated with infection and splenomegaly in the tropics,” Trans R Soc Trop Med Hyg, 67(3), 313–28 (1973). [DOI] [PubMed] [Google Scholar]
- [4].Huo Y, Liu J, Xu Z et al. , “Robust Multi-contrast MRI Spleen Segmentation for Splenomegaly using Multi-atlas Segmentation,” IEEE Transactions on Biomedical Engineering, (2017). [DOI] [PMC free article] [PubMed] [Google Scholar]
- [5].Huo Y, Xu Z, Bao S et al. , “Adversarial Synthesis Learning Enables Segmentation Without Target Modality Ground Truth,” arXiv preprint arXiv:1712.07695, (2017). [Google Scholar]
- [6].Huo Y, Xu Z, Bao S et al. , “Splenomegaly Segmentation using Global Convolutional Kernels and Conditional Generative Adversarial Networks,” arXiv preprint arXiv:1712.00542, (2017). [DOI] [PMC free article] [PubMed] [Google Scholar]
- [7].Liu J, Huo Y, Xu Z et al. , “Multi-atlas spleen segmentation on CT using adaptive context learning.” 10133, 1013309. [DOI] [PMC free article] [PubMed] [Google Scholar]
- [8].Ronneberger O, Fischer P, and Brox T, “U-net: Convolutional networks for biomedical image segmentation.” 234–241. [Google Scholar]
- [9].Peng C, Zhang X, Yu G et al. , “Large Kernel Matters--Improve Semantic Segmentation by Global Convolutional Network,” arXiv preprint arXiv:1703.02719, (2017). [Google Scholar]
- [10].Xu Z, Burke RP, Lee CP et al. , “Efficient multi-atlas abdominal segmentation on clinically acquired CT with SIMPLE context learning,” Medical image analysis, 24(1), 18–27 (2015). [DOI] [PMC free article] [PubMed] [Google Scholar]
- [11].Kingma DP, and Ba J, “Adam: A method for stochastic optimization,” arXiv preprint arXiv:1412.6980, (2014). [Google Scholar]


