Abstract
Cells directly interact with the extracellular matrix (ECM) in their microenvironment; however, the mechanical properties of the networks at this scale are not well defined. This work describes a method to quantify ECM network strain in situ after the application of a known load. Visualization of the ECM in the native 3D organization is facilitated using murine embryos and a novel decellularization method. During embryonic development, the ECM architecture is less dense making it easier to visualize and manipulate. Briefly, embryonic day (E)14.5 forelimbs were harvested and incubated in an acrylamide-based hydrogel mixture to maintain the 3D architecture of the ECM during decellularization. After decellularization, forelimbs were stained for fibrillin-2 and proteoglycans to visualize different networks. Samples were imaged, before and after the application of a static load, using confocal microscopy. A MATLAB-based fast iterative digital volume correlation algorithm was used to quantify network displacement fields by comparing the reference and compressed z-stacks. We observed that the amount of Green-Lagrange strain experienced by different proteins was dependent on whether the sub-region analyzed was located within cartilage or the adjacent connective tissue. The combination of these experimental and computational methods will enable the development of constitutive equations that describe the material behavior of ECM networks. In the future, this information has the potential to improve the fabrication of physiologically relevant scaffolds by establishing mechanical guidelines for microenvironments that support beneficial cell-ECM interactions.
Keywords: Extracellular matrix, digital volume correlation, fibril, deformation, strain
Introduction
The evolution of the extracellular matrix (ECM) enabled the advent of multicellular organisms and plays a large role in defining the mechanical properties of biological tissues [1]. The proteins, proteoglycans and glycosaminoglycans that constitute the ECM are arranged into higher-level structures through a combination of self-assembly into fibrils or networks and cell-mediated organization. The local composition and architecture depends on the biomechanical requirements of the tissue of interest [2]. Conversely, ECM stiffness and composition combine to influence cellular behaviors including migration [3], proliferation [3], durotaxis [4], and differentiation [5]. To decipher how cues from the extracellular environment regulate intracellular mechanisms that direct specific behaviors, hydrogels assembled in vitro have been used as experimental test beds [6]. Typically, these hydrogels are made out of artificial polymers or a single ECM component that likely do not recapitulate the mechanical properties of native ECM networks. Unfortunately, the precise mechanical properties that these hydrogels should emulate remain unclear.
The mechanical response of the ECM is easily measured at molecular and macroscopic scales; however, the material properties at the network/fibrillar (mesoscopic) level are not well defined. This can be attributed to the relative insolubility of ECM networks, which precludes the extraction of intact fibrils for mechanical testing. Researchers circumvent this problem by either generating fibrils in vitro [7,8], or isolating single fibrils from the native environment [9,10]; however, these methods come with a number of constraints. Without cells and accessory ECM molecules to orchestrate proper assembly, networks synthesized in vitro will not have the same organization and material properties as those deposited in vivo. Furthermore, analysis of single fibrils will not provide information regarding the mechanics of the entire network.
Visualization of ECM architecture in situ is hindered by the composite nature of intact tissues. Resident cells induce light scattering, which prevents visualization of networks beyond the superficial surface layers [11]. Decellularization using mild detergents can remove cellular interference; however, most adult tissues are dense and individual networks remain difficult to resolve. To address this limitation, we developed a novel method to map the 3D organization of ECM networks using murine embryos [12]. During development, the ECM architecture is less dense making it feasible to visualize discrete components of the ECM network, and provides an ideal system with which the material properties of native fibrils can be determined.
A critical component for characterizing the mechanics of the ECM at the mesoscale is to be able to reliably measure strain across large networks. Digital volume correlation (DVC) can be used to determine full field displacements from 3D images but is typically computationally intensive. To circumvent the large computational demands of DVC, a more efficient method, fast iterative digital volume correlation (FIDVC) was developed [13]. The FIDVC algorithm can evaluate non-linear deformations of a 256×256×128 voxel volume in roughly 5 minutes on a standard CPU by using an iterative deformation method similar to that used in particle image velocimetry [13].
With our novel method to visualize the 3D geometry of the ECM, we have a unique opportunity to examine the material properties of networks in their native conformation. Forelimbs from embryonic day (E)14.5 murine embryos were decellularized as done previously [12] and stained to visualize fibrillin-2 and proteoglycans in the ECM. Samples were imaged using confocal microscopy before and after the application of a known load. ECM deformation was calculated using FIDVC and converted to strain. We found that the amount of strain experienced by different proteins appeared to depend on whether the sub-region analyzed was in cartilage or the adjacent connective tissue. Quantification of strain in situ is the first step towards identifying the material properties of different ECM networks. Since it is at the mesoscopic level that the rigidity of the local cellular environment is conferred, knowledge of the material properties of specific ECM networks can have a profound impact on future studies in mechanobiology.
Experimental Procedures
Visualization of ECM fibril architecture in 3D
Embryo harvest and decellularization
All murine experiments were approved by the Purdue Animal Care and Use Committee (PACUC; protocol 1209000723). PACUC ensures that all animal programs, procedures, and facilities at Purdue University adhere to the policies, recommendations, guidelines, and regulations of the USDA and the United States Public Health Service in accordance with the Animal Welfare Act and Purdue’s Animal Welfare Assurance. C57BL/6 mice were time-mated to generate E14.5 embryos. Dams were euthanized via CO2 inhalation and cervical dislocation. Embryos were removed from the uterine horns, rinsed in chilled 1× phosphate-buffered saline (PBS), and the forelimbs were excised under a dissecting microscope (DFC450, Leica Microsystems) to avoid tissue damage.
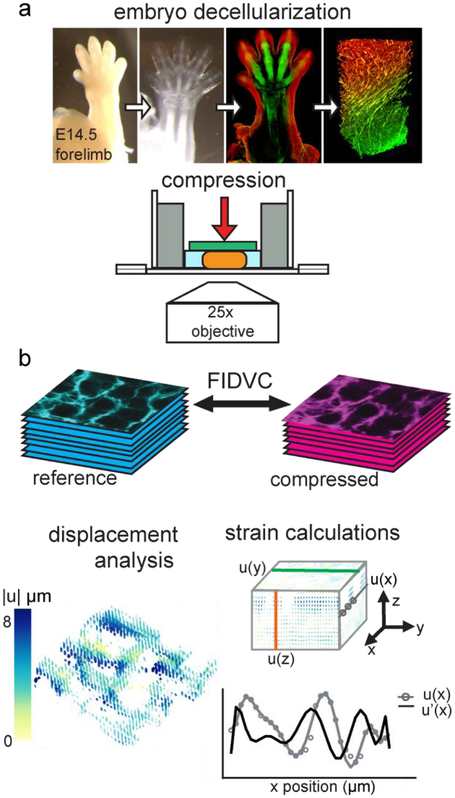
After dissection, forelimbs were decellularized to enhance the visualization of the ECM. To maintain the native architecture, a 3D polyacrylamide framework was generated within the forelimbs as previously described [12]. After polymerization, each forelimb was gently rocked in 1 mL 0.05% sodium dodecyl sulfate (SDS) with 1× Halt protease inhibitor (PI, ThermoFisher) in 1× PBS. SDS-PI solution was replaced every 24 hours until decellularization was complete after 3–5 days (Fig. 1). The samples swelled slightly due to the decellularization process; however, the swelling was found to be isotropic and only led to a 20% increase in whole embryo volume across time points [12]. Upon decellularization, samples were rinsed in 1× PBS and fixed with 4% paraformaldehyde (PFA) for 1 hour at room temperature. After fixation with PFA, decellularized forelimbs were rinsed in 1× PBS and then incubated in blocking buffer [10% donkey serum (Lampire) diluted in 1× PBS with 0.1% Triton X-100 (PBST)] for 16 hours at 4°C to increase permeability and block non-specific binding. Samples were then incubated with a primary antibody against fibrillin-2 (FBN2; 1:200; donated by R. Mecham), diluted in blocking buffer at 4°C for 48 hours with gentle rocking. Samples were rinsed 3×30 minutes with 0.1% PBST at 25°C, then incubated with AF633 donkey anti-rabbit (1:500; ThermoFisher) to visualize anti-FBN2 and AF488-conjugated wheat germ agglutinin (WGA; 1:100; ThermoFisher) to visualize proteoglycans, diluted in blocking buffer, at 4°C for 48 hours. Samples were rinsed 3×30 minutes with 0.1% PBST at 25°C and stored in PBS at 4°C in a lightproof container until imaging.
Fig. 1.
Experimental procedure. a. Decellularization of murine embryonic forelimbs allows the visualization of the extracellular matrix in its native conformation using confocal microscopy, after staining for ECM of interest. Decellularized forelimbs are imaged with an inverted confocal microscope while submerged in PBS. Embryo decellularization panels adapted from [12]. b. Volume images obtained before (cyan) and after load (magenta), corresponding to the same area of the digit, are correlated to extract displacements with fast iterative digital volume correlation (FIDVC). Displacements are analyzed and plotted in color as vector fields. Strain is calculated by fitting each set of displacement values to polynomial functions and then calculating their derivatives analytically, indicated by u(x) and u’(x).
Image acquisition and load application
Samples were imaged using an inverted Zeiss LSM 880 confocal microscope (Carl Zeiss Microscopy) using either a 10× EC-Plan NeoFluar (NA = 0.3) or a 25× multi-immersion LD LCI Plan-Apochromat (NA = 0.8) objective (Figs. 1, 2). A dish suitable for confocal microscopy (Ibidi, 80421) was coated with polydimethylsiloxane (PDMS; Sylgard 184; Dow Corning) and an 8mm diameter well was created using a biopsy punch. XY alignment of the weight and the forelimb sample was facilitated by the PDMS well since it minimizes user error when placing the weight. The dimensions of the loading wells were such that they allowed unconfined compression of the decellularized forelimb samples and kept both the sample and the weight within the center of the dish. Samples were surrounded with sufficient 1× PBS to keep the sample hydrated for the duration of the experiment (~2 hours), but without excess that would cause the sample to translate or float (Fig. 1).
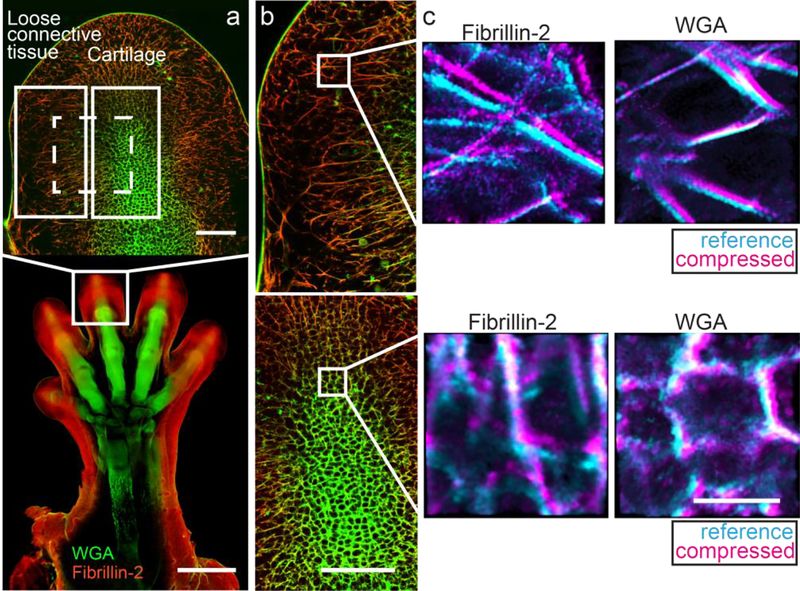
Fig. 2.
Representative confocal images of a decellularized murine forelimb. a. Global confocal image of the developing forelimb stained with wheat germ agglutinin (WGA; green) and for fibrillin-2 (red) at 10× (bottom; scale bar=500 μm) and at 25×, focusing on the distal phalange (top; scale bar=100 μm). The location of the cartilage and the adjacent loose connective tissue are boxed and labeled in white. Dashed box (white) represents the area analyzed when quantifying regional differences, including both cartilage and the adjacent loose connective tissue in the same sub-stack. b. Composite images of the loose connective tissue (top) and the cartilage (bottom), indicating the spatial distribution of fibrillin-2 (red) and WGA (green) (scale bar=100 μm). c. Composite images of a representative sub-stack in the loose connective tissue (top) and the cartilage (bottom) corresponding to fibrillin-2 (left) and WGA (right), showing an overlay of the reference (cyan) and compressed (magenta) (scale bar=10 μm).
The reference configuration was acquired by obtaining a 30-slice z-stack of images at 2048×2048 pixels from a 25× objective with a corresponding resolution of 0.23 μm/pixel (x, y) and 1.23 μm/pixel (z) (Fig. 2). After acquisition of the reference z-stack, a static load of 0.52 grams normal to the horizontal plane (−z) was applied by placing a custom-made weight over the sample with minimal disruption of the original sample position. The weight was manually placed over the sample using tweezers. Samples were allowed to equilibrate for 10 minutes before imaging the compressed configuration using the same imaging parameters as above, after adjusting the starting position to account for z-translation based on distinct material landmarks. The shape of the weight and the use of a PDMS well ensured the weight remained perpendicular to the sample during imaging. The reference and compressed configurations were acquired for five E14.5 forelimbs, all obtained from embryos from different litters, two of which are denoted as sample A and sample B.
Quantification of ECM displacement
Image processing
Both the reference and compressed z-stacks were processed as follows. To remove some of the optical distortion inherent to confocal microscopy, the Nearest Neighbor Deconvolution function within the ZenBlue software package (Carl Zeiss Microscopy) was applied. Two regions of varying morphology were investigated to test that our method could resolve region-specific differences in mechanical properties, corresponding to the cartilage of the distal phalanx and the surrounding loose connective tissue (LCT; Fig 2). For two E14.5 forelimbs imaged (Samples A and B), sub-stacks of cartilage (n=3) and LCT (n=3) in both reference and compressed configurations were created, and the FBN2 and WGA channels were separated using FIJI (NIH). Landmarks located in the first (bottom) and last (top) slices of the reference z-stacks were used as guides to align 22×22×15 μm3 sub-stacks of the same ECM location in both configurations (Fig. 1, 2). The dimensions of each sub-stack were resampled to be 256×256×128 voxels using the Resize function in FIJI, so the spacing of the grid of material points created during FIDVC was smaller than the features of interest (e.g. fibrils). The image intensity values for each pair of sub-stacks to be correlated were normalized using the Quantile Based Normalization plugin (FIJI). For each sub-stack the intensity values are ranked and divided into 256 quantiles. Then, each of the values in a quantile were replaced with the mean value of that quantile across all images in both z-stacks, resulting in a similar distribution of intensity values for both reference and compressed volume images.
Similarly, to investigate the deformation and strain for each protein network at a regional level, larger sub-stacks (188×188×15 μm3) were prepared for correlation and analysis, as described above. As shown with the dashed, white box in Fig. 2a, these larger sub-stacks included both cartilage and LCT in the digit. Sub-stacks from 5 different forelimbs were analyzed to investigate the variability of our method across samples, with the goal of also quantifying regional strain differences at a larger spatial scale. The dimensions of each larger sub-stack were resampled to be 1920×1920×128 voxels.
Digital volume correlation
Image stacks were imported into MATLAB R2017b (Mathworks) as 3D arrays of 8-bit intensity values. The intensity arrays of the reference and compressed configurations were compared using the MATLAB-based FIDVC algorithm developed by Bar-Kochba et al., to extract the displacement fields of the ECM networks [13]. Displacements components ux, uy, uz, were calculated for a grid of material points evenly spaced every 8 pixels along XYZ, corresponding to voxels of 0.68×0.68×0.94 μm3 for the 22×22×15 μm3 sub-stacks, and 0.78×0.78×0.94 μm3 for the larger 188×188×15 μm3 sub-stacks. Voxels in the regional sub-stacks had a slightly lower resolution due to the higher computational demands of processing these larger images. The features in the ECM networks of interest are <1 μm in diameter and thus the voxel dimensions of both regions remain smaller than the features we are trying to characterize. In addition to ux, uy, and uz, a cross correlation coefficient array was generated that quantitatively defined how well the intensity distribution mapped between the two configurations. Areas of low intensity, i.e. where there was no ECM, do not correlate well, leading to large erroneous displacements and small cross-correlation coefficients. The displacement arrays were processed using a 3D Gaussian filter, and then areas that had a cross-correlation coefficient lower than 0.001 were removed, to eliminate aberrant displacements.
Displacement analysis
Network displacements were analyzed by plotting the normalized number of fibril voxels as a function of displacement magnitude |u| to compare the distribution of displacements among proteins and geometries. Displacement was only considered in voxels corresponding to ECM based on the intensity profile of each pair of correlated images. This avoided the quantification of displacements in regions not corresponding to the ECM networks, since they often have low cross correlation coefficients and may correspond to erroneous displacements. Vector fields representing displacement components and magnitude were plotted in 3D using MATLAB, as a qualitative metric of ECM deformation (Fig. 1, 3, 7).
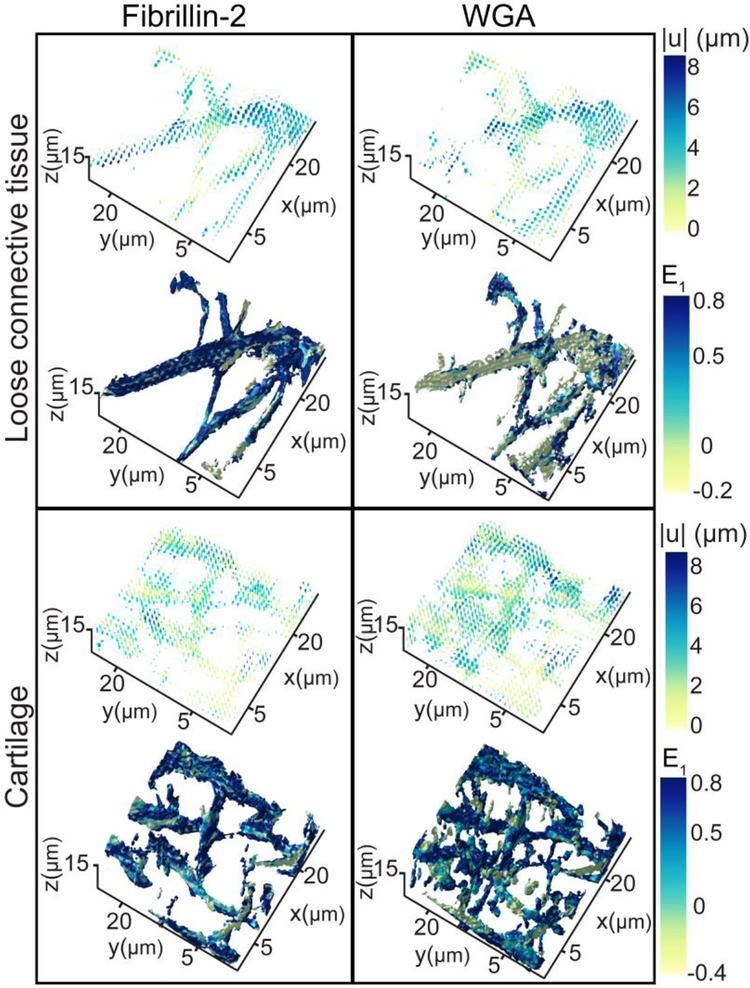
Fig. 3.
Representative deformation response from sample B for WGA and fibrillin-2 sub-stacks of 22×22×15 μm3 in the cartilage and loose connective tissue. Displacements are represented as vector fields with color representing magnitude from 0 to 8 μm. maximum principal strain (E1) is shown on the surface of the segmented ECM networks with color representing magnitude ranging from −0.4 to 0.8.
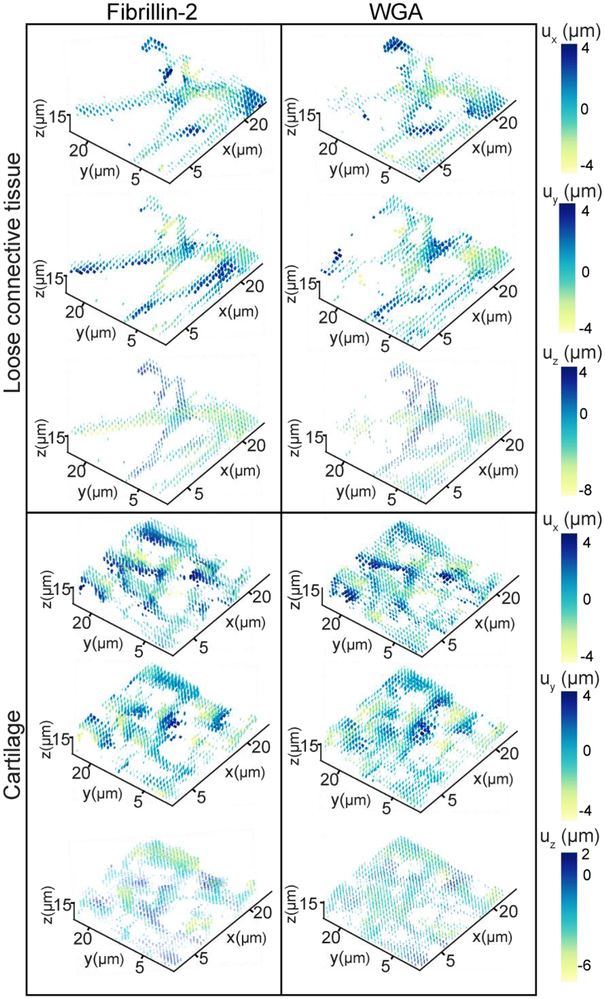
Fig. 7.
Displacement fields for representative ECM sub-stacks from sample B. ux, uy, and uz were plotted for FBN2 and WGA in the loose connective tissue (top) and the cartilage (bottom) regions with color indicating magnitude and directionality of displacement.
Validating fibril displacements
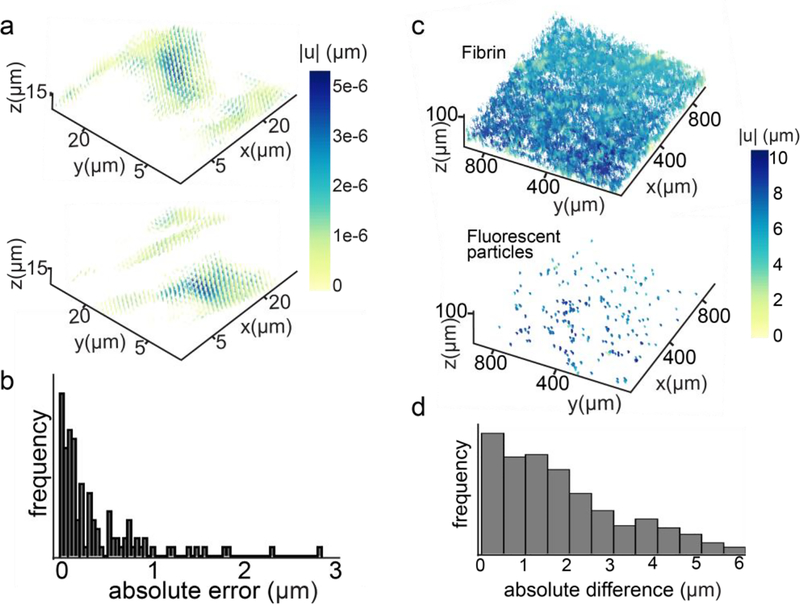
To confirm that random motion of the network does not influence displacement measurements, control samples without a load applied were imaged 2×, with 15 minutes in between acquisition of each stack. The two pairs of z-stacks were compared with FIDVC as described above.
Sample fabrication
The compression-induced displacements of fluorescent particles in fibrin gels obtained with FIDVC were compared to those calculated using the TrackMate plug-in, as a control (FIJI)[14]. Fibrin gels were composed of human thrombin (Enzyme Research Laboratories), human fibrinogen (Enzyme Research Laboratories), AF488-conjugated fibrinogen (ThermoFisher), and Fluoro-Max Dyed Blue Aqueous Fluorescent Particles (ThermoFisher; diameter: 0.5 μm; concentration: 1% solids;). In brief, the fibrin gels were prepared by combining 5.7 μL human fibrinogen (14.15 mg/mL stock in 20 mM sodium citrate-HCl/pH 7.4), 20 μL fluorophore-conjugated fibrinogen (1 mg/mL stock in 0.1 M sodium bicarbonate/pH 8.3), 1.0 μL calcium chloride (2M in Milli-Q), and 73.3 μL PBS. The solution was briefly vortexed, combined with 1 μL of the fluorescent particle working solution (1:10 in PBS), then vortexed again for 1 second. Then, 5 μL of thrombin solution (0.01 u/μL in Milli-Q) were added and the combined solution was again briefly vortexed. Approximately 100 μL of the resulting solution were pipetted into three equally sized droplets of fibrin in a 50-mm glass bottom petri dish. In preparation for compression experiments and to facilitate the polymerization of the gels into a cylindrical shape, supports made of PDMS were placed on either side of the droplets and a circular glass coverslip was placed over them. Light pressure was applied to ensure the top of the gels adhered to the coverslip. The dish was then covered to protect the gels from light and left to polymerize for 10 minutes on the bench. To prevent the gels from drying out, PBS was gently added to their surrounding space.
Image acquisition and analysis
The fibrin gels were imaged using an inverted Zeiss LSM 880 confocal microscope using a 10× EC-Plan NeoFluar (NA = 0.3) objective. An 850×850 μm2 area was selected for imaging based on visibility and quality of fibrils and fluorescent particles. Reference z-stacks, composed of 12 slices with Δz = 5μm, were acquired. After the reference z-stacks were acquired, a weight of 27 g was placed on the center of the glass plate and left to equilibrate for 15 minutes before imaging the compressed configuration. The z-stacks were then processed using FIJI to despeckle and remove outliers. The Remove Outliers feature was used to remove small bright pixels that were significantly smaller than the fluorescent particle dimensions. TrackMate was used to analyze the images by calculating the uxy displacement of the fluorescent particles before and after compression of the gel, based on particle size and track quality. The obtained data was exported into MATLAB and the displacement magnitudes (|uxy|) were plotted as vector fields. Volume images were also processed as described in the previous section and compared with FIDVC to extract the displacements of the fluorescent particles.
Displacement error calculation
The FIDVC displacement values corresponding to those of fluorescent particles tracked by TrackMate were used to calculate the absolute error, by subtracting the TrackMate displacements from those obtained with FIDVC (Fig. 6b). The location of the displacements calculated with FIDVC was found using the MATLAB function findpeaks. For each of the 4 fibrin gel compression experiments conducted, the average and standard deviation of the absolute error values were calculated for both the upper and lower half of the analyzed volume images, to investigate if z-position in the sample influenced the absolute displacement error. Further, the displacement field of the fluorescent particles and the fibrin fibrils in a sample were plotted (Fig. 6c). The difference between the FIDVC displacements of fibrils and fluorescent particles within the same volume was calculated to compare how well the algorithm tracked components of different geometries (Fig. 6d).
Fig. 6.
Error quantification and analysis. a. Representative displacement vector field resulting from the fast-iterative digital volume correlation (FIDVC) of the same configuration imaged twice, without the application of load for WGA (top) and FBN2 (bottom). Displacement magnitude (in the order of picometers) is shown with color in the vector field. b. Representative absolute displacement error distribution for fibrin gel compression experiment and FIDVC. c. Displacement fields of the fibrils (top) and the fluorescent particles (bottom) in the fibrin gels generated for FIDVC displacement validation. d. Representative absolute difference between the FIDVC-calculated displacement of fluorescent particles and the adjacent fibrils.
Calculation of Green-Lagrange strain tensor
The components of the Green-Lagrange strain tensor were calculated for the image volume from the FIDVC displacement components ux, uy, uz, for a grid of material points evenly spaced based on the image resolution. The deformation gradient and the Green-Lagrange strain tensors at each grid point were calculated as:
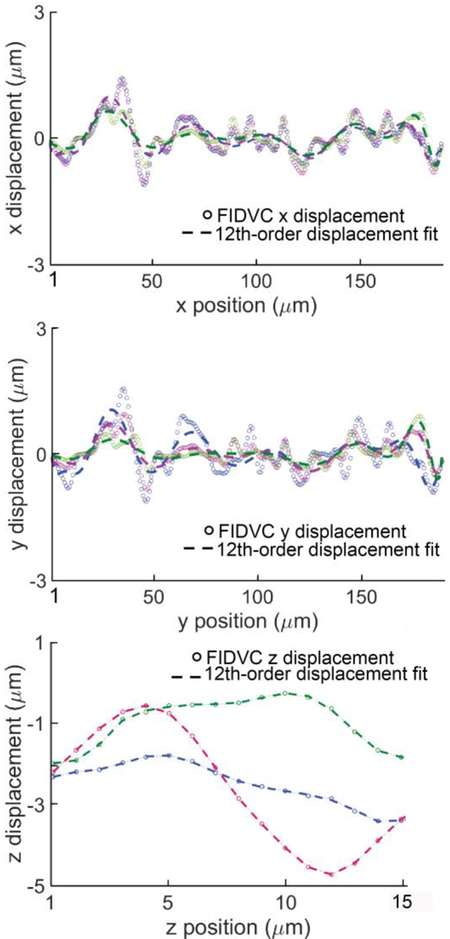
where I is the identity tensor. The partial derivatives of the displacement components were calculated by fitting a polynomial across x, y, and z (Fig. 1) and analytically evaluating the derivative [15]. Here, displacement components included all values prior to elimination of those corresponding to low correlation coefficients and noise, in order to keep the interpolation functions from operating over large regions of blank space. The polynomial order was selected based on the norm of the residuals corresponding to polynomials orders 2–15. The 12th order polynomial provided the optimal fit, and a comparison of representative displacement components and the corresponding polynomial functions is shown in Fig. 9. The maximum principal strain, E1, was calculated by determining the eigenvalues of E in MATLAB. ECM strain was calculated in three sub-regions (22×22×15 μm3, each) within LCT and cartilage as well as in the larger network sub-stacks (188×188×15 μm3) for each protein. For visualization purposes, representative sub-stacks were segmented in MATLAB, based on the image intensity array, and the networks were rendered in 3D using a colorimetric scale to represent the magnitude of E1 across the volume (Fig. 3, 5). Information on the ECM geometry was used to selectively segment regions corresponding to continuous structures in the LCT or cartilage and a threshold was set to prevent the 3D segmentation of small floating elements [16–19].
Fig. 9.
Gaussian filtered FIDVC displacement components at 3 representative positions (indicated by different colors) in sample B, including their corresponding polynomial fit. Negative z-displacements are in the direction of the applied load.
Fig. 5.
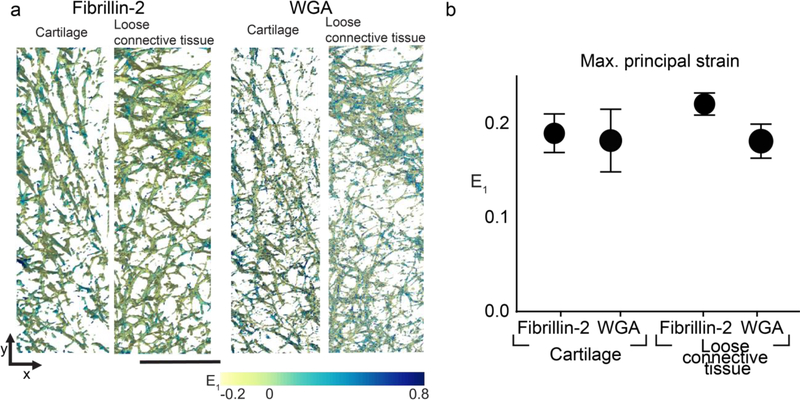
Comparison of maximum principal strain (E1) from large ECM networks. a. Representative ECM networks fibrillin-2 (left) and WGA (right) segmented in 3D with color representing the magnitude of E1 (scale bar = 50 μm). b. Average E1 for each protein in each region from the large ECM networks across 5 different embryonic samples is dependent on protein (p ≤ 0.032, two-way ANOVA). Tukey post-hoc comparison did not show significant differences between individual groups (n = 5; bar = S.D.).
Strain analysis and statistics
Average ECM network strain for each 22×22×15 μm3 sub-stack was calculated to compare the response of different proteins and regions to the applied load. The average maximum principal strain was used a metric to compare across proteins and geometries (LCT-FBN2; LCT-WGA; cartilage-FBN2; cartilage-WGA) since the 3D reconstructions are unable to show the internal strains, are subject to visual interpretation, and only represent the values at the surface. Therefore, the average maximum principal strains are a more representative and informative metric of the ECM network deformation across proteins and tissue types. Prior to the calculation of their average, strain values were subjected to a 3D Gaussian filter. Strain values greater than 1 or less than −1 were not included in the average calculation since these outliers represented <2% of each component of the Green-Lagrange strain tensor. Further, strain values corresponding to small, floating elements were not included in the ECM network segmentations.
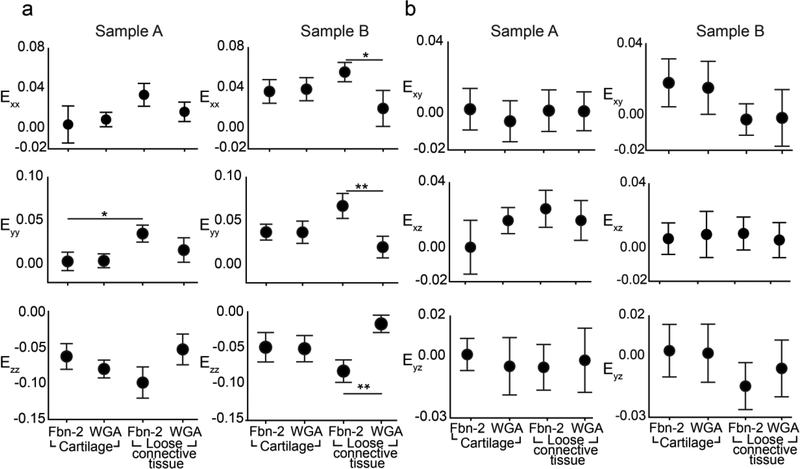
Averages and the corresponding standard deviations were calculated using MATLAB and then plotted with GraphPad Prism 7.03 (GraphPad Software). A two-way ANOVA was performed using GraphPad Prism, α=0.05, to determine if the normal components of the Green-Lagrange strain tensor, Exx, Eyy, Ezz, and E1 significantly vary as a function of protein and region. A post-hoc Tukey HSD test was used to identify significant differences between groups. The same approach was taken in analyzing E1 corresponding to the ECM networks in the 188×188×15 μm3 sub-stacks. Average regional (LCT, cartilage) E1 were calculated for each protein (FBN2, WGA). Then, E1 averages were combined by group (LCT-FBN2; LCT-WGA; cartilage-FBN2; cartilage-WGA) across 5 samples by calculating their mean and standard deviation (Fig. 5b). A two-way ANOVA was performed using GraphPad Prism, α=0.05, to determine if E1 significantly varied as a function of protein and region.
Results
Fibril deformation
Our method presents an opportunity to investigate and define the material behavior of the ECM in the native 3D configuration. By first decellularizing embryonic tissues and maintaining their structural integrity, we can visualize the 3D geometry of independent ECM networks, before and after loading. E14.5 embryonic forelimbs were stained for FBN2, an ECM component that is found in microfibrils and elastin. Samples were counterstained with fluorophore-conjugated WGA, a lectin that selectively binds to n-acetyl glucosamine and sialic acid, labeling a subset of proteoglycans in the ECM. For brevity, the two networks are referred to as FBN2 and WGA.
Correlation of the reference and compressed configurations using FIDVC showed that the displacements of the ECM networks were heterogeneous in both the cartilage and LCT (Fig. 3). Since similar displacements are seen across samples, only those corresponding to sample B are shown as representative displacement fields (Fig. 3, 7). In both samples, displacements were the greatest in the direction of load (−z). However, displacements of the same order of magnitude were seen in the xy plane in the opposite direction, due to the Poisson effect (Fig. 7). In the cartilage region, the displacement components (ux, uy, uz) and the displacement magnitude (|u|) for FBN2 and WGA had similar distributions (Fig. 3, 7). The locations of maximal displacement varied between FBN2 and WGA; potentially due to differences in the spatial distribution of each ECM network’s fibrillar structures, how these structures are interacting with each other, crosslinks between them, and chain entanglement. On the contrary, FBN2 and WGA in LCT exhibited different deformation profiles (Fig. 3, 7). Greater displacements were seen in the FBN2 fibrils than the WGA-stained proteoglycans (Fig. 3), potentially related to the length between the components of the two networks.
Fibril strain
ECM sub-regions
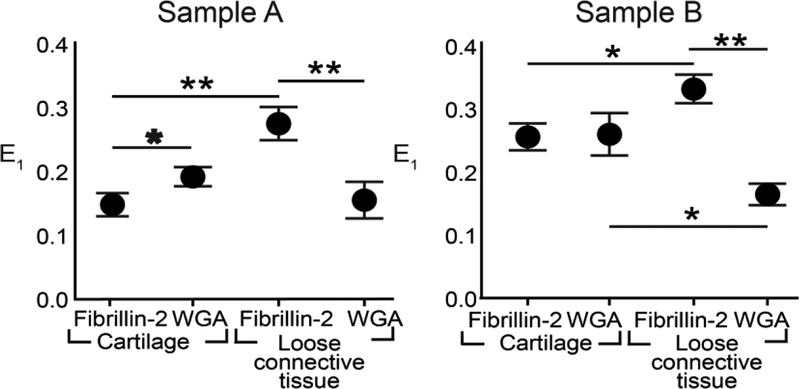
After correlation of the reference and compressed image volumes with FIDVC, ECM strain in situ was obtained by calculating the partial derivatives of the displacement components. Similar trends in maximum principal strain, E1, and the normal strains of E were observed in the two different samples (Fig. 4, 8a). Sample B had slightly higher maximum principal strains than Sample A, which might be due to slight differences in ECM spatial distribution and z-location of the analyzed 22×22×15 μm3 sub-regions between samples. The heterogeneous geometry of the forelimb might also be causing these differences. For Sample A, both protein (0.0021 < p ≤ 0.032) and region (i.e. LCT, cartilage) (0.0002 < p ≤ 0.0021) had a significant effect on the average E1, as found by two-way ANOVA. Protein composition significantly influenced E1 in the cartilage sub-regions (0.0021 < p ≤ 0.032). In LCT, FBN2 had a significantly higher E1 than WGA (0.0002 < p ≤ 0.0021) (Fig. 3, 4). For Sample B, only the protein was found to have a significant effect on E1 (p ≤ 0.0002) and similar trends were observed for both E1 and the normal strains (Fig. 4, 8a). The region of interest had a significant effect on the average Exx and Eyy (p ≤ 0.032; Fig. 8a). Ezz was larger than Exx and Eyy in both samples, which is consistent with uz being greater than ux and uy regardless of protein and region (Fig. 7, 8a). The shear strains of both samples were lower than the normal strains and E1, ranging from −0.014 to 0.018, for both samples (Fig. 8b). This indicates that the predominant mode of loading was axial since the ECM is not undergoing large shear distortion in any two directions.
Fig. 4.
Comparison of independent samples reveals similar trends in ECM strain profiles. Maximum principal strain (E1) for sample A (left) and sample B (right) was dependent on both protein and region (p ≤0.0021; p ≤ 0.032, respectively, two-way ANOVA). Tukey post-hoc comparison showed significant differences between individual groups (*0.0021 < p ≤ 0.032; **0.0002 < p ≤ 0.0021) (n=3; bars = S.D.).
Fig. 8.
Comparison of Green-Lagrange strain components across independent samples. a. Significant differences between normal strains (Exx, Eyy, Ezz) across proteins and regions for sample A (left) and sample B (right) identified via a two-way ANOVA post-hoc Tukey test comparison are shown (*0.0021 < p ≤ 0.032; **0.0002 < p ≤ 0.0021) (n=3; bars = S.D.), revealing similar trends in ECM strain profiles. b. Shear strain components (Exy, Exz, Eyz) for sample A (left) and Sample B (right) (n = 3; bars = S.D.).
ECM networks
To minimize any bias introduced via the sub-region selection process, larger areas encompassing both cartilage and LCT were analyzed. Similar trends were observed as in the smaller sub-regions, though the differences between protein and tissue type were attenuated. The regional E1 averages for each protein (FBN2, WGA) from large ECM network sub-stacks (188×188×15 μm3) across 5 different embryonic samples, showed similar trends (Fig. 5). Protein type was found to significantly affect the average E1 (p ≤ 0.032). Notably, FBN2 in LCT had a substantially, but not significantly, higher E1 average than WGA (p = 0.0564), consistent with the sub-region analysis. Small standard deviations in the strain values across samples, indicate the repeatability of this technique.
Displacement error
After imaging control samples without a load applied 2×, the displacements resulting from FIDVC indicate that there is minimal noise in our system (Fig. 6a). The TrackMate plug-in (FIJI) was used as a control to validate the displacements obtained with FIDVC. TrackMate and FIDVC lead to similar vector fields, however, there are significantly fewer data points in the field resulting from TrackMate. This is potentially due to the tracking parameters we have established and the particle size we have selected as a target. There are many fluorescent particles that are not tracked by TrackMate, yet they are accounted for with FIDVC. For instance, there were only 117 particles tracked by TrackMate, while FIDVC leads to 295 non-zero displacement magnitudes in a representative sample. Nonetheless, >90% of the absolute error values are less than 10% of the maximum displacement (10 μm), while the average displacement was 6.67 μm. Displacement magnitudes (xy) calculated with FIDVC appeared to be an overestimate of those calculated with TrackMate. The average for the absolute error across compression experiments seems to be consistent (Fig. 6b). Standard deviations remain in the same order of magnitude as the absolute error average across samples (Table 1). Furthermore, the z-position of the tracked displacements appears to influence the absolute displacement error values, as shown in Table 1. In addition, the displacement of both particles and fibrils in the same sample were calculated with FIDVC, showing good agreement between components of different geometries (Figs. 6c, 6d).
Table 1.
FIDVC absolute displacement error
| |uxy| (μm) (upper half) | |uxy| (μm) (lower half) | |
|---|---|---|
| Fibrin gel compression 1 | 0.673 ± 0.586 | 0.331± 0.517 |
| Fibrin gel compression 2 | 0.458± 0.649 | 0.159± 0.123 |
| Fibrin gel compression 3 | 0.363± 0.409 | 0.129± 0.121 |
| Fibrin gel compression 4 | 0.462± 0.240 | 0.170± 0.185 |
Discussion
The results presented here demonstrate the potential for our method to resolve ECM deformation and strain in situ. Characterizing ECM network deformation is possible through confocal microscopy of immunostained, decellularized embryonic tissues before and after mechanical loading. During embryonic development, the ECM architecture is less dense, making it easier to visualize and manipulate compared to most adult tissues that are denser with individual networks that are difficult to resolve. Image processing and FIDVC algorithms were used to extract the displacement and strain fields of 3D networks. This allowed us to estimate the principal strains of independent ECM when a load was applied to the entire tissue sample. Despite some limitations in data acquisition and analysis, our method provides a first step towards characterizing the material behavior of native ECM networks.
The heterogeneous geometry of the forelimb challenged the application of a normal load that remained perpendicular during imaging. This was minimized by using a PDMS loading well that constrained the weight from moving and potentially translating the samples. To decrease the effect of intersample variability, all litters were harvested at noon to obtain samples at a consistent stage of embryonic development (E14.5). All samples were oriented dorsal side up and the same region of the distal phalanx of the third digit was imaged on all forelimbs. Due to inherent variations in biological sample geometry, it could not be guaranteed that the forelimbs were subjected to the same load profile and stress was not calculated in this study. Nevertheless, the maximum principal strain averaged over 5 different biological replicates showed similar trends in E1 between ECM (Fig. 5). Future studies will focus on resolving these effects by utilizing samples with more homogenous geometries and testing under tensile deformation, which will enable us to better control for variations in specimen geometry.
Confocal microscopy allowed for the acquisition of images that could distinguish independent 3D networks. Small 22×22×15 μm3 sub-stacks were selected to have greater control over the region and location of the investigated ECM components (e.g. fibrils) and test the feasibility of visualizing the same regions before and after deformation. The selection of small sub-stacks led to some drawbacks in data analysis, one of which was the up-sampling of data through image processing prior to FIDVC. As outlined in the Methods section, the number of pixels corresponding to these volume images was adjusted in FIJI through the Resize function, which resized images by interpolating pixel intensities. However, this led to sub-stacks consisting of primarily interpolated data. To mitigate the effect of small sub-stack location, larger sub-stacks of ECM networks across 188×188×15 μm3 were also analyzed. The reliance on interpolated data precludes our ability to make definitive conclusions regarding strain between proteins and regions; nevertheless, similar trends in principal strains were observed between the different sized data sets.
Due to the nature of this fibrillar material, accurate measurement of individual strain tensor components using displacements derived from FIDVC will be challenging since these will be affected by fibril translation and specimen orientation. Representation of strain using invariants (e.g. principal strains) circumvents this issue and enables the comparison of the response of different ECM components to loading. However, to definitively determine if the displacements observed are due to changes in fibril length or simply network reorganization or translation, analysis of larger volumes that include features that can be used as fiduciary markers will be essential. These features, such as intra/inter-network cross-links, will be ECM and tissue dependent and will require high-resolution imaging over multiple time steps to identify if changes in geometry are due to reorganization/translation or material deformation. Alternatively, artificial landmarks can be imposed on the fibrils by using techniques such as photobleaching. If uncertainty in determining variations in strain of individual fibril components persists even with high-resolution imaging, we will instead use overall network features to map tissue deformation and strain.
In accordance with Nyquist criterion, any analysis or calculations based on DVC should have voxel dimensions smaller than the features of interest in the images [15,21,22]. The individual ECM fibrillar structures in this work were <1 μm in diameter. Given the tradeoff between imaging time, the resolution and working distance of the objectives used, and our computational capabilities, the study was limited by our image processing resources and the step size between z-slices was 1.23 μm. The discrepancy between z-step and fibril dimensions could lead to an overestimation of ECM dimensions in the z-direction resulting in an underestimation of strain. Now that we established the feasibility for this pipeline to track fibrils within heterogeneous tissues before and after loading, our future studies will expand to include submicron-resolution analysis of large, full-field network images (~400×400×100 μm3) with supercomputing resources. Additionally, a sensitivity analysis will be needed to ensure displacement values are independent of imaging parameters, particularly in the z-direction.
The choice of displacement as an intermediate step to calculate strain has a direct effect on the results. In this study, strain was estimated through polynomial fitting and the evaluation of analytical derivatives in as a function of xyz position (Fig. 9). As shown when plotting the FIDVC data and the displacement polynomial fit, the quality of the fit varied, but overall showed a good representation of the data. Non-fibril displacements were included in the data used to generate the polynomial functions for the following reasons: First, there is an intensity gradient present between the ECM fibrils (bright) and the non-fibril space (dark). The changes in intensity between the bright fibrils and the dark non-fibril space varied depending on fibril geometry, orientation, and network 3D organization, in combination with the imaging parameters that might also be responsible for this gradient-like border defining the ECM fibrils. Therefore, eliminating the displacements on non-fibril spaces would potentially eliminate fibril displacements that are just below the threshold but are still relevant. More importantly, eliminating nonfibril displacements can introduce discontinuities when plotting the data and lead to further interpolation between fibril displacements.
To validate displacements obtained with FIDVC and quantify the error pertaining to our imaging procedure, fluorescent, spherical particles in a fibrillar, fibrin gel were visualized before and after compression (Fig. 6). The average absolute errors obtained were approximately an order of magnitude smaller than displacement due to compression; similar to previously reported FIDVC displacement errors [15]. There appeared to be an influence of z-position in the absolute FIDVC error. This might be due to the nature of the compression experiments; the upper half of the fibrin gel was closer to the applied load, potentially leading to greater particle movement or making it more challenging for TrackMate to successfully track all present particles. The calculation of absolute error was limited to only the particles TrackMate could successfully track, and it did not involve displacement in the z-direction. Therefore, this meant that over half of the FIDVC displacements were not involved in the calculation of absolute error. Further, the FIDVC z-displacement error and its reliability are yet to be quantified in our hands.
The greatest displacement component was uz which corresponds to the direction of the applied load (−z) (Fig. 3, 7). The results of FIDVC indicate a maximum displacement of 8 μm in the direction of the load (Fig. 7). During imaging, landmarks used as guides for alignment were observed to also displace roughly 6–8 μm due to compression. Discrepancies in the visual representations of displacement and strain were observed, potentially due to the choice of segmentation algorithm used to reconstruct ECM fibrillar network structures and visualize strain in 3D. These discrepancies might also depend on the number of material grid points fit to the polynomials. Increasing both image resolution and dimensions will better support the analysis of strain by improving the signal to noise ratio and minimizing the variations in E1 identified when visualizing surface strains.
The steps taken to visualize the 3D geometry of the ECM may influence the mechanical properties of the samples. Treatment with SDS has been confirmed to not interfere with the spatial organization of the ECM [12]. However, detergents may disrupt these fibrillar structures if delicate embryonic samples are decellularized for too long. Since visual inspection is subjective, it is best to limit the time that the samples are submerged in detergents to 3–5 days. Although the tissues were fixed with PFA, which might increase intrafibrillar crosslinking, previous work showed that the bulk tissue mechanics were not significantly altered [20]. Furthermore, the presence of a polyacrylamide framework likely influences ECM deformation since it increases the overall rigidity of the embryonic tissue and may deform differently. Unfortunain decellularized embryonic tissues without the polyacrylamide support will be needed to quantify the influence of this framework.
Conclusions
The development of a methodology to quantify strain is a critical step towards characterizing the material behavior of different ECM networks in situ. By capitalizing on the sparse nature of the ECM during embryonic development, we were able to visualize variations in relative displacement of different ECM proteins and networks in situ. Future work will focus on addressing current limitations in imaging and data analysis, which will enable our method to reveal quantitative differences in the amount of strain experienced by different proteins as a function of tissue type. Our goal is to use this optimized workflow to develop constitutive equations that describe the mesoscale mechanical properties of the ECM. This information can facilitate the fabrication of physiologically relevant scaffolds for regenerative medicine by establishing mechanical guidelines for microenvironments that are used for the de novo assembly of tissues.
Acknowledgements
This work was supported by the National Institutes of Health [R21 AR069248, R01 AR071359 and DP2 AT009833 to S.C.]. The authors would like to thank Dr. Robert Mecham for providing the fibrillin-2 antibody. We would also like to acknowledge Michael Drakopoulos and Benjamin Sather for their technical assistance and support.
References
- 1.Hynes RO, Naba A (2012) Overview of the matrisome—an inventory of extracellular matrix constituents and functions. CSH Perspect Biol 4 (1):a004903. doi: 10.1101/cshperspect.a004903 [DOI] [PMC free article] [PubMed] [Google Scholar]
- 2.Kjaer M (2004) Role of extracellular matrix in adaptation of tendon and skeletal muscle to mechanical loading. Physiol Rev 84 (2):649–698. doi: 10.1152/physrev.00031.2003 [DOI] [PubMed] [Google Scholar]
- 3.Calve S, Simon HG (2012) Biochemical and mechanical environment cooperatively regulate skeletal muscle regeneration. FASEB J 26 (6):2538–2545. doi: 10.1096/fj.11-200162 [DOI] [PMC free article] [PubMed] [Google Scholar]
- 4.Hartman CD, Isenberg BC, Chua SG, Wong JY (2016) Vascular smooth muscle cell durotaxis depends on extracellular matrix composition. PNAS 113 (40):11190–11195. doi: 10.1073/pnas.1611324113 [DOI] [PMC free article] [PubMed] [Google Scholar]
- 5.Rowlands AS, George PA, Cooper-White JJ (2008) Directing osteogenic and myogenic differentiation of MSCs: interplay of stiffness and adhesive ligand presentation. Am J Physiol - Cell 295 (4):C1037–C1044. doi: 10.1152/ajpcell.67.2008 [DOI] [PubMed] [Google Scholar]
- 6.Li L, Eyckmans J, Chen CS (2017) Designer biomaterials for mechanobiology. Nat Mater 16:1164. doi: 10.1038/nmat5049 [DOI] [PMC free article] [PubMed] [Google Scholar]
- 7.Klotzsch E, Smith ML, Kubow KE, Muntwyler S, Little WC, Beyeler F, Gourdon D, Nelson BJ, Vogel V (2009) Fibronectin forms the most extensible biological fibers displaying switchable force-exposed cryptic binding sites. PNAS 106 (43):18267–18272. doi: 10.1073/pnas.0907518106 [DOI] [PMC free article] [PubMed] [Google Scholar]
- 8.Li W, Sigley J, Pieters M, Helms Christine C, Nagaswami C, Weisel John W, Guthold M (2016) Fibrin fiber stiffness is strongly affected by fiber diameter, but not by fibrinogen glycation. Biophys J 110 (6):1400–1410. doi: 10.1016/j.bpj.2016.02.021 [DOI] [PMC free article] [PubMed] [Google Scholar]
- 9.Eriksen T, Wright D, Purslow P, Duance V (2001) Role of Ca2+ for the mechanical properties of fibrillin. Proteins 45 (1):90–95 [DOI] [PubMed] [Google Scholar]
- 10.Shen ZL, Kahn H, Ballarini R, Eppell Steven J (2011) Viscoelastic properties of isolated collagen fibrils. Biophys J 100 (12):3008–3015. doi: 10.1016/j.bpj.2011.04.052 [DOI] [PMC free article] [PubMed] [Google Scholar]
- 11.Richardson DS, Lichtman JW (2015) Clarifying tissue clearing. Cell 162 (2):246–257. doi: 10.1016/j.cell.2015.06.067 [DOI] [PMC free article] [PubMed] [Google Scholar]
- 12.Acuna A, Drakopoulos MA, Leng Y, Goergen CJ, Calve S (2018) Three-dimensional visualization of extracellular matrix networks during murine development. Dev Biol 435 (2):122–129. doi: 10.1016/j.ydbio.2017.12.022 [DOI] [PMC free article] [PubMed] [Google Scholar]
- 13.Bar-Kochba E, Toyjanova J, Andrews E, Kim K-S, Franck C (2015) A fast iterative digital volume correlation algorithm for large deformations. Exp Mech 55 (1):261–274. doi: 10.1007/s11340-014-9874-2 [DOI] [Google Scholar]
- 14.Tinevez JY, Perry N, Schindelin J, Hoopes GM, Reynolds GD, Laplantine E, Bednarek SY, Shorte SL, Eliceiri KW (2017) TrackMate: An open and extensible platform for single-particle tracking. Methods 115:80–90. doi: 10.1016/j.ymeth.2016.09.016 [DOI] [PubMed] [Google Scholar]
- 15.Midgett DE, Pease ME, Jefferys JL, Patel M, Franck C, Quigley HA, Nguyen TD (2017) The pressure-induced deformation response of the human lamina cribrosa: Analysis of regional variations. Acta Biomater 53:123–139. doi: 10.1016/j.actbio.2016.12.054 [DOI] [PMC free article] [PubMed] [Google Scholar]
- 16.Zhang Y, Hamza AB Vertex-based anisotropic smoothing of 3D mesh data In: 2006 Canadian Conference on Electrical and Computer Engineering, 7–10 May 2006. pp 202–205. doi: 10.1109/CCECE.2006.277433 [DOI] [Google Scholar]
- 17.Yagou H, Ohtake Y, Belyaev AG (2002) Mesh smoothing via mean and median filtering applied to face normals. ieee, geometric modeling and processing. theory and applications. GMP 2002. Proceedings. doi: 10.1109/GMAP.2002.1027503 [DOI] [Google Scholar]
- 18.Zhang Y, Matuszewski BJ, Shark LK, Moore CJ Medical image segmentation using new hybrid level-set method In: IEEE International Conference on Biomedical Visualisation, London, UK, 2008. IEEE, pp 71–76 [Google Scholar]
- 19.Fang Q, Boas DA (2009) Tetrahedral mesh generation from volumetric binary and gray-scale images. Paper presented at the Proceedings of the Sixth IEEE international conference on Symposium on Biomedical Imaging: From Nano to Macro, Boston, Massachusetts, USA, [Google Scholar]
- 20.Neu CP, Novak T, Gilliland KF, Marshall P, Calve S (2015) Optical clearing in collagen- and proteoglycan-rich osteochondral tissues. Osteoarthr Cart 23 (3):405–413. doi: 10.1016/j.joca.2014.11.021 [DOI] [PMC free article] [PubMed] [Google Scholar]
- 21.Muhammad MS, Choi TS (2012) Sampling for shape from focus in optical microscopy. IEEE T Pattern Anal 34 (3):564–573. doi: 10.1109/TPAMI.2011.144 [DOI] [PubMed] [Google Scholar]
- 22.Lakadamyali M, Babcock H, Bates M, Zhuang X, Lichtman J (2012) 3D multicolor super-resolution imaging offers improved accuracy in neuron tracing. PLoS ONE 7 (1):e30826. doi: 10.1371/journal.pone.0030826 [DOI] [PMC free article] [PubMed] [Google Scholar]


