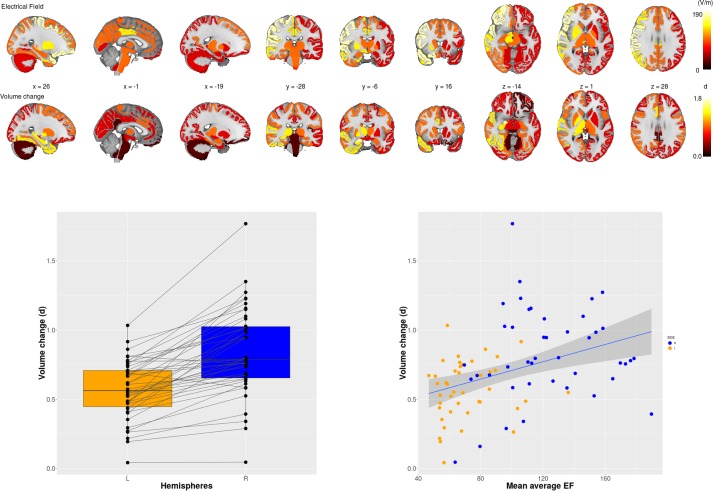
Figure 1. Electric Field (EF) and volume change across 85 brain regions.
Upper panel first row: Mean EF across 85 brain regions; second row: the effect size of volume changes between baseline and at the end of the course of ECT across 85 regions. Lower panel, left: Effect sizes of right unilateral stimulations were consistently higher on the right side than on the left side. Lower panel, right: Scatter plot of regional EF versus regional volume change (r = 0.38; p <0.001; df = 83; t = 3.77). (d) = Cohen’s d effect size..

