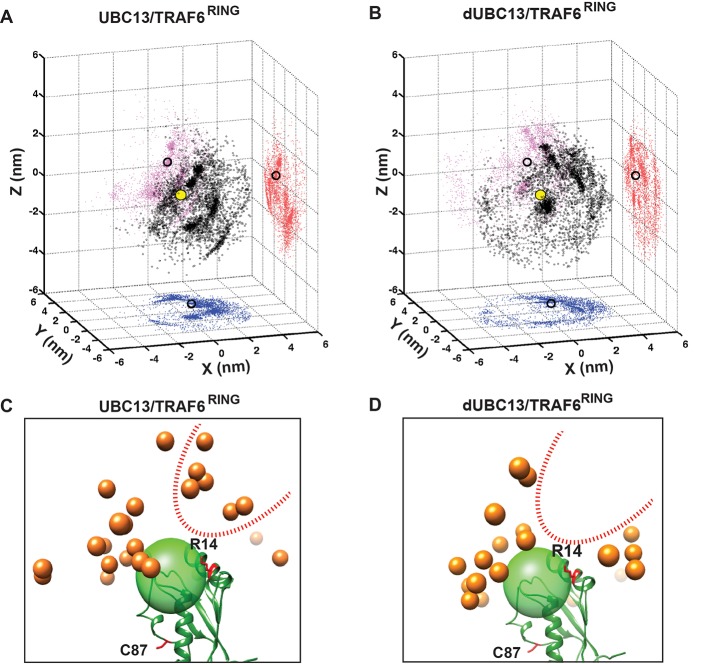
Figure 7. Transient complexes observed during unbiased association simulations.
(A) Black open circles denote TRAF6RING (aa:70–109) centers of mass around UBC13 in the Cartesian coordinate space. Red, pink and blue colored symbols denote projections of the centers of masses on the coordinate planes. Projections of the centers of mass of TRAF6RING in the native complex are shown as black open circles on the coordinate planes. The center of mass of the UBC13 helix α1, which is at the center of UBC13 interface, is shown as a yellow sphere at the origin. (B) Same as in (A) for dUBC13. (C) TRAF6RING clusters calculated based on pairwise RMSD between UBC13/TRAF6RING complexes (cutoff = 0.45 nm) are shown as orange spheres. Only representatives for clusters with greater than ten structures are shown. The UBC13 is represented in ribbon and colored green. The center of mass of UBC13 interface is shown as a green transparent sphere with 1 nm radius. The sidechain of R14 is shown and colored red. (D) Same as (C) for dUBC13. The region near R14, where TRAF6RING clusters were absent in dUBC13 is shown as a red dotted curve in (C) and (D).
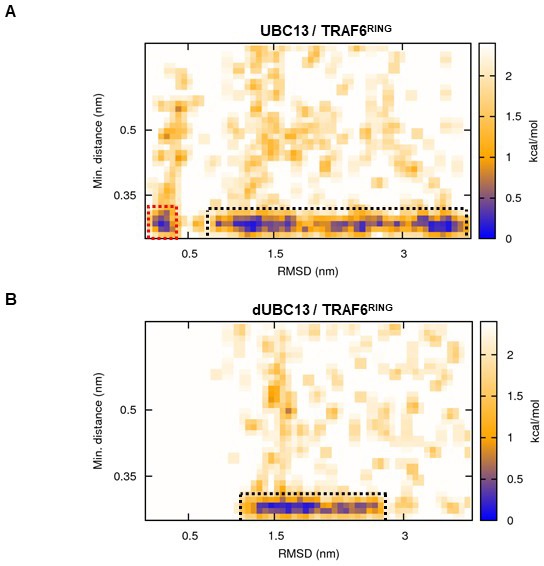
Figure 7—figure supplement 1. Free energy landscapes obtained from association MD (10 mM NaCl).

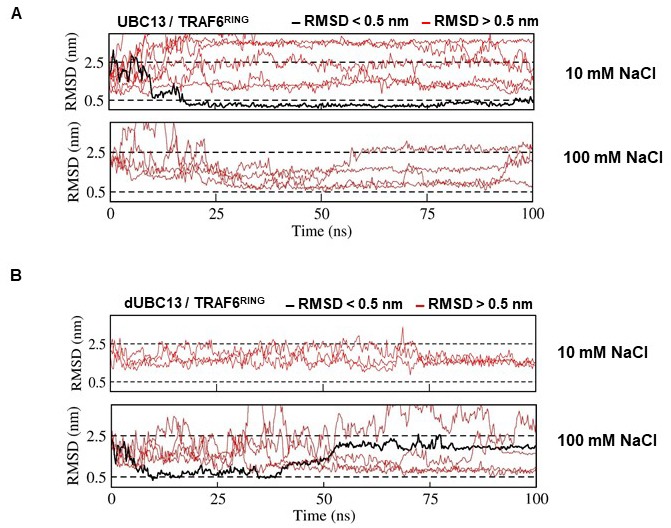
Figure 7—figure supplement 2. RMSD analysis of UBC13/dUBC13 and TRAF6RING association trajectories.


