Figure 9. Activity and interactions of the UBC13/RNF38RING complex.
(A) The measured dissociation constants of mutants of UBC13/TRAF6RING complex are given as Mean+/-SD. The difference of free energy of binding was calculated as ΔΔGbinding = RTln(Kd/Kdwt), where T is 298K, and wt is the wild type complex. (B) In vitro ubiquitination assay was performed using UBC13/Mms2 (or dUBC13/Mms2) and RNF38. (C) Overlay of the 15N-edited HSQC spectra of free UBC13 (red) with different stoichiometric ratios of RNF38RING as given in the top left-hand side of the spectra. (D) Regions of the HSQC spectra are expanded to show the UBC13 and dUBC13 peaks during titration with RNF38RING. (E) The CSPs for each residue in UBC13 upon binding to RNF38RING. The orange and red dashed lines correspond to Mean + SD and Mean + 2*SD, respectively. The secondary structure alignment of UBC13 against its sequence is provided above the plot. (F) The CSPs for each residue in dUBC13 upon binding to RNF38RING. The dashed lines are replicated from (E). Significant CSPs were mapped on the UBC13 and dUBC13 structure using both the (G) ribbon and (H) surface representation. The UBC13 and dUBC13 are colored in light blue. The residues with CSPs above Mean + SD and Mean + 2*SD are colored in orange and red, respectively. The RNF38RING domain is surface rendered and colored in magenta. (I) The measured dissociation constants of UBC13 and its mutants with RNF38RING domain are given as Mean+/-SD. The difference in binding is calculated as in A).

Figure 9—figure supplement 1. R14-mediated intermolecular salt-bridges observed in crystallographic complexes of UBC13 with RING domains of other E3s.
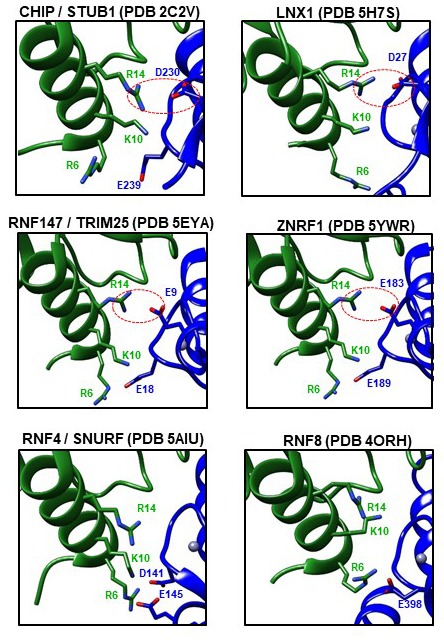
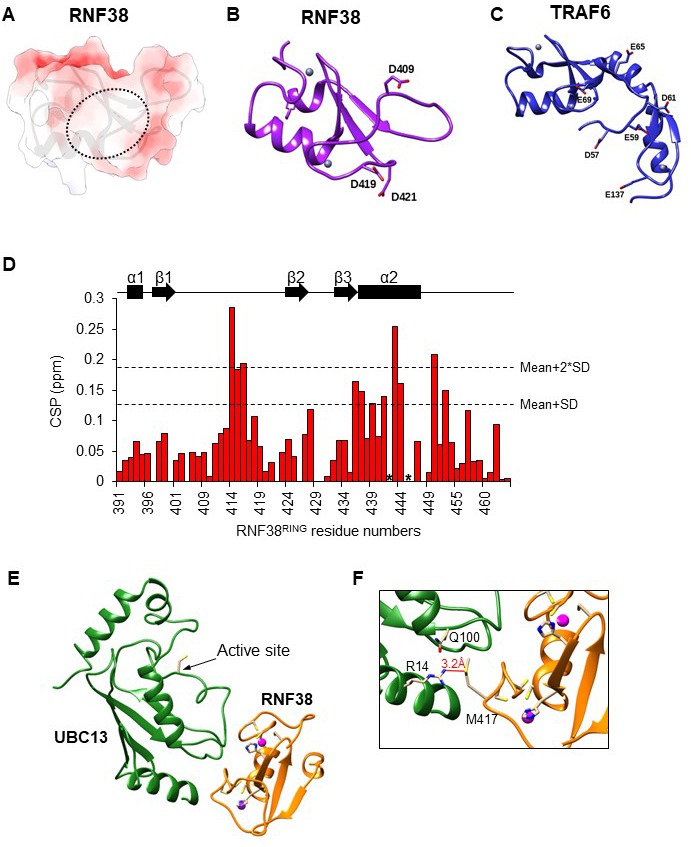
Figure 9—figure supplement 2. Analysis of UBC13/RNF38RING structure and charge distribution at and near the interface of RNF38/TRAF6RING.