Abstract
Sonic hedgehog (Shh) is a multifunctional signaling protein governing pattern formation, proliferation and cell survival during embryogenesis. In the adult brain, Shh has neurotrophic function and is implicated in hippocampal neurogenesis but the cellular source of Shh in the hippocampus remains ill defined. Here, we utilize a gene expression tracer allele of Shh (Shh-nlacZ) which allowed the identification of a subpopulation of hilar neurons known as mossy cells (MCs) as a prominent and dynamic source of Shh within the dentate gyrus. AAV-Cre mediated ablation of Shh in the adult dentate gyrus led to a marked degeneration of MCs. Conversely, chemical stimulation of hippocampal neurons using the epileptogenic agent kainic acid (KA) increased the number of Shh+ MCs indicating that the expression of Shh by MCs confers a survival advantage during the response to excitotoxic insults. In addition, ablation of Shh in the adult dentate gyrus led to increased neural precursor cell proliferation and their migration into the subgranular cell layer demonstrating that MCs-generated Shh is a key modulator of hippocampal neurogenesis.
Subject terms: Epilepsy, Molecular medicine
Introduction
Graded Sonic Hedgehog (Shh) signaling is a crucial regulator of cell proliferation, cell fate determination and migration, leading to cell diversification and congruent growth during early nervous system development1. In the adult brain, the Shh receptor Patched (Ptc) is expressed by neural stem cells (“B”-cells) and rapidly amplifying (“C”-cells) within the neurogenic niches of the subventricular zone (SVZ, forebrain) and subgranular zone (SGZ, hippocampus)2. Consistently, Shh is critically involved in B-cell maintenance and -profileration and in C-cell fate determination in the neurogenic niches of the adult forebrain and the hippocampus3–5. Whether neurogenic activity is controlled by physiological needs remains an active area of research. Variable Shh signaling strength within the germinal niche can determine the rate of neurogenesis and the type of cells being produced2. A critical step in investigating whether neurogenic outcome could be adapted to need is therefore the identification of the cellular source of Shh and the determination whether Shh expression is variable. The relevant cellular source of Shh for adult hippocampal neurogenesis, however, remains ill defined.
Shh was found to be expressed in calretinin positive neurons (CR+) of the hilus in the dorsal DG but not in the ventral DG in the early post-natal brain at P156. The deletion of Shh from these CR+ cells was associated with a significant decrease in proliferation and the number neuronal stem cells (NSCs)6. Whether these neurons express Shh in the adult hippocampus has not been studied. In contrast, immunohistochemical analysis has suggested that pyramidal neurons7 or astrocytes8 might express Shh in the adult hippocampus. However, the failure to detect Shh mRNA in the hippocampus by in situ hybridization early studies, led some authors to propose that Shh could originate outside of the hippocampus. Thus, the protein would be produced by neurons in the basal forebrain cholinergic nucleus VDB9,10 where Shh transcription is abundant and anterogradely transported to the SGZ via the fimbria–fornix pathway3.
The difficulties associated with the identification of Shh cellular sources in the hippocampus might stem from the fact that Shh is a secreted protein. The presence of axonal transport signals in the Shh mRNA and protein sequence11 and the release of Shh from axons as well as from the somato-dendritic compartment12, yielding low and difficult to detect concentrations of both Shh mRNA and protein in the soma of Shh producing neurons. Furthermore, the Shh protein may accumulate in target cells that could easily be misidentified as sources12. We therefore re-examined the expression of Shh within the hippocampus using a sensitive Shh gene expression tracer allele which marks nuclei of Shh expressing cells by nuclear targeted lacZ and allows selective identification of cells in which the Shh locus is transcriptionally active. This reporter was used previously to discover that mesencephalic dopamine neurons are a significant source of Shh throughout adulthood in the forebrain13.
Mossy cells (MCs) constitutes a major population of CR+ neurons in the dentate gyrus (DG) of the hippocampus14. Extensive research has been performed to characterize MCs, but many of their functional and morphological properties remain elusive15. MCs are usually described as glutamatergic neurons that may exert feed-forward inhibition onto granular cells (GC) through GABAergic neurons16,17. However, no consensus has been reached as to whether the net effect of mossy cells on GCs is excitatory or inhibitory15,18,19. Many investigators assume that thorny excrescences define MCs, but there are spiny hilar cells without thorns that have the same physiological characteristics as ‘thorny’ MCs. Furthermore, MCs vary in their expression of neurochemical markers such as calretinin which is expressed in ventral but not dorsal mossy cells in mice (for review15).
Mossy cells could be implicated in SGZ neurogenesis driving glutamate and GABA transmission at different phases of granular cell development, but few studies have investigated specific interactions between MCs and neurogenesis in the adult brain15. Recently, Yeh et al.20 reported that MCs may control NSC quiescence through glutamatergic and GABAergic signaling. However, the notion that MCs could deliver Shh onto the NSCs as a possible activity-dependent regulatory mechanism of neurogenesis has not been explored so far.
Using a Shh-nlacZ genetic reporter13 we demonstrate here that Shh is expressed by most hilar MCs in the adult brain of mice. We find that Shh is expressed by most MCs and that these cells co- express GABA and glutamatergic markers. Shh expression reduces excitotoxicity of MCs in response to kainate induced epilepsy. Conversely, genetic ablation of Shh from hilar cells results in decreased numbers of MCs but increased migration of newly born neuronal precursor cells into the granular cell layer. Together, our results suggest that Shh expression in adult MCs serves as a neuro-protectant for MCs, as a chemo attractant for immature neuronal precursor cells that ectopically migrate to the hilus to become CR+ cells during induced excitotoxicity, and as an inhibitor of neuronal cell fates that home to the granular cell layer.
Results
Calretinin expressing GABAergic neurons are the source of Shh in the hippocampus
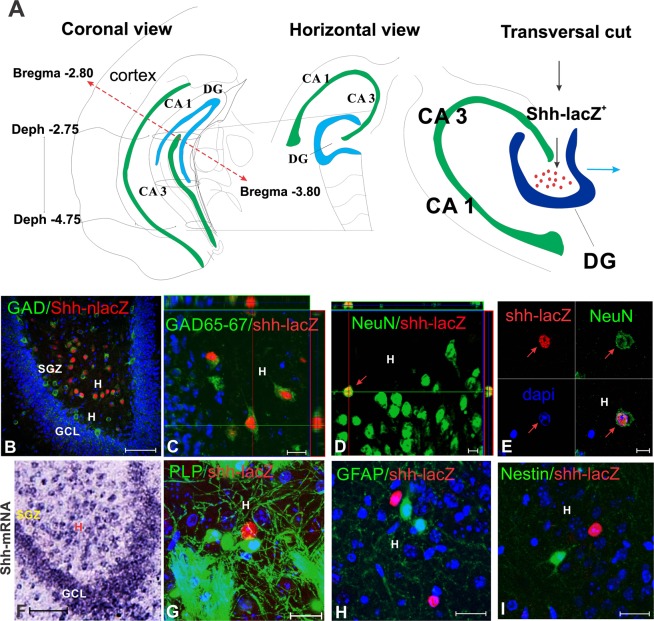
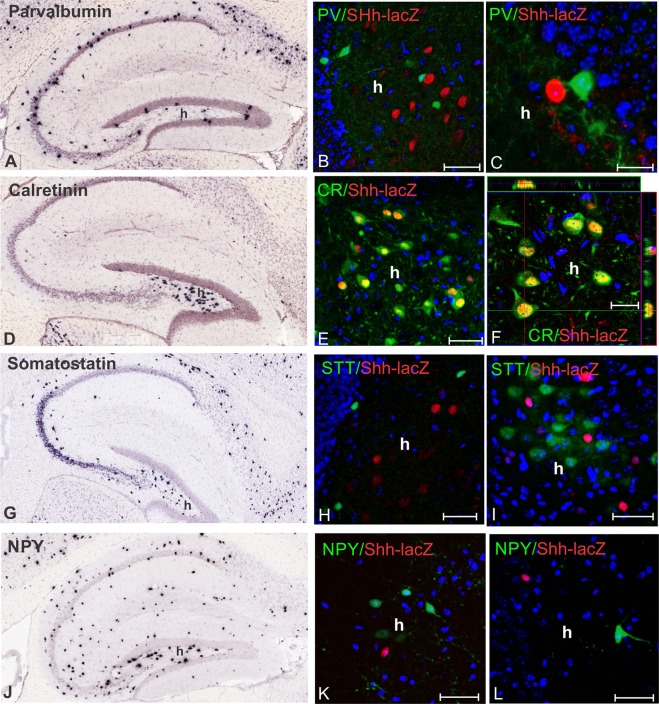
To identify the cells that produce Shh in the DG, we first visualized expression of Shh in the adult brain using mice homozygous for a gene expression tracer allele of Shh (Shh-nlacZ+/+)13. Here Shh and nucleus-targeted LacZ is transcribed into a bi-cistronic mRNA from the endogenous Shh locus such that all cells that express Shh are also marked by nuclear localized betaGal allowing sensitive chromogenic and fluorescent immunohistochemical analysis of Shh expression with single cell resolution. The use of anti-beta galactosidase antibodies in combination with cell type specific markers demonstrated that Shh is not produced by oligodendrocytes (PLP-EGFP, Fig. 1G and Table 1), astrocytes (GFAP, Fig. 1H and Table 1) or immature cells (Nestin, Fig. 1I and Table 1) but only by mature neurons (NeuN, Fig. 1D,E and Table 1). Most nlacZ+ neurons co-express GAD-65/67 (Fig. 1B,C, Table 1) and form a pattern similar to that seen by recent in situ hybridization for Shh (Fig. 1F, Allen Atlas21). We next investigated which sub-type of GABAergic neuron would express Shh. We stained brain sections from animals carrying the Shh-nlacZ allele with antibodies for parvalbumin (PV), somatostatin (STT), neuropeptide Y (NPY), and calretinin (CR), which are GABAergic neuronal subtypes present in the DG (Fig. 2) and as revealed by in situ hybridization (Allen Atlas21). We found that among all the cells that express the Shh-nlacZ tracer allele, 98.1 ± 8.4% co-expressed CR and, conversely, among cells expressing CR, 72.4 ± 3.9% expressed the Shh-nlacZ tracer (Fig. 2E,F, Table 1). The CR+ Shh-nlacZ+ cells exhibited a multipolar morphology containing large polygonal somata (diameter ≈ 20 μm) with abundant primary axodendritic arborizations forming a dense network within the hilus. We did not find any other GABAergic neuronal subtypes among the cells expressing Shh.
Figure 1.
Shh is expressed locally in the hilus of the DG by GABAergic neurons in the adult brain (P60) (for quantification see Table 1). (A) From horizontal slices of the brain, we examine the whole ventral portion of the dentate gyrus. The horizontal brain slices yield transverse sections of the ventral portion of the hippocampus. (B) Low magnification confocal image of the hippocampus (transverse section) stained for GAD 65/67 and Shh-nlacZ showed that GABAergic neurons (stained for GAD 65/67) co-express Shh-nlacZ tracer. (25X, bar 100 µm). (C) Co-localization of Shh-nlacZ and GAD 65/67 at high magnification (100X, bar 20 µm) including an orthogonal view. (D) Shh-nlacZ positive cells were co-label with NeuN in the hilus near the granular cell layer (63X, bar 10 µm). (E) Confocal image of a cell located in the central field of the hilus on separated channels to show nuclear co-localization of Shh-nlacZ and NeuN (63X, bar 10 µm). (F) In situ hybridization of Shh in the ventral hilus at P56 cropped from Allen atlas row images (http://mouse.brainmap.org)21 (Bar 100 µm). (G) A double transgenic mice reporter for oligodendrocyte (PLP-GFP) and Shh (Shh-nlacZ) show that hilar oligodendrocytes did not express nlacZ (63X, bar 10 µm). (H) GFAP staining showed no co-localization with Shh-nlacZ indicating that Shh mRNA is not expressed in astrocytes in the hilus (63X, bar 25 µm). (I) Nestin staining showed no colocalization with Shh-nlacZ indicating that immature cells do not express Shh mRNA in the hilus (63X, 20 µm). Abbr: GCL, granular cell layer; SGZ subgranular zone; H, hilus.
Table 1.
Stereological analysis of Shh reporter expression in different cell populations in the dentate gyrus.
| 1.Label* | 2.Cell Type | 3.No. cells label | 4.Label/LacZ | 5.Colocalization % Label/LacZ |
6.total LacZ | 7.Colocalization %LacZ/Label |
8.No. mice X slice |
|---|---|---|---|---|---|---|---|
| PLP | Oligodendrocytes | 760 ± 38.9 | 0 | 0 | n.q | 0 | 3x10 |
| GFAP | Astrocytes | 1013.3 ± 83.7 | 0 | 0 | n.q | 0 | 7x10 |
| NeuN | Neurons | 3834 ± 320 | 1120 ± 51.1 | 29.2 ± 1.3 | 1138.2 ± 56 | 98.4 ± 5.0 | 3x10 |
| CR | GABA subtype | 1574.3 ± 62.4 | 1140 ± 62.4 | 72.4 ± 3.9 | 1162.1 ± 91.2 | 98.1 ± 8.4 | 7x10 |
| SST | GABA subtype | 1062.5 ± 113.3 | 0 | 0 | n.q | 0 | 3x10 |
| PV | GABA subtype | 528.6 ± 69.9 | 0 | 0 | n.q | 0 | 3x10 |
| NPY | GABA subtype | 462.5 ± 40 | 0 | 0 | n.q | 0 | 3x10 |
| GAD 65/67 | GABAergic | 3433.3 ± 391.3 | 1114.3 ± 94.9 | 32.4 ± 2.8 | 1146.1 ± 81.3 | 97.2 ± 7.3 | 7x10 |
| GlutR2/3 | Glutamatergic | 3116.7 ± 188.8 | 1300.2 ± 77.5 | 41.7 ± 5.0 | 1370 ± 87.9 | 92.4 ± 9.2 | 6X10 |
The Shh-lacZ reporter was expressed in only in neural phenotypes NeuN, GAD 65/67,CR and GluR2/3 and CGRP. This analysis leads to conclude that Shh is exclusively express in mossy cells that express CR and GAD. % Cells labeled for a cell type that express lacZ (column 5) and, conversely, lacZ+ cells that express a cell type label (column 7) were quantified. (n.q.): lacZ cells were “not quantified” (column 6) when the reporter was absent in the cell type of interest (column 4). The number of cells were estimated stereologically13 (see methods). *PLP (proteolipid protein), GFAP (glial fibrillary acidic protein), NeuN (neuronal nuclei), CR (calretinin), SST (somatostatin), PV (parvalbumin), NPY (neuropeptide Y), GAD (glutamic acid decarboxylase), GluR2/3 (Glutamatergic receptor 2 and 3).
Figure 2.
GABAergic neurons expressing Shh-nlacZ-mRNA are calretinin immunoreactive (for quantification see Table 1). (A) In situ hybridization in a control mouse showing parvalbumin expression pattern in the hippocampus; (B,C) Antibody staining for parvalbumin (PV) and Shh-nlacZ in the hilus. PV and Shh-nlcZ, show no colocalization (B, 25X, bar 50 µm; C, 63X, 20 µm). (D) In situ hybridization showing calretinin expression pattern in the hippocampus. (E,F) Immunostaining for calretinin and Shh-nlacZ in the hilus showing colocalization (E, 25, bar 50 µm; F, 63X, 20 µm). (G) In situ hybridization showing somatostatin expression pattern in the hippocampus. (H,I) Immunostaining for somatostatin and Shh-nlacZ in the hilus showing no colocalization (25X, bars 50 µm). (J) In situ hybridization showing NPY expression pattern in the hippocampus. (K,L) Immunostaining for NPY and Shh-nlacZ (see Table 1) in the hilus shows no colocalization. (K, 25X, bars 50 µm). In situ hybridization images were obtained from Allen Mouse Brain Atlas (http://mouse.brain-map.org)21. Abbr: h, hilus.
CR+ neurons that express Shh in the adult hippocampus are mossy cells (MC)
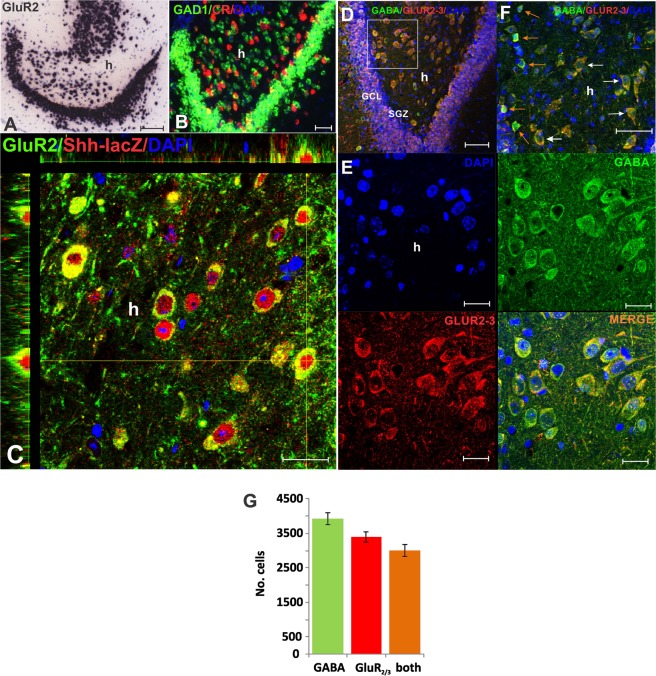
We next determined whether the cell population described here were mossy cells (MCs), a prominent subpopulation of CR+ cells with elusive function. We found that cells expressing Shh-nlacZ co-localize with glutamate receptor 2/3 (GluR2/3) expression, a marker for MCs (Fig. 3C, Table 1). Among the GluR2/3+ neurons, 41.7% were Shh-nlacZ+ (Table 1, columm- 5), and among Shh-nlacZ+, 92.4% were Glut R 2/3+ (Table 1, column-7). Further, over 90% of the cells expressing Shh-nlacZ are labeled for both CR and GlutR2/3 markers (Table 1, column-7). Consistent with the immunohistochemical staining, the GluR2 mRNA in situ hybridization image cropped from the Allen atlas21 (Fig. 3A) resembles the distribution of Shh-nlacZ+ or CR+ cells in the hilus. Further, the majority of α-GluR2/3 stained soma colocalized with GABA in the hilus (Fig. 3D–F). Consistently, double-color fluorescence in situ hybridization (FISH) for CR (Calb2-IRES-Cre) and GAD1, show that most hilar CR+ cells (≈75%) express GAD-1 mRNA (Fig. 3B) (Allen Atlas21). Therefore, based on their distribution, morphologic features and staining for CR, GluR2/3, these results reveal that MCs remain as a prominent source of Shh in the adult hippocampus. The prevailing view is that CR and GluR2/3 are markers for mossy cells while MCs are thought to be non-immunoreactive to GABA markers. To further test the notion that MCs may express GABA, we decided to use another mossy cell-specific marker named calcitonin gene-related peptide (CGRP)15,22,23. We found that about 80% of the CGRP+ cells colocalize with GABA (Supplemental Fig. S2). As the three MC markers (CR, GluR2/3 and CGRP) highly colocalize with GABA, it follows that mossy cells also express GABA even if these cells are not functionally GABAergic (see below).
Figure 3.
The Mossy cell identity is corroborated by reactivity to GluR2/3 antibodies. (A) Pattern of expression of GluR2 mRNA as revealed by in situ hybridization (http://mouse.brain-map.org)21, which resemble the expression of Shh-nlacZ and CR+ cells (bar 100 m) (mouse P57) (Bar = 100 µm). (B) Double fluorescent in situ hybridization for GAD1 and CR (http://mouse.brain-map.org)21 showing colocalization of the two mRNAs (CR/GAD-1 = 71.8 ± 5.2%; GAD-1/CR = 50.2 ± 2.4%,estimated from 2 mice, P56) (Bar = 45 µm). (C) IHC staining for GluR2/3 and Shh-nlacZ showing an orthogonal view to demonstrate colocalization (see Table 1, columm-7). (100X, Bar = 20 µm). For the cell numbers marked by GluR 2/3 and LacZ see Table 1. (D) Staining for GluR2/3 and GABA confirm the colocalization, revealing that mossy cells are immunoreactive to GABA. (20X, bar = 50 µm). (E) Zoom into D (100X) showing hilar neurons different channels confirming colocalization of GluR2/3 and GABA at high magnification (100X, bar = 20μm). (F) An additional double fluorescent IHC section that shows GABA and GluR2/3 colocalization, and high (orange arrow) and low (white arrow) levels of GABA staining in cell positive for both GluR2/3 and GABA or cells that are only immunoreactive to GABA (40X, bar = 50μm). (G) Analysis of the GABA and GluR2/3 co-expression show that a 76.5% of GABA+ cells colocalized with GluR2/3; while an 88.3% of GlutR2/3+ cells colocalized with GABA. (n = 3 mice × 10 slices). Abbr: GCL, granular cell layer; SGZ subgranular zone; and h, hilus.
Mossy cells that produce Shh are resistant to KA toxicity
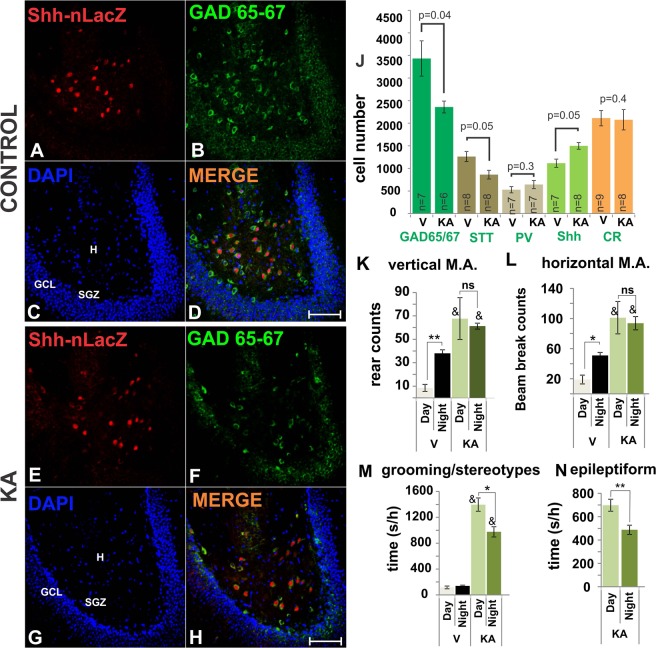
We next sought to evaluate whether MCs expressing Shh were endowed with greater resistance to kainic acid (KA), a neurotoxic and epileptogenic agent, compared to GABAergic cells that do not express Shh. Shh-nlacZ mice were injected with increasing doses of KA (IP 5 mg/kg/h) to a maximum of 35 mg/kg until status epilepticus was reached (Racine’s stage 4/5)24. The behavioral assessment of the animals during the second week after KA injections revealed increased motor activity, exaggerated grooming, stereotypes and epileptiform jumping, shaking and forelimb clonus (Hyperexcitability or Racine’s stage 3) (Fig. 4K–N). These observations indicated that at this point the animals have not achieved full development of the epileptic phenotype but rather were engaged in an epileptogenic process. To characterize this stage, histological changes were studied in these animals and to avoid confounding effects derived of the stereotaxic surgery and electrode implantation, the electrophysiological effects of the KA injection were studied in a separated group of mice subject to the same procedure. The behavioral changes shown in Fig. 4 parallel the increased neural activity in the hippocampus as shown by EEG recordings (Supplemental Fig. S1). The EEG also showed typical interictal activity consistent in high-amplitude bursting and hyper-synchronized spiking in KA-injected animals, which are specific abnormalities associated with the epileptogenic stage.
Figure 4.
KA administration induces loss of large number of GABA cells but GABAergic Shh-nlacZ+ neurons seem unaffected. (A–D) Shh-nlacZ+ GAD 65/67+ neurons in the DG of control animals showing co-localization (25X, bar 100 µm). Note the full complement of cells expressing Shh-lacZ in the hilus (red channel). (E–H) The number of Shh-nlacZ+ neurons did not decrease while the number of GAD 65/67+ neurons appears to diminish at 2 weeks following KA injections (25X, bar 100 µm). (J) Cells expressing Shh-nlacZ were up-regulated, while the overall expression of GAD 65/67 decreased. GABAergic subtypes included PV, parvalbumin; SST, somatostatin; CR, calretinin and Shh, sonic hedgehog. Examples of these staining are provided in Fig. 2. (p values correspond to Unpaired Student’s t-Test). (K–N) Behavior was analyzed on the second week after injection, scores correspond to average counts/h or seconds/h of a given behavior for 7 days, 4 h/day(12–4 pm) and 4 h/night (12–4am). *p < 0.01, **p < 0.001, night vs. day; & p < 0.001 KA vs. vehicle group. Epileptiform activity was always equal or lower than stage 3 (mouse forelimb clonus without rearing) (n = 6/group). Abbr: GCL, granular cell layer; SGZ subgranular zone; H, hilus; M.A., motor activity.
Two weeks after KA injections animals were euthanized and their brains were processed for immunohistochemistry (IHC). We stained for nlacZ and GABAergic markers in the hippocampus. The level of Shh expression per cell as measured by the stained surface area and fluorescence intensity of the nlacZ immunostaining did not differ between the groups [surface area stained by nlacZ for vehicle, 63.2 ± 6.4 and for KA, 60.2 ± 5.5, T-test, p = 0.7; Normalized O.D for vehicle, 100 ± 9.5 and for KA, 97 ± 7.5, T-test, p = 0.4; based on 1029 cells (Veh) and 933 cells (KA), n = 3 mouse × 10 slices]. Interestingly, despite a decrease of about 40% (p = 0.04, Student’s t-test, Fig. 4H,J) of the numbers of GAD-65/67+ cells, the amount of GABA cells expressing Shh-nlacZ was increased by about 20% (p = 0.05, Student’s t-test, Fig. 4J) compared to controls. The total number of CR+ cells was unchanged in the KA treated animals. The increase in the prevalence of Shh+ cells among GABAergic neurons in the face of KA dependent neuronal degeneration suggests that Shh expressing cells are more resistant to excitotoxicity than Shh negative neurons, or that KA induces (1) the expression of Shh in previously Shh negative neurons or (2) the de novo differentiation of Shh expressing neurons.
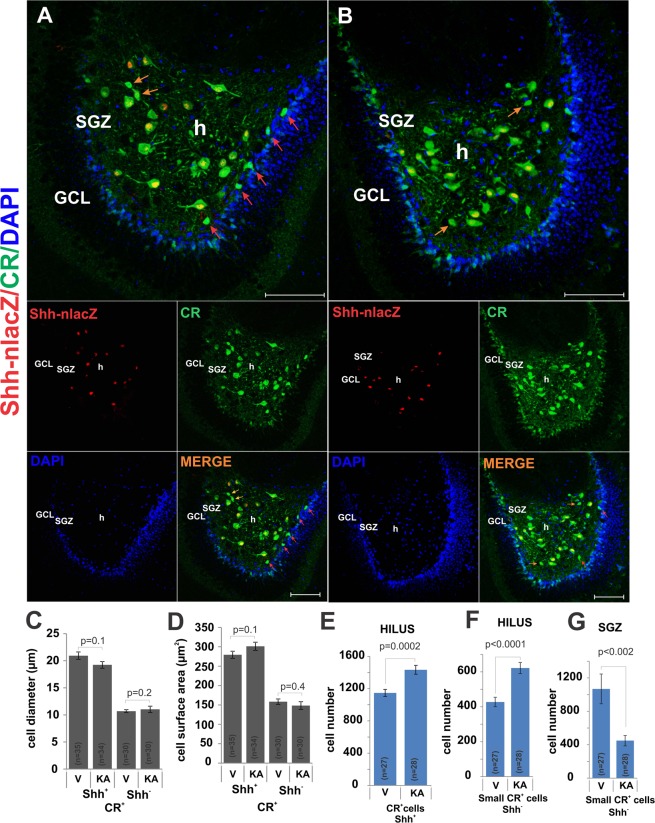
To distinguish these possibilities, we focused on CR+ cells and determined the morphological characteristics and locations of CR+Shh− and CR+Shh+ neurons in the hippocampus of untreated animals. As quantified above, a minority of CR+ cells do not express Shh (Fig. 4J). These Shh-cells are located in the hilus where they make up 14% of all CR+ cells and in the SGZ where they make up 35% of all CR+ cells (Fig. 5). These two CR+Shh− groups differ from Shh+CR+ neurons by morphology. CR+Shh− neurons exhibited small round somata (diameter 10.7 ± 0.3 μm, surface area ≈ 150 μm2; Fig. 5C) and small dendritic arborizations, while the CR+ Shh+ neurons possessed a larger somata (diameter 20.9 ± 0.7 μm, surface area ≈300 μm2) and abundant primary axodendritic arborizations. KA treatment increased the number of both large CR+Shh+ multipolar neurons and small round CR+Shh− cells in the hilus (Fig. 5A,B E,F) but decreased the number of small CR+Shh− neurons in the SGZ (Fig. 5G). These findings are in line with previous results that revealed that the number of hilar CR+ cells increased 2.5 times in mice injected with intra-DG KA25.
Figure 5.
KA administration altered the proportion of CR+ cell subtypes in the SGZ and hilus. (A) [Control] Shh-nlacZ+ and CR+ neurons in the DG of control animals showing co-localization (25X, bar 100 µm). (B) [KA] The number of CR+ Shh-nlacZ+ neurons in the KA group seems to be unaffected relative to controls (25X, bar 100 µm). Note that the small CR+ cells in SGZ (red arrows in A) have decreased in the SGZ as compared with controls (A), while the number of small CR+ cells in the hilus (some example show by yellow arrows) appears to increase. (C,D) CR+ Shh-nlacZ+ neurons have greater diameter and surface area than CR+ Shh-nlacZ- neurons. These parameters were not affected by KA treatment. (E,F) The number of large CR+ Shh-nlacZ+ cells as well as small CR+ Shh-nlacZ- cells from the hilus increased following KA injection. (G) The number of small CR+ Shh-nlacZ- cells from SGZ decreased in the KA group. (p values correspond to Unpaired Student’s t-Test). Abbr: GCL, granular cell layer; SGZ subgranular zone; and h, hilus.
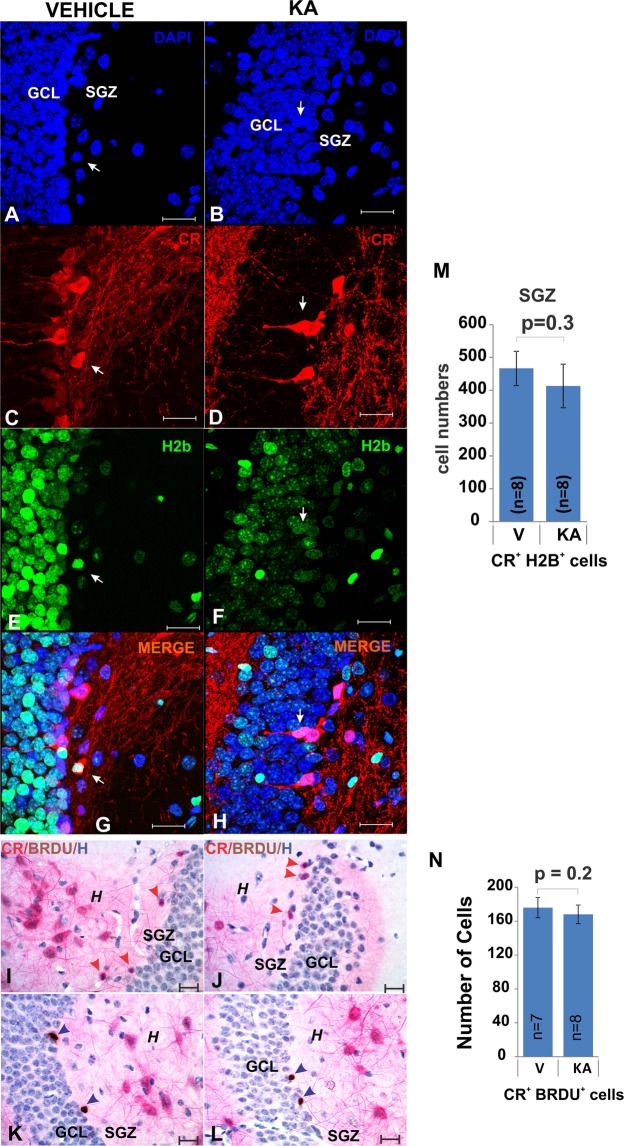
We tested next whether the increase of CR+ cells in the hilus might have been caused by increased neurogenesis. In agreement with previous reports26–28, however, we did not find increased numbers of cells expressing the mitosis marker phosphorylated Histone 2B (pH2B) (Fig. 6A–H,M), or that had incorporated the nucleotide analog BrdU (Fig. 6I–L,N) in the SGZ suggesting that KA treatment did not induce an increase in the rate of neurogenesis. Therefore, in the absence of increased proliferation, our observations suggest that KA might induce increased migration of immature, small CR+ cells from the SGZ into the hilus where they mature into large CR+Shh+ neurons. This possibility is consistent with the previous finding of ectopic migration of newborn cells from the SGZ to the hilus in the KA model29 and with the increase in CR+ neurons following KA administration25.
Figure 6.
KA treatment did not affect SGZ proliferation. (A–H) and (M). The number of CR+ cells that co-localize with the H2B-eGFP (mitotic marker) (white arrows) nuclear signal did not increase in KA-injected animals at 2 weeks after KA injections (60X, bar 20 µm). (For H2B-eGFP see Methods-transgenic animals). (I–J) and (N). The number of small CR cells in the SGZ that co-express BRDU (which was injected 7 days before brain perfusion) did not differ between controls and KA-injected animals. Chromogenic staining using antibodies for calretinin and BRDU (hematoxylin as counterstain) showing examples of CR+ BRDU+ cells (red arrowheads) (newborn post-mitotic neurons in the SGZ) (60X, bar 20 µm). (K,L) The number of SGZ BRDU+ cells (BRDU was injected 7 days before brain perfusion) was not different between controls and KA-injected animals. The staining was the same as in I-J-above (60X, bar 20 µm). Abbr: GCL, granular cell layer; SGZ subgranular zone; and h, hilus.
The Shh signaling effector Smoothened is not expressed by CR+ neurons under normal conditions
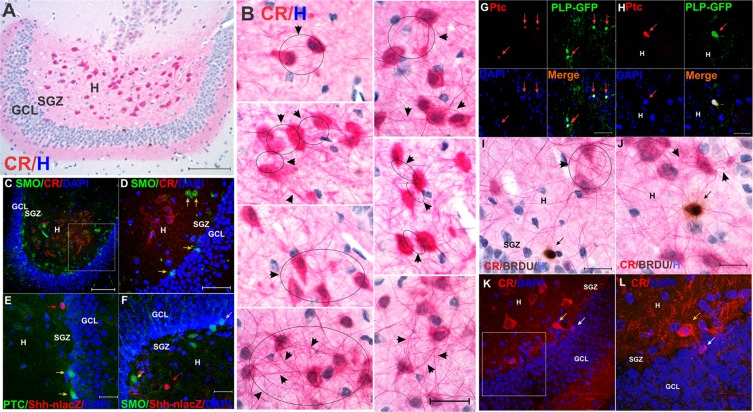
The Shh receptor Ptc and the obligate necessary Shh signaling effector Smoothened (Smo) are expressed in the SGZ on neuronal progenitors3,4. Calretinin based chromogenic staining (Fig. 7) showed profuse reciprocal innervation between CR+ cells (Fig. 7B), as described previously by Gulyás et al.30, as well as CR+ innervation of both SGZ (Fig. 7I) and hilar progenitors20 (Fig. 7J). Interestingly, hilar CR+ neurons innervate immature CR+ cells in the SGZ (Fig. 7K-L). Because of this pattern of reciprocal innervation observed between CR+ neurons, we wanted to investigate whether hilar CR+ neurons were able to perceive Shh signaling and therefore might not only act as a source but also as a target for Shh signaling. Staining of CR+ cells in the hilus (Fig. 7C,D) for Ptc (Fig. 7E) and Smo (Fig. 7F) revealed no co-expression with Shh-nlacZ. In contrast, oligodendrocytes (PLP+ cells) did not express Shh-nlacZ (Table 1), but Ptc suggesting that these cells are likely local recipients of Shh signaling in the untreated brain (Fig. 7G,H). These results indicate a paracrine mode of Shh signaling that originates from hilar MCs in the untreated DG (Fig. 7, Table 1).
Figure 7.
Pattern of reciprocal innervation of ventral DG CR+ cells and expression of Shh receptors. (For quantification see Table 1). (A) Panoramic view showing abundant numbers or large CR+ neurons in the ventral DG (10X, bar 100 µm). (B) Detailed view of CR cells and their axonal/dendritic processes, showing profuse reciprocal connectivity (arrow-circles and arrowheads), which is a typical feature of CR (60X, bar 50 µm). (C) Expression of Smo and CR is segregated in the hilus. Most CR+ cells are located in the central hilus, while Smo+ cells are located in the peripheral SGZ (25X, bar 100 µm). (D) Close-up of C showing Smo positive cells (yellow arrows) in the SGZ (25X, bar 50 µm). (E) Shh-nlacZ (red arrow) and Ptc-1 (yellow arrow) do not co-express in the DG (for quantification see Table 1) suggesting separated cellular sources (63X, 25 µm). (F) Shh-nlacZ (red arrow) and Smo (yellow arrow) do not co-express in the DG (for quantification see Table 1) suggesting independent cellular sources (63X, 25 µm). (G) Ptc-1 is expressed by olidodendrocytes (PLP/Shh-nlacZ, 92.1 ± 4.7%, n = 3 × 10 slices) that do not co-express Shh (see Fig. 1D) (40X, bar 50 µm). (H) Larger magnification as in G (63X, bar 20 µm). (I) Hilar CR+ projections innervating a BRDU+ progenitor (black arrow) in the SGZ. Immunohistochemistry was performed with chromogenic staining for CR (Vulcan Fast Red), BRDU (DAB) and hematoxylin (H) as counterstaining (60X, bar 20 µm) (arrowheads and circle also show reciprocal innervation). (J) Hilar CR+ projections innervating a BRDU+ progenitor (black arrow) located in the central hilus. Immunohistochemistry was performed with chromogenic staining as in I (60X, bar 20 µm). (arrowheads show reciprocal innervations as in I). (K) Example of a calretinin (CR+) neuron from the hilus (yellow arrow) innervating a SGZ CR+ neural progenitors (white arrow) (63X, bar 50 µm). This suggests that CR+ neurons from the hilus innervate CR+ SGZ newborn neurons. (L) Close-up of K showing innervation of a CR+ progenitor (white arrow) by a CR+ neuron (yellow arrow) (63X, bar 20 µm). Abbr: DG dentate gyrus; GCL, granular cell layer; SGZ subgranular zone.
KA alters the pattern of Smo expression in the hilus
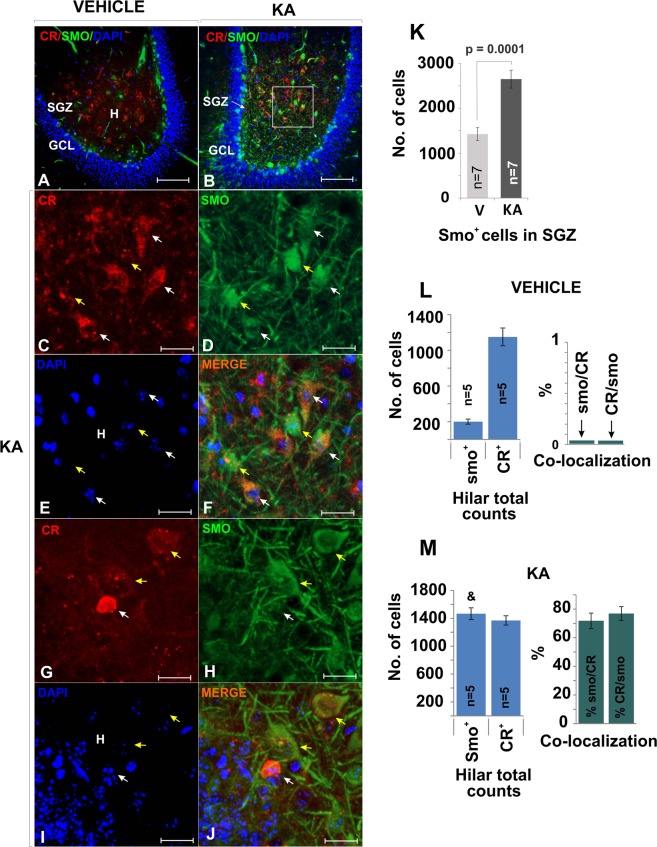
Guided by results that revealed that the expression of Smo in the Hippocampus can be altered by electroconvulsive seizures10, we next tested whether KA treatment alters the expression of Smo. In vehicle treated animals CR and Smo did not co-localize (Figs 7 and 8A), but in the KA-treated animals Smo expression was upregulated in the hilus and SGZ (Fig. 8B–J,K) (Smo/CR, CR/Smo ≈70%) (Fig. 8M). These observations suggested that under KA-induced hyper-excitability, CR+ cells become receptive to Shh signaling, which may enhance the survival capacity of these CR+ cells.
Figure 8.
Smo is expressed by hilar CR+ cells following KA treatment. (A,B) The Shh downstream molecule Smo was up-regulated in animals that received KA injections. In A, smo is preferentially detected in the SGZ but in B Smo and CR staining colocalized in many cells in the central hilus. (25X, scale bar 100 µm). (C–F) High magnification as in B (63X, bar 25 µm). Example of cells that express smo but do not express CR (white arrow) and CR+ cells that express both Smo and CR (yellow arrow). (G–J) More examples at high mag (63X, bar 25 µm) of cells that expresses smo but does not express CR (white arrow) and cells that express both Smo and CR (yellow arrow). Note that the small CR+ cell showing high intensity for CR and very weak staining for Smo is an SGZ-immature neuron. (K) Smo was significantly up-regulated in the SGZ in animals receiving an epileptogenic dose of KA. (L,M) Both Smo-CR and CR-Smo co-localization increased from near 0% to about 70% in animals injected with KA. Quantification of cells in the hilus across the ventral hippocampus in vehicle treated mice show that Smo expression was relatively small (as in A, restricted to the SGZ). Smo and CR colocalization was not observed. The number of cells expressing Smo was significantly greater in KA treated mice (M) as compare to Vehicle (L)(&, KA vs. Control, p = 0.00001, student T-test), while CR+ cells number was unchanged. The co-localization of the two markers was higher in the hilus of KA treated mice (CR/Smo = 70%, Smo/CR = 70%). Abbr: GCL, granular cell layer; SGZ subgranular zone; and h, hilus.
Selective ablation of Shh expression in CR+ neurons leads to CR cell loss
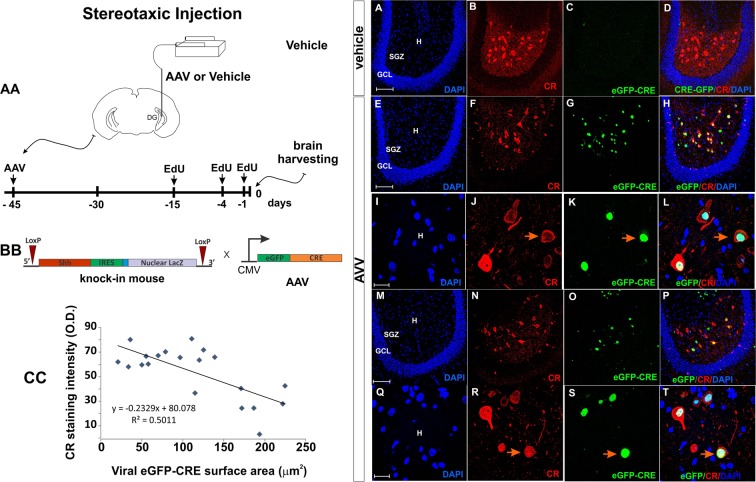
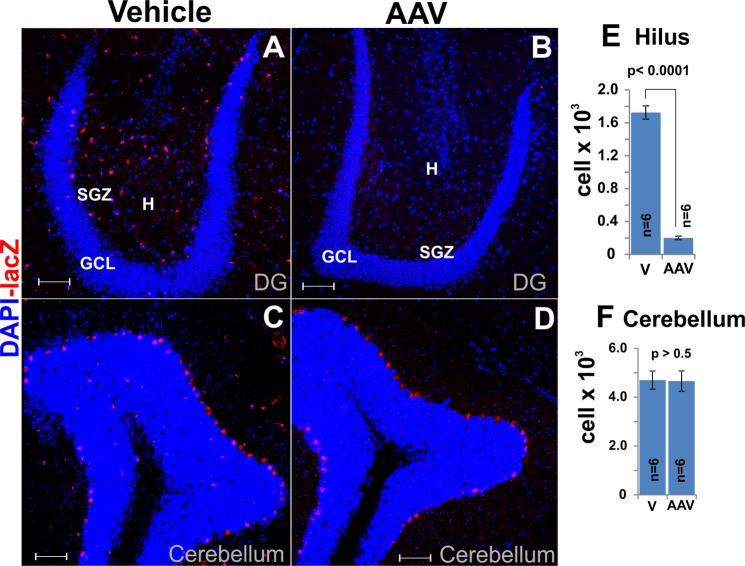
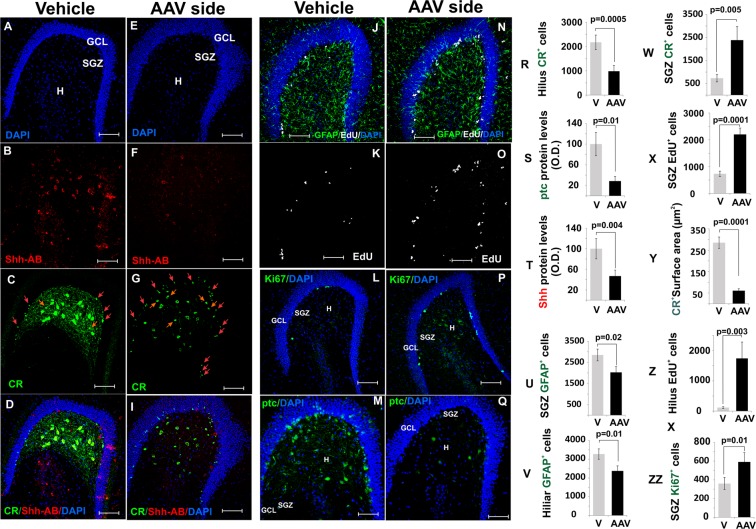
To test whether Shh was necessary for the survival of CR neurons, we injected an AAV9-eGFP-Cre virus into the DG of Shh-nlacZ mice to induce the ablation of the conditional Shh-nlacZ allele. (Fig. 9AA,BB). In this mouse line, Cre activity removes exons 2 and 3 of the Shh gene and the nlacZ marker producing a Shh null allele and allowing for convenient identification and quantification of cells with ablated Shh. At day 45 following virus injection, animals were euthanized, and their brains perfused for histological analysis. Quantification of viral expressed GFP revealed that the virus was expressed in CR+ cells in the central hilus (Fig. 9G,H,K,L). We observed a reduction in CR staining intensity inversely proportional to GFP expression (Fig. 9CC.G–T). The expression of nlacZ in the DG was almost completely abolished among infected cells as compared to controls (Fig. 10A,B and E), while nlacZ expression in the cerebellum was unchanged (Fig. 10C,D and F), revealing the anatomical selectivity and efficiency of the viral infection mediated ablation of Shh. As expected, there was a marked reduction of the Shh-protein detected by immunohistochemical staining in the AAV injected mice compared to control mice injected with vehicle in the same hemisphere (Fig. 11B,F and T). Further, and consistent with reduced Shh signaling strength, we found that the expression level of Ptc protein, a transcriptional target of Shh signaling31, was downregulated by 80% (Fig. 11M,Q and S). Quantification of CR+ cells showed a pronounced, 60%, reduction in CR+ cell numbers (Fig. 11C,G and R). The average surface area of hilar CR+ cells was also drastically reduced from 285.2 µm2 to 60.8 µm2 (Fig. 11Y). Taken together, these results indicate that viral Cre mediated ablation of Shh abolished most of the hilar Shh signaling, which, in turn, critically compromised survival and/or marker expression of hilar CR+ cells.
Figure 9.
Ablation of Shh using an AAV virus. (AA) Experimental design. The e-GFP-CRE AAV virus or vehicle was injected into the hilar region on one hippocampus (left side). Histological observations were made 45 days after the injections. EdU was administered 15, 4 and 1 days before euthanasia (See methods). (BB) Constructs of the Shh-nlacZ Knock-in and in the AAV vector. The expression of the virus in target cells will induce deletion of the Shh gene. (CC) Plot correlating the degree of viral infection as measured by the surface area of nuclear eGFP signal with CR staining intensity shows that cells that have greater infection levels express less CR. (A–H) Low magnification comparison between vehicle side and AAV injected side, 45 days after the injections of the AAV virus in the DG of Shh-nlacZ mice. The expression of the virus can be seen in G and how the virus targeted the CR+ neurons can be seen in H (20X, bar 100 µm). (I–L) High magnification images showing that the infection leads to reduced CR expression and cell loss (100X, bar 20 µm). (For quantification of CR cells see Fig. 11R). (M–P) Other examples at low mag as in E-H (20X, bar 100 µm). (Q–T) Other examples at high mag as in I-L (100X, bar 20 µm). Abbr: GCL, granular cell layer; SGZ subgranular zone; and H, hilus.
Figure 10.
Shh-nlacZ expression was selectively suppressed in the hilus in the AAV-injected side but unaffected in cerebellum Purkinje cells. (A,B) Shh-nlacZ tracer expression in the DG in the vehicle (A) and AAV-injected side (B) (20X, bar 100 m). The expression of lacZ was almost completely abolished in the injection site. (C,D) Shh-nlacZ tracer expression in the cerebellum in the vehicle (C) and AAV- injected (D) side (20X, bar 100 m). Note that Shh-nlacZ expression in the cerebellum was not affected by the virus injection in the DG. (E) Quantification of the number of cells positive for the Shh-nlacZ tracer in the DG (unpaired, two tailed t-test). (F) Quantification of number of cells positive for the Shh-nlacZ tracer in the cerebelum (unpaired, two tailed t-test). Abbr: GCL, granular cell layer; SGZ subgranular zone; and h, hilus.
Figure 11.
Effects of the Shh ablation on calretinin+ cells and proliferative markers. (20X, bar 100 um). (A–D) The vehicle-injected hippocampus show normal expression of Shh and CR proteins as detected by the antibodies (20X, bar 100 µm). (E–I) The AAV-injected hippocampus shows a substantial decrease of Shh levels and a striking reduction in size and numbers of CR+ cells. (20X, bar 100 µm). Also note the increase in small CR+ cells in the hilus (red arrows) and toward the hilus (yellow arrows) (see also T,W). (J–K) The vehicle-injected hippocampus shows normal expression of GFAP (glial cells) and EdU (20X, bar 100 µm). (N,O) The AAV-injected DG shows increased expression of EdU and a slight decrease in GFAP signaling (20X, bar 100 µm). (L,P) Ki67 also was found to be elevated in the AVV injected hilus (20X, bar 100 µm). (M,Q) Ptc protein expression decreased significantly followed the virus transfection (20X, bar 100 µm). (R–ZZ) Quantification of cells number and protein levels identify in the pictures above. The p scores correspond to unpaired (two tailed) t-test (n/group = 6). Abbr: GCL, granular cell layer; SGZ subgranular zone; and H, hilus.
Ablation of Shh in CR+ neurons results in increased SGZ proliferation and neurogenesis
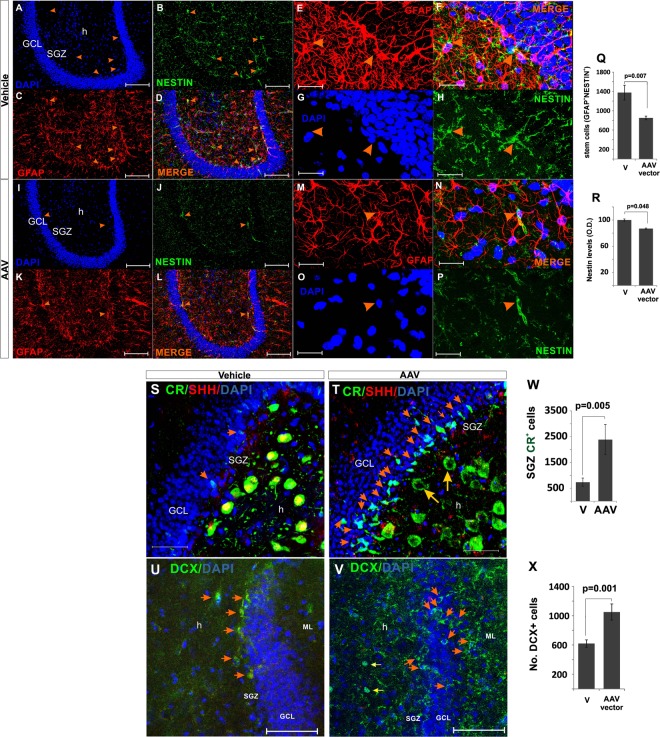
We next tested whether the ablation of Shh from hilar MCs would impact neurogenesis. Contrary to our expectations, the decrease in Shh expression in the hilus increased SGZ proliferation as shown by EdU incorporation (Fig. 11K,O and X) and Ki67 staining (Fig. 11L,P and ZZ). Quantification of GFAP+ cells in the hilus shows a moderate decrease in the number of GFAP+ cells in the virus-injected hilus leading to altered GFAP+ scaffolding in the SGZ (Fig. 11J,N and V) and reduced numbers of GFAP+, EdU+ NSCs (Fig. 12A–P and Q). Importantly, there was an increase in the number of small CR+ cells located in the SGZ (Fig. 12S,T and W). These small triangular CR+ cells in the SGZ and in the inner granular cell layer have been described as new born or immature neurons that transitorily express calretinin during maturation32,33. Consistently, we found an increase in the numbers of DCX+ cells (Fig. 12U,V and X), a marker for immature neurons34. Noteworthy, these newly formed CR+ and DCX+ cells were mostly located towards the granular cell layer (GCL) and the molecular layer (ML) (Fig. 12T,V) forming a pattern distinctly different from the increase in hilar CR+ cells observed during KA-induced epileptiform activity (Fig. 5B). Together, we find that the hilar ablation of Shh results in an increased production of neuronal precursor cells that migrate preferentially into the GCL while the KA induced up regulation of Shh expression is associated with migration of immature CR+ cells into the hilus from the GCL.
Figure 12.
Effects of the Shh ablation on the SGZ radial glia stem cells (NSCs) population and immature neurons. (A–D) Double labeled GFAP+ Nestin+ cells (radial glia NSCs) as observed in the vehicle injected side (20X, bar 100 µm). (E–H) High magnification showing some GFAP+ Nestin+ cells from A-D (100X, bar 20 µm). (I–L) Panoramic view showing that the number of radial glia NSCs was reduced in the AAV-injected DG (20X, bar 100 µm). (M–P) High magnification from I-L (100X, bar 10 µm). (Q) NSCs were reduced in the AAV-injected DG by 40%. (R) Nestin protein levels slightly dropped in the injected side. (S,T) Shh knock-down produced a substantial increase in small CR+ cells in the SGZ (orange arrows). Note the lack of Shh protein in CR+ cells in the AAV group in T (yellow arrows). (U,V) Shh knock-down also upregulate DCX signaling, increase in number of cells in the SGZ migrating to the ML (W–X) Quantification of small SGZ CR+ neurons (W) and DCX+ cells reveals increased neurogenesis in the AAV injected site. The p scores correspond to unpaired (two tailed) t-Test (n/group = 6). Abbr: GCL, granular cell layer; ML, molecular layer; SGZ, subgranular zone; and h, hilus.
Discussion
Here we identified hilar MCs as a prominent source of Shh within the adult hippocampus. Our data indicates that Shh signaling originating from MCs is critical for their survival upon excitotoxic insults and the modulation of dentate gyrus neurogenesis.
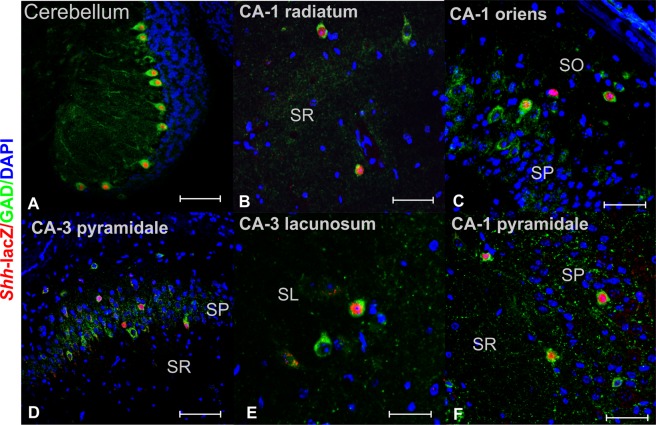
These studies were enabled by a sensitive gene expression tracer allele for Shh which was produced by homologous recombination resulting in the continuous bicistronic transcription of Shh and nlacZ genes under the control of the endogenous Shh promoter13. The faithfulness of this recombinant allele during development and in the adult brain was extensively verified13,35–40. A recent study by Ortega et al.41 confirms the pattern of Shh expression from the wt allele and from the gene expression tracer allele in the nigro-striatal system. Likewise, in the cerebellum, Shh-nlacZ was consistently expressed in large GABAergic neurons known as Purkinje cells (Fig. 13A), in agreement with previous reports42, further corroborating the fidelity of the Shh-nlacZ gene expression tracer allele. Using this gene expression tracer allele we found that among Shh-nlacZ+ cells in the hilus, more than 90% co-expressed calretinin (CR) and GluR 2/3, the neurochemical signature of mossy cells. Among all CR+ neurons, only the large multipolar neurons in the hilus, which traditionally have been considered mossy cells14, expressed Shh.
Figure 13.
Shh-nlacZ expression in the hippocampus and cerebellum was restricted to GABAergic interneurons. (A) Panoramic view of cerebellum folia showing the expression of Shh-nlacZ in GABAergic Purkinje neurons (25X, bar 100 µm). (B–F) Overall view of CA1 and CA3 regions of the hippocampus showing expression of Shh-lacZ restricted to sparse GABAergic cells. The cellular sub-type was not CR, PV, NPY or STT positive (remains unknown). All imagines were 25X (B and D bar = 100 µm) (C, E and F bar = 50 µm). Abbr: SR, stratum radiatum; SP, stratum pyramidale; SO, stratum oriens; SL Stratum lacunosum; CA1, Cornu Ammonis-1; CA3, Cornu Ammonis- 3.
Mossy cells are the only excitatory cell type in the hippocampus that can be considered a type of “feedback interneuron”43. In fact, some authors have cataloged MCs as excitatory interneurons44,45. As an interneuron, a single MC receives convergent inputs from granular cells through mossy fibers, sending back short but highly distributed signals to a proportionally greater number of granule cells. We also show here that MCs express CR and innervate profusely other MCs – displaying a pattern of short reciprocal MC to MC projections (Fig. 7B). These results agree with previous EM findings46, and are in line with the finding that reciprocal connections are a distinctive feature of calretinin + neurons30. While there is no conclusive proof for Mossy to Mossy cell innervation, our data are consistent with results from Wenzel et al.46 who argued for cross innervation by collaterals. Although many MCs extend their projection to the DG inner molecular layer, MCs form a plexus of exuberant axon collaterals within the hilus, which has been recognized in anatomical47 and electrophysiological16,48,49 studies. These results also show that MCs are immunoreactive to GABA and GAD proteins, which does not necessarily imply that the cells are functionally GABAergic but, rather that mossy cells express GABA like other glutamatergic neurons50–52.
The neural cell damage in Shh-expressing cells and massive cell loss induced by Shh ablation revealed that Shh expression is critical for the long-term survival of MCs. Conversely, Shh+ signaling was increased during the KA-induced hyperactivity. This upregulation of Shh and a concomitant increased expression of the Shh effector Smo, conferred a survival advantage to CR+ neurons expressing Shh, since these cells increased in numbers. Exaggerated neural activity, inflammation and persistent oxidative stress may lead to Shh/Smo upregulation as observed during amphetamine treatment53, facial nerve axotomy54, hypoxia55 or ischemic stroke56. Nevertheless, the upregulation of Shh during KA-induced neural hyperactivity did not seem to affect SGZ proliferation even when Smo signal was upregulated in the SGZ (Fig. 8B,K). Bragina et al.57 showed that rising Shh signaling by increasing Smo agonist (SAG) concentrations from 1 nM to 5 nM decreased proliferation from significantly high levels (at 1 nM) back to control levels (at 5 nM) in hippocampal cell cultures. Further, when Shh concentrations increased from 10 nM to 50 nM significant cell death was observed in a cerebellar primary culture. Thus, it is possible that Shh’s effects on proliferation in vivo are modulated in narrow time dependent concentration ranges. Shh may be a factor that maintains or stimulates proliferation at low concentration levels but an increase over some concentration limits or for longer periods of time may lead to inhibition.
The association between Shh upregulation and decreased -instead of increased-neurogenesis agree with previous studies in the SVZ. Thus, activation of the Shh pathway, through the conditional ablation of Ptc, led to a dramatic decrease in neurogenesis in the SVZ. The neurogenesis blockade was related to a shift in NSC division mode from asymmetric to symmetric58. Sustained activation of the Shh pathway using this strategy also induced a progressive increase in NSC numbers in the quiescent state and a marked reduction of the activated NSC pool, leading to an almost complete exhaustion of neurogenesis59. Our results in the SGZ agree with the studies in the SVZ. Collectively, these studies suggest that the response of Shh-producing neurons is adapted to preserve NSCs under changing conditions in the neurogenic niches. Under normal conditions, basal levels of Shh would act as a trophic agent for quiescent-NSCs allowing them to homeostatic be converted to activated-NCSs and increasing the production of intermediary progenitors. Under excitotoxic conditions, Shh is upregulated (e.g. by mossy cells in the hilus), which lead to inhibition of the NSCs activation process and a decline in neurogenesis. This produces the accumulation of quiescent NSCs59. Quiescent NSCs are more resistant to toxic conditions because replicate slowly58. The consequence of this Shh-concentration dependent effect is that NSCs are preserved in the neurogenic niches.
During the second week post KA-injection we observed a hyperexcitability syndrome characterized by stereotypes, forelimb clonus (Racine’s stage 3) and electrographic abnormalities such as high-amplitude bursting and hyper-synchronized spiking. During this epileptogenic process, the MCs survived and there was an upregulation of Shh and Smo. In more severe epilepsy, i.e. when KA is directly administered into the DG and epilepsy stages 4/5 become persistent, MC death might occur, in which case, a fall in Shh levels as well as an increase in neurogenesis could be expected60. However, while some authors have considered MCs “vulnerable”, others find that the loss of both MCs and interneurons is equivalent in epilepsy61. Furthermore, in humans with epilepsy, Seress et al.62 found that MCs were present in the hilus of the DG when most pyramidal neurons of the CA1 and CA3 areas were lost.
The neurogenic response to neurotoxic insults is biphasic: the immediate response is an increase in neurogenesis which is followed, after a variable time span, dependent on experimental conditions and species, by a decline in neurogenesis. Low levels of proliferation and neurogenesis persist chronically. In the KA model, several groups using intracerebral KA administration have showed that proliferation increases during the first 3 days after the KA injections. By the end of the first week after the injection, there is a fall in the levels of SGZ proliferation. After 7 days of the injection, the levels of proliferation/neurogenesis are normal or reduced26–28,60, while a deficiency in proliferation and neurogenesis persist chronically26,27,60. In addition, the initial increase in proliferation after the KA injection have been associated with expansion of the glial pool rather than the neuronal pool26,60. In these KA-studies, Shh levels were not measured at different stages of the experiments and further investigations are required to establish whether there is a consistent relationship between Shh levels and neurogenesis in this model.
Conversely, the dramatic reduction in Shh protein levels after the ablation of the Shh gene leads to neurodegeneration, atrophy and death of MCs and to an increased proliferation and neurogenesis in the SGZ. Thus, in the SGZ adjacent to hilar CR cells, where the ablation took place, we found significant increases in EdU, Ki67 (Fig. 11), and immature neuron markers (CR and DCX) in the SGZ (Fig. 12). The number of GFAP+EdU+ radial glia cells were diminished, and this could be interpreted as a depletion of NSCs due to the massive and prolonged proliferative response60 (Fig. 12). Interestingly, chronic ablation of MCs transiently increases the activation of NSCs (at 15 days after ablation), leading to a NSCs depletion at 42 days after ablation20, which supports the present finding that NSCs are depleted 45 days after the initial CRE induced gene ablation.
In the SVZ of the adult brain, it has been shown that Shh exerts both positive and negative regulatory actions on neurogenesis through Smo and Gli3, respectively. NSC proliferation and neurogenesis appear to be dominated in the SVZ by Gli3R repressor activity. Thus, removing Gli3 in Smo conditional mutants largely rescues neurogenesis, while, expression of a constitutive GLI3(R) abrogates neurogenesis63. If a similar signaling mechanism would take place in the SGZ, the downregulation of Shh could lead to decreased repressor activity and increased proliferation. Molecular interactions of this type may help explain why the effects of a Shh deletion (in Shh sources) may greatly differ from the effects of a Smo deletion (in Shh target cells)6.
The present studies are the first to identify the cells that synthetize Shh in the ventral adult hippocampus, an area where most MCs are located14. From horizontal brain section, we visualized the areas where the hippocampus was cross sectioned to accurately localize DG sub-regions (see Fig. 1A and methods). Li et al.6, using a Shh-gfpcre transgenic, followed the Shh lineage and found that CR neurons were actively producing Shh in the hippocampus at P15. MCs were recognized as CR+ cells in the dorsal but not the ventral DG at P15. However, these authors did not assess whether these putative MCs were positive for either GABA or glutamate markers, thus leaving their identity ambiguous. Several authors have found that mossy cells are CR+ only in the ventral DG and not in the dorsal DG14,25,32, while at dorsal DG levels, calretinin immunoreactivity was limited largely to a subpopulation of interneurons64. Liu et al.32 identified in the hilus many CR immunoreactive cells as GABAergic and some that express both GABA and glutamate markers. Our results show that cells expressing CR, GluR2/3 or CGRP also co-stained for α-GAD and α-GABA antibodies. Among lacZ+ cells, over 90% were positive for GAD, CR, GluR2/3 or CGRP (Table 1, columm-7). Further, a high GABA-CR colocalization can be observed in double in situ hybridization (FISH) images from 2 mice (P57) published in the Allan Atlas21. From these images, we estimated that among GAD-1+ cells, about 70% were positive for CR (Fig. 3B). These observations support our finding using IHC that most hilar CR+ cells in the ventral hilus are GAD1+ (GAD67) (Figs 4 and 5). There are many factors related to IHC technique that can account for the discrepancy with other groups. An advantage of our methodology was the strong, selectively nuclear, immune-reactivity for lacZ, These lacZ+ cells were immunoreactive within the cytoplasm to α-GAD antibodies at conventional concentrations (1:500 to 1:1000) and using several commercial brands including α-GAD65/67 (ABcam), α-GAD67 and α-GAD65 (Santa Cruz) and α-GABA (Sigma-Aldrich). In addition, we showed that MCs expressing nlacZ strongly co-localized with GluR2/3 (Fig. 3C,G) and CGRP (Supplemental Fig. S2). GluR2/3 and CGRP cytoplasmic signals highly co-localized with GABA markers in the hilus (Fig. 3D–F,H; Supplemental Fig. S2). Collectively, these observations suggest that MCs express both glutamatergic and GABAergic markers like medium spiny neurons (MSNs) in the striatum65 or the granular cells in the dentate gyrus50.
In addition to the well-known effects of Shh on NSCs in the SGZ, Shh could be delivered to the GCL via axonal transport by Shh expressing MCs and could influence cell differentiation/maturation and the continuous integration of granular cells produced by neurogenesis into the hippocampal circuits. MCs have recently been implicated in place fields neural processing66, spatial exploration and pattern separation67 and in generating a special type of LTP68. Our findings will prompt follow up studies that will seek to clarify whether hippocampal learning and memory processes might depend on Shh expression by MCs and whether Shh might regulate structural plasticity in hippocampal circuitry.
In conclusion, we have found that Shh expression in MCs is dynamic and can be upregulated during epileptogenesis to enhance survival. Furthermore, we show that Shh expression by MCs is indispensable for their survival. Finally, Shh ablation led to reactive proliferation of immature neurons and depletion of NSCs suggesting that MC derived Shh has multiple regulatory functions during neurogenesis. As MCs are implicated in learning and memory, the modulation of Shh could be a key strategy to modulate plasticity and neurogenesis. This suggests that the modulation of Shh expression in MCs might be a potential approach to generate therapies aimed at protecting neural circuits in epilepsy and excitotoxicity and treating cognitive and emotional disorders in which altered neurogenesis is a major component.
Methods
Mouse strains
The Shh-nlacZ allele was generated by homologous recombination in ES cells by Dr. A. Kottmann and T. Jessell. Additional details of the allele construction are described in Gonzalez-Reyes et al.13.
Transgenic mice expressing the oligodendrocyte reporter PLP-EGFP were generated by Dr. W. Macklin and described in Mallon et al.69.
CAG-H2B-EGFP (B6.Cg-Tg(HIST1H2BB/EGFP)1 Pa/J) were obtained from Jackson Laboratory (stock number: 006069).
Animals were housed no more than 5 adult animals per cage and maintained in a SPF room under light (12-h light/12-h dark cycle), temperature and humidity controlled conditions. For acute in vivo experiments, adult male animals were used (range from P60 to P90). All experimental procedures performed in this study followed the NIH animal use guidelines and were approved by the Institutional Animal Care and Use Committee (IACUC) at Case Western Reserve University.
KA injections
The dose of KA was fractioned (5 mg/kg IP every 30 min) until a maximum of 35 mg/kg; mice were scored using a Racine’s severity scale24. Only mice that reach status epilepticus during administration of KA were selected for histological studies. The histological studies were performed 2 weeks after the KA injections.
BRDU injections
Two doses of BRDU (30 mg/kg each) separated by three hours-intervals were injected (IP) seven days before euthanasia. BRDU staining procedures are described below.
Histological procedures
For histological studies, knock-in and transgenic mice or littermate wild type mice were transcardially perfused with ice-cold 4% paraformaldehyde (PFA) under isoflurane anesthesia. Brains were then removed, post-fixed in 4% PFA at 4 °C overnight, and cryoprotected in 30% sucrose in phosphate-buffered saline (PBS) for 2 days before being flash-frozen in 2-methylbutane on dry ice and stored at − 80 °C. Brains were then sectioned at a thickness of 40 μm using a cryostat (Leica CM3050S), and free-floating sections were blocked in 5% horse serum for 1 h, then stained for α-GAD-65 (Santa Cruz sc-32270, 1:1000 dilution), α-GAD-67 (Santa Cruz sc-5602, 1:700), α-GAD-65/67 (abcam, ab49832, 1:1000), α-GABA (Sigma, A2052, 1:500), α-parvalbumin (abcam, ab11427, 1:1000), α-somatostatin (abcam, ab8904, 1:1000), α-nestin (abcam, ab6142, 1:1000), α-Smo (abcam, ab80683, 1:500), α-sonic hedgehog (abcam, ab50515, 1:1000), α-NeuN (abcam, ab131624, 1:1000), α–calretinin (abcam, ab702, 1:400), α-neuropeptide Y (abcam, ab30914, 1:1000), α-beta Galactosidase (abcam, ab936, 1:1000), α-Ptc-1 (abcam, ab53715, 1:1000), α-GFAP antibody (abcam, ab7260, 1:1000; Sigma-Aldrich, 1:200), α-GluR2/3 (abcam ab6438, 1:250; Millipore AB1553, 1:250), α-GluR2 (Santa Cruz 517265, 1:200), α-CGRP (ab36001, 1:500), α-doblecortin (Santa Cruz, sc-271390, 1:500) and α-BRDU (abcam ab6326, 1:200) at 4 °C for 24–36 h. The specificity of α-CGRP antibody, abcam ab36001, was validated by Carter et al.70 in neurons of the parabrachial nucleus (PBN) in mouse brainstem. Sections were then incubated with secondary antibodies conjugated to Cy3 (1:700, Jackson ImmunoResearch) or Alexa Fluor 594 or 488 antibodies (1:1000, Life Technologies). After rinsing in PBS, sections were mounted on Fisherbrand superfrost/plus microscope slides in vectashield mounting media (Vector Laboratories, Burlingame, CA). DAPI (1:3000, Invitrogen) was included during secondary antibodies incubation to visualize nuclei.
For BRDU staining the procedure was the same as above but the slices were pretreated with citrate buffer and heated to 99 °C in a water bath before blocking71. Chromogenic immunohistochemistry was performed using the above-mentioned primary antibodies and developed using betazoid DAB, vulcan fast red and hematoxylin (BioCare Medical Kit).
Cells were quantified from 10 horizontal sections of 40 µm thickness each that were spaced 160 μm apart (4-section interval) covering the entire the dorsal-ventral- and anterior to posterior- extent of the hilus. The horizontal slices allowed to sample the volume represented in Fig. 1. The number of cells was estimated using a stereological approach13 by two independent observers blinded to the experimental groups. Fluorescent colocalization was demonstrated using Z-stack reconstructions of the whole cell allowing orthogonal views at 63X (Zeiss LSM 510 microscope) or 100X (Olympus FV-1000 microscope) magnification. Cells were counted exhaustively from images with a full view of the hilar region (25X). To count double-labeled cells we took Z-stacks at 1μm-steps across the section and generate a Z-projection (vertically superimposed) into a single x-y plane (FV10-ASW software). The projected image was electronically amplified 4 times (to 100X) on the computer screen. Using the image J cell-counting tool only cells with clear morphology and delineated nucleus were counted and marked to avoid repetitions. Co-localization was reported as average ± SEM of cells that co-express two markers for every 100 cells expressing one of the markers (Table 1). To determine optical density, the channel corresponding to the protein was selected. Using image J, the integrated optical density (IOD) and the cell surface area (CSA) were measured and the IOD/CSA ratio was calculated for each immune positive cell. This value was then average and normalized to controls.
AAV virus and EdU experiments
Shh-nlacZ animals (P50, n = 6/group) were stereotaxically injected with an AAV virus (AAV9.CMV.HI.eGFP-Cre.wPRE.SV40) or vehicle to the DG hippocampus (bregma -3.3 mm, lateral 2.7 mm and ventral -4.2 mm, left hippocampus)72 and euthanized 8 weeks later. The injections volume was 0.5 µl at the rate of 0.1 µl/min. Animals received 3 IP injections of EdU (50 mg/kg each) 4 hours apart at days -15, -4 and -1 before euthanasia (at P95) (See Fig. 9AA). At the end of the experiment, animals were perfused transcardially with PFA 4%, the brains were dissected out and processed for cryostat sectioning (40 µm). EdU was stained using the Click-It method (Invitrogen).
Data analysis and statistics
Student’s t-tests were used to compare either two repeated (paired-t-test) or independent (unpaired-t-test) measures. Test results and number of animals per group are reported in the figures or in the figure legends. A statistical significance criterion of α = 0.05 was used for all tests. Results are shown as mean ± standard error (SEM). Statistical test results and group sizes are reported in the figure legends.
Supplementary information
Acknowledgements
This work was supported by National Institutes of Health (National Institute of Neurological Disorders and Stroke) Grant 1R01NS060757-01, by the E.L. Lindseth endowed chair to D.M.D. and by the Office of the Assistant Secretary of Defense for Health Affairs through the Peer Reviewed Medical Research Program under Award No. W81XWH-15-1-0608 (J.R.C.). The contents do not represent the views of the U.S. Department of Veterans Affairs or the United States Government. We thank Dr. Wendy Macklin and Dr. Robert Miller for kindly donated the PLP-mice. The authors declare no competing financial interests.
Author contributions
L.E.G.-R. conceived the study, performed the experiments, analyzed the data and prepared the manuscript. C.-C.C. contributed in experiments. M.Z. contributed in experiments. J.J. helped with immunostainings and cell counting. M.A.-T. contributed with immunostainings, behavioral experiments and analysis. N.C. contributed with K.A. studies. N.R. contributed with immunostainings, L.S. contributed with perfusions and brain dissections. J.R.C. revised the manuscript and provided financial support. A.K. provided the Shh-nlacZ reporter, discussed the results, revised the manuscript and provided financial support. D.M.D. discussed the experiments and the data, revised the manuscript and provided main financial support.
Competing interests
The authors declare no competing interests.
Footnotes
Publisher’s note Springer Nature remains neutral with regard to jurisdictional claims in published maps and institutional affiliations.
These authors jointly supervised this work: Andreas H. Kottmann and Dominique M. Durand.
Supplementary information
is available for this paper at 10.1038/s41598-019-53192-4.
References
- 1.Jessell TM. Neuronal specification in the spinal cord: inductive signals and transcriptional codes. Nat. Rev. Genet. 2000;1:20–29. doi: 10.1038/35049541. [DOI] [PubMed] [Google Scholar]
- 2.Riquelme PA, Drapeau E, Doetsch F. Brain micro-ecologies: neural stem cell niches in the adult mammalian brain. Philos Trans R Soc Lond B Biol Sci. 2008;363:123–137. doi: 10.1098/rstb.2006.2016. [DOI] [PMC free article] [PubMed] [Google Scholar]
- 3.Lai K, Kaspar BK, Gage FH, Schaffer DV. Sonic hedgehog regulates adult neural progenitor proliferation in vitro and in vivo. Nat Neurosci. 2003;6:21–27. doi: 10.1038/nn983. [DOI] [PubMed] [Google Scholar]
- 4.Palma V, et al. Sonic hedgehog controls stem cell behavior in the postnatal and adult brain. Development. 2005;132:335–344. doi: 10.1242/dev.01567. [DOI] [PMC free article] [PubMed] [Google Scholar]
- 5.Ahn S, Joyner AL. In vivo analysis of quiescent adult neural stem cells responding to Sonic hedgehog. Nature. 2005;437:894–897. doi: 10.1038/nature03994. [DOI] [PubMed] [Google Scholar]
- 6.Li G, Fang L, Fernández G, Pleasure SJ. The ventral hippocampus is the embryonic origin for adult neural stem cells in the dentate gyrus. Neuron. 2013;78:658–672. doi: 10.1016/j.neuron.2013.03.019. [DOI] [PMC free article] [PubMed] [Google Scholar]
- 7.Petralia RS, Wang YX, Mattson MP, Yao PJ. Sonic hedgehog distribution within mature hippocampal neurons. Commun. Integr. Biol. 2011;4:775–777. doi: 10.4161/cib.17832. [DOI] [PMC free article] [PubMed] [Google Scholar]
- 8.Pitter KL, et al. The SHH/Gli pathway is reactivated in reactive glia and drives proliferation in response to neurodegeneration-induced lesions. Glia. 2014;62:1595–1607. doi: 10.1002/glia.22702. [DOI] [PMC free article] [PubMed] [Google Scholar]
- 9.Traiffort E, et al. Discrete localizations of hedgehog signalling components in the developing and adult rat nervous system. Eur. J. Neurosci. 1999;11:3199–3214. doi: 10.1046/j.1460-9568.1999.00777.x. [DOI] [PubMed] [Google Scholar]
- 10.Banerjee SB, et al. Recruitment of the Sonic hedgehog signalling cascade in electroconvulsive seizure-mediated regulation of adult rat hippocampal neurogenesis. Eur. J. Neurosci. 2005;22:1570–1580. doi: 10.1111/j.1460-9568.2005.04317.x. [DOI] [PMC free article] [PubMed] [Google Scholar]
- 11.Huang Z, Kunes S. Hedgehog, transmitted along retinal axons, triggers neurogenesis in the developing visual centers of the Drosophila brain. Cell. 1996;86:411–22. doi: 10.1016/S0092-8674(00)80114-2. [DOI] [PubMed] [Google Scholar]
- 12.Peng J, et al. Sonic Hedgehog Is a Remotely Produced Cue that Controls Axon Guidance Trans-axonally at a Midline Choice Point. Neuron. 2018;97:326–340. doi: 10.1016/j.neuron.2017.12.028. [DOI] [PubMed] [Google Scholar]
- 13.Gonzalez-Reyes LE, et al. Sonic hedgehog maintains cellular and neurochemical homeostasis in the adult nigrostriatal circuit. Neuron. 2012;75:306–319. doi: 10.1016/j.neuron.2012.05.018. [DOI] [PMC free article] [PubMed] [Google Scholar]
- 14.Fujise N, Liu Y, Hori N, Kosaka T. Distribution of calretinin immunoreactivity in the mouse dentate gyrus: II. Mossy cells, with special reference to their dorsoventral difference in calretinin immunoreactivity. Neuroscience. 1998;82:181–200. doi: 10.1016/S0306-4522(97)00261-3. [DOI] [PubMed] [Google Scholar]
- 15.Scharfman HE. The enigmatic mossy cell of the dentate gyrus. Nat. Rev. Neurosci. 2016;17:562–575. doi: 10.1038/nrn.2016.87. [DOI] [PMC free article] [PubMed] [Google Scholar]
- 16.Larimer P, Strowbridge BW. Nonrandom local circuits in the dentate gyrus. J. Neurosci. 2008;28:12212–12223. doi: 10.1523/JNEUROSCI.3612-08.2008. [DOI] [PMC free article] [PubMed] [Google Scholar]
- 17.Scharfman HE. Electrophysiological evidence that dentate hilar mossy cells are excitatory and innervate both granule cells and interneurons. J. Neurophysiol. 1995;74:179–194. doi: 10.1152/jn.1995.74.1.179. [DOI] [PubMed] [Google Scholar]
- 18.Jinde S, Zsiros V, Nakazawa K. Hilar mossy cell circuitry controlling dentate granule cell excitability. Front. Neural Circuits. 2013;7:14. doi: 10.3389/fncir. [DOI] [PMC free article] [PubMed] [Google Scholar]
- 19.Ratzliff Ad. HAL, Santhakumar V, Osapay I, Soltesz I. Rapid deletion of mossy cells does not result in a hyperexcitable dentate gyrus: implications for epileptogenesis. J. Neurosci. 2004;24:2259–2269. doi: 10.1523/JNEUROSCI.5191-03.2004. [DOI] [PMC free article] [PubMed] [Google Scholar]
- 20.Yeh CY, et al. Mossy Cells Control Adult Neural Stem Cell Quiescence and Maintenance through a Dynamic Balance between Direct and Indirect Pathways. Neuron. 2018;99:493–510. doi: 10.1016/j.neuron.2018.07.010. [DOI] [PMC free article] [PubMed] [Google Scholar]
- 21.Lein ES, et al. Genome-wide atlas of gene expression in the adult mouse brain. Nature. 2007;445:168–176. doi: 10.1038/nature05453. [DOI] [PubMed] [Google Scholar]
- 22.Bulloch K, Prasad A, Conrad CD, McEwen BS, Milner TA. Calcitonin gene-related peptide level in the rat dentate gyrus increases after damage. Neuroreport. 1996;7:1036–1040. doi: 10.1097/00001756-199604100-00016. [DOI] [PubMed] [Google Scholar]
- 23.Freund TF, Hájos N, Acsády L, Görcs TJ, Katona I. Mossy cells of the rat dentate gyrus are immunoreactive for calcitonin gene-related peptide (CGRP) Eur J Neurosci. 1997;9:1815–1830. doi: 10.1111/j.1460-9568.1997.tb00748.x. [DOI] [PubMed] [Google Scholar]
- 24.Tse K, Puttachary S, Beamer E, Sills GJ, Thippeswamy T. Advantages of repeated low dose against single high dose of kainate in C57BL/6J mouse model of status epilepticus: behavioral and electroencephalographic studies. PloS one. 2014;9:e96622. doi: 10.1371/journal.pone.0096622. [DOI] [PMC free article] [PubMed] [Google Scholar]
- 25.Volz F, et al. Stereologic estimation of hippocampal GluR2/3- and calretinin-immunoreactive hilar neurons (presumptive mossy cells) in two mouse models of temporal lobe epilepsy. Epilepsia. 2011;52:1579–1589. doi: 10.1111/j.1528-1167.2011.03086.x. [DOI] [PubMed] [Google Scholar]
- 26.Heinrich C, et al. Reelin deficiency and displacement of mature neurons, but not neurogenesis, underlie the formation of granule cell dispersion in the epileptic hippocampus. J. Neurosci. 2006;26:4701–4713. doi: 10.1523/JNEUROSCI.5516-05.2006. [DOI] [PMC free article] [PubMed] [Google Scholar]
- 27.Kralic JE, Ledergerber DA, Fritschy JM. Disruption of the neurogenic potential of the dentate gyrus in a mouse model of temporal lobe epilepsy with focal seizures. Eur. J. Neurosci. 2005;22:1916–1927. doi: 10.1111/j.1460-9568.2005.04386.x. [DOI] [PubMed] [Google Scholar]
- 28.Kondratiuk I, et al. Epileptogenesis following Kainic Acid-Induced Status Epilepticus in Cyclin D2 Knock-Out Mice with Diminished Adult Neurogenesis. PLoS One. 2015;10(5):e0128285. doi: 10.1371/journal.pone.0128285. [DOI] [PMC free article] [PubMed] [Google Scholar]
- 29.Jessberger S, et al. Seizure-associated, aberrant neurogenesis in adult rats characterized with retrovirus-mediated cell labeling. J. Neurosci. 2007;27:9400–9407. doi: 10.1523/JNEUROSCI.2002-07.2007. [DOI] [PMC free article] [PubMed] [Google Scholar]
- 30.Gulyás AI, Hájos N, Freund TF. Interneurons containing calretinin are specialized to control other interneurons in the rat hippocampus. J Neurosci. 1996;16:3397–3411. doi: 10.1523/JNEUROSCI.16-10-03397.1996. [DOI] [PMC free article] [PubMed] [Google Scholar]
- 31.Cohen M, et al. Ptch1 and Gli regulate Shh signalling dynamics via multiple mechanisms. Nat Commun. 2015;6:6709. doi: 10.1038/ncomms7709. [DOI] [PMC free article] [PubMed] [Google Scholar]
- 32.Liu Y, Fujise N, Kosaka T. Distribution of calretinin immunoreactivity in the mouse dentate gyrus. I. General description. Exp. Brain Res. 1996;108:389–403. doi: 10.1007/BF00227262. [DOI] [PubMed] [Google Scholar]
- 33.Brandt MD, et al. Transient calretinin expression defines early postmitotic step of neuronal differentiation in adult hippocampal neurogenesis of mice. Mol. Cell. Neurosci. 2003;24:603–613. doi: 10.1016/S1044-7431(03)00207-0. [DOI] [PubMed] [Google Scholar]
- 34.Spampanato J, Sullivan RK, Turpin FR, Bartlett PF, Sah P. Properties of Doublecortin Expressing Neurons in the Adult Mouse Dentate Gyrus. PLoS ONE. 2012;7(9):e41029. doi: 10.1371/journal.pone.0041029. [DOI] [PMC free article] [PubMed] [Google Scholar]
- 35.Machold R, et al. Sonic hedgehog is required for progenitor cell maintenance in telencephalic stem cell niches. Neuron. 2003;39:937–950. doi: 10.1016/S0896-6273(03)00561-0. [DOI] [PubMed] [Google Scholar]
- 36.Lewis PM, Gritli-Linde A, Smeyne R, Kottmann A, McMahon AP. Sonic hedgehog signaling is required for expansion of granule neuron precursors and patterning of the mouse cerebellum. Dev Biol. 2004;270:393–410. doi: 10.1016/j.ydbio.2004.03.007. [DOI] [PubMed] [Google Scholar]
- 37.Jeong J, Mao J, Tenzen T, Kottmann AH, McMahon AP. Hedgehog signaling in the neural crest cells regulates the patterning and growth of facial primordia. GenesDev. 2004;18:937–951. doi: 10.1101/gad.1190304. [DOI] [PMC free article] [PubMed] [Google Scholar]
- 38.Desouza LA, et al. Thyroid hormone regulates the expression of the sonic hedgehog signaling pathway in the embryonic and adult Mammalian brain. Endocrinology. 2011;152:1989–2000. doi: 10.1210/en.2010-1396. [DOI] [PMC free article] [PubMed] [Google Scholar]
- 39.Peng YC, Levine CM, Zahid S, Wilson EL, Joyner AL. Sonic hedgehog signals to multiple prostate stromal stem cells that replenish distinct stromal subtypes during regeneration. Proc Natl Acad Sci USA. 2013;110:20611–20616. doi: 10.1073/pnas.1315729110. [DOI] [PMC free article] [PubMed] [Google Scholar]
- 40.Symmons O, et al. The Shh topological domain facilitates the action of remote enhancers by reducing the effects of genomic distances. Dev Cell. 2016;39:529–543. doi: 10.1016/j.devcel.2016.10.015. [DOI] [PMC free article] [PubMed] [Google Scholar]
- 41.Ortega-de San Luis C, et al. Substantia nigra dopaminergic neurons and striatal interneurons are engaged in three parallel but interdependent postnatal neurotrophic circuits. Aging Cell. 2018;17:e12821. doi: 10.1111/acel.12821. [DOI] [PMC free article] [PubMed] [Google Scholar]
- 42.Charytoniuk D, et al. Sonic Hedgehog signalling in the developing and adult brain. J. Physiol. Paris. 2002;96(1–2):9–16. doi: 10.1016/S0928-4257(01)00075-4. [DOI] [PubMed] [Google Scholar]
- 43.Milstein AD, Soltesz I. Hippocampal Dentate Mossy Cells Improve Their CV and Trk into the Limelight. Neuron. 2017;95:732–734. doi: 10.1016/j.neuron.2017.08.005. [DOI] [PubMed] [Google Scholar]
- 44.Walker, M., Chan, D. & Thom, M. Hippocampus and human disease (The Hippocampus Book, ed by Andersen, P., Morris, R., Amaral, D., O’Keefe, J. (769–802) Oxford University Press (2007).
- 45.Blümcke I, et al. Loss of hilar mossy cells in Ammon’s horn sclerosis. Epilepsia. 2000;41(Suppl 6):S174–180. doi: 10.1111/j.1528-1157.2000.tb01577.x. [DOI] [PubMed] [Google Scholar]
- 46.Wenzel HJ, Buckmaster PS, Anderson NL, Wenzel ME, Schwartzkroin PA. Ultrastructural localization of neurotransmitter immunoreactivity in mossy cell axons and their synaptic targets in the rat dentate gyrus. Hippocampus. 1997;7:559–570. doi: 10.1002/(SICI)1098-1063(1997)7:5<559::AID-HIPO11>3.0.CO;2-#. [DOI] [PubMed] [Google Scholar]
- 47.Frotscher M, Seress L, Schwerdtfeger WK, Buhl E. The mossy cells of the fascia dentata: a comparative study of their fine structure and synaptic connections in rodents and primates. J. Comp. Neurol. 1991;312:145–163. doi: 10.1002/cne.903120111. [DOI] [PubMed] [Google Scholar]
- 48.Scharfman HE, Schwartzkroin PA. Electrophysiology of morphologically identified mossy cells of the dentate hilus recorded in guinea pig hippocampal slices. J. Neurosci. 1988;8:3812–3821. doi: 10.1523/JNEUROSCI.08-10-03812.1988. [DOI] [PMC free article] [PubMed] [Google Scholar]
- 49.Buckmaster PS, Strowbridge BW, Kunkel DD, Schmiege DL, Schwartzkroin PA. Mossy cell axonal projections to the dentate gyrus molecular layer in the rat hippocampal slice. Hippocampus. 1992;2:349–362. doi: 10.1002/hipo.450020403. [DOI] [PubMed] [Google Scholar]
- 50.Gutiérrez R, et al. Plasticity of the GABAergic phenotype of the “glutamatergic” granule cells of the rat dentate gyrus. J Neurosci. 2003;23:5594–5598. doi: 10.1523/JNEUROSCI.23-13-05594.2003. [DOI] [PMC free article] [PubMed] [Google Scholar]
- 51.Uchigashima M, Fukaya M, Watanabe M, Kamiya H. Evidence against GABA release from glutamatergic mossy fiber terminals in the developing hippocampus. J Neurosci. 2007;27:8088–80100. doi: 10.1523/JNEUROSCI.0702-07.2007. [DOI] [PMC free article] [PubMed] [Google Scholar]
- 52.Münster-Wandowski A, Gómez-Lira G, Gutiérrez R. Mixed neurotransmission in the hippocampal mossy fibers. Front Cell Neurosci. 2013;7:210. doi: 10.3389/fncel.2013.00210. [DOI] [PMC free article] [PubMed] [Google Scholar]
- 53.Rajendran R, et al. Monoaminergic regulation of Sonic hedgehog signaling cascade expression in the adult rat hippocampus. Neurosci Lett. 2009;453:190–194. doi: 10.1016/j.neulet.2009.02.034. [DOI] [PMC free article] [PubMed] [Google Scholar]
- 54.Akazawa C, et al. The upregulated expression of sonic hedgehog in motor neurons after rat facial nerve axotomy. J Neurosci. 2004;24:7923–7930. doi: 10.1523/JNEUROSCI.1784-04.2004. [DOI] [PMC free article] [PubMed] [Google Scholar]
- 55.Onishi H, et al. Hypoxia activates the hedgehog signaling pathway in a ligand-independent manner by upregulation of Smo transcription in pancreatic cancer. Cancer Sci. 2011;102:1144–1150. doi: 10.1111/j.1349-7006.2011.01912.x. [DOI] [PubMed] [Google Scholar]
- 56.Jin Y, Barnett A, Zhang Y, Yu X, Luo Y. Poststroke Sonic Hedgehog Agonist Treatment Improves Functional Recovery by Enhancing Neurogenesis and Angiogenesis. Stroke. 2017;48:1636–1645. doi: 10.1161/STROKEAHA.117.016650. [DOI] [PMC free article] [PubMed] [Google Scholar]
- 57.Bragina O, et al. Smoothened agonist augments proliferation and survival of neural cells. Neurosci. Lett. 2010;482:81–85. doi: 10.1016/j.neulet.2010.06.068. [DOI] [PubMed] [Google Scholar]
- 58.Ferent J, et al. Genetic activation of Hedgehog signaling unbalances the rate of neural stem cell renewal by increasing symmetric divisions. Stem Cell Reports. 2014;3:312–323. doi: 10.1016/j.stemcr.2014.05.016. [DOI] [PMC free article] [PubMed] [Google Scholar]
- 59.Daynac M, et al. Hedgehog Controls Quiescence and Activation of Neural Stem Cells in the Adult Ventricular-Subventricular Zone. Stem cell reports. 2016;7:735–748. doi: 10.1016/j.stemcr.2016.08.016. [DOI] [PMC free article] [PubMed] [Google Scholar]
- 60.Sierra A, et al. Neuronal Hyperactivity Accelerates Depletion of Neural Stem Cells and Impairs Hippocampal Neurogenesis. Cell stem cell. 2015;16:488–503. doi: 10.1016/j.stem.2015.04.003. [DOI] [PMC free article] [PubMed] [Google Scholar]
- 61.Ratzliff Ad, Santhakumar V, Howard A, Soltesz I. Mossy cells in epilepsy: rigor mortis or vigor mortis? Trends Neurosci. 2002;25:140–144. doi: 10.1016/S0166-2236(00)02122-6. [DOI] [PubMed] [Google Scholar]
- 62.Seress L, et al. Survival of mossy cells of the hippocampal dentate gyrus in humans with mesial temporal lobe epilepsy. J. Neurosurg. 2009;111:1237–1247. doi: 10.3171/2008.11.JNS08779. [DOI] [PubMed] [Google Scholar]
- 63.Petrova R, Garcia AD, Joyner AL. Titration of GLI3 repressor activity by sonic hedgehog signaling is critical for maintaining multiple adult neural stem cell and astrocyte functions. J. Neurosci. 2013;33:17490–17505. doi: 10.1523/JNEUROSCI.2042-13.2013. [DOI] [PMC free article] [PubMed] [Google Scholar]
- 64.Blasco-Ibáñez JM, Freund TF. Distribution, ultrastructure, and connectivity of calretinin-immunoreactive mossy cells of the mouse dentate gyrus. Hippocampus. 1997;7:307–320. doi: 10.1002/(SICI)1098-1063(1997)7:3<307::AID-HIPO6>3.0.CO;2-H. [DOI] [PubMed] [Google Scholar]
- 65.Perreault ML, Fan T, Alijaniaram M, O’Dowd BF, George SR. Dopamine D1-D2 receptor heteromer in dual phenotype GABA/glutamate-coexpressing striatal medium spiny neurons: regulation of BDNF, GAD67 and VGLUT1/2. PLoS One. 2012;7:e33348. doi: 10.1371/journal.pone.0033348. [DOI] [PMC free article] [PubMed] [Google Scholar]
- 66.GoodSmith D, et al. Spatial Representations of Granule Cells and Mossy Cells of the Dentate Gyrus. Neuron. 2017;93:677–690. doi: 10.1016/j.neuron.2016.12.026. [DOI] [PMC free article] [PubMed] [Google Scholar]
- 67.Jinde S, et al. Hilar Mossy Cell Degeneration Causes Transient Dentate Granule Cell Hyperexcitability and Impaired Pattern Separation. Neuron. 2012;76:1189–1200. doi: 10.1016/j.neuron.2012.10.036. [DOI] [PMC free article] [PubMed] [Google Scholar]
- 68.Hashimotodani Y, et al. LTP at Hilar Mossy Cell-Dentate Granule Cell Synapses Modulates Dentate Gyrus Output by Increasing Excitation/Inhibition Balance. Neuron. 2017;95:928–943. doi: 10.1016/j.neuron.2017.07.028. [DOI] [PMC free article] [PubMed] [Google Scholar]
- 69.Mallon BS, Shick HE, Kidd GJ, Macklin WB. Proteolipid promoter activity distinguishes two populations of NG2-positive cells throughout neonatal cortical development. J Neurosci. 2002;22:876–85. doi: 10.1523/JNEUROSCI.22-03-00876.2002. [DOI] [PMC free article] [PubMed] [Google Scholar]
- 70.Carter ME, Soden ME, Zweifel LS, Palmiter RD. Genetic identification of a neural circuit that suppresses appetite. Nature. 2013;503:111–114. doi: 10.1038/nature12596. [DOI] [PMC free article] [PubMed] [Google Scholar]
- 71.Tang X, Falls DL, Li X, Lane T, Luskin MB. Antigen-retrieval procedure for bromodeoxyuridine immunolabeling with concurrent labeling of nuclear DNA and antigens damaged by HCl pretreatment. J. Neurosci. 2007;27:5837–5844. doi: 10.1523/JNEUROSCI.5048-06.2007. [DOI] [PMC free article] [PubMed] [Google Scholar]
- 72.Paxinos, G. & Franklin, K. The Mouse Brain in Stereotaxic Coordinates, second edition (Elsevier Academic Press) (2001).
Associated Data
This section collects any data citations, data availability statements, or supplementary materials included in this article.


