Abstract
Yearly, over half of deceased-donor kidneys with kidney donor profile index (KDPI) > 85 were discarded, yet they could improve survival outcomes for dialysis patients. The potential risk of high-KDPI kidney transplant (KT) depends on the patient’s overall health summarized by functional status, which should be examined. The analyzed cohort consisted of adult deceased-donor KT candidates on dialysis listed in 2005–2014. A multivariate Cox proportional hazards model was fitted with functional status, measured using Karnofsky Performance Score (KPS), and transplant status as time-varying covariates. Derived from the Cox model, survival curves were analyzed to compare the survival outcomes between dialysis and transplant with different kidney qualities across three different KPS strata: 10–40, 50–70, and 80–100. With KDPI 0–99 KT, KPS 10–40 patients will survive ≥4.38 years median compared to 3.21 years median if they remained on dialysis. For KPS 50+ patients, the median survival years increase from 5.82–6.60 years on dialysis to ≥7.83 years after KDPI < 100 KT. The risk-adjusted analyses suggested that patients are expected to benefit more from KDPI 81–99 KT than from remaining on dialysis.
Introduction
Over 700,000 Americans were diagnosed with end-stage renal disease (ESRD) by the end of 20151. About 70% were on dialysis as their renal replacement therapy1. In the same year, about 100,000 adult patients were waitlisted to receive kidney transplant (KT), an alternative to dialysis that yields better quality of life, longer survival, and cheaper medical cost for ESRD patients2–6; however, only about 18,000 adult waitlisted patients received KTs, while about 9,000 others were removed from the waitlist due to deteriorating health or death7. Meanwhile, 3,159/14,637 recovered adult deceased-donor kidneys were discarded8 due to various reasons, such as biopsy findings and poor functioning status. Although not all discarded kidneys were considered viable, 938 (29.7%) of them were indicated as no recipient located – listed exhausted, meaning that the organ procurement organization (OPO) failed to find a transplant center willing to accept the kidney in time9. No recipient located – listed exhausted remained the second most common discard reason in recent years: its percentage rose from 12.8% in 2008 to 29.7% in 20159,10. Although a kidney offer can be refused for several reasons, such as compatibility issues and transplant program criteria, kidney quality seems to determine its acceptability. Huml et al. showed that 30.7% of offers in 2007–2012 were refused due to donor age or quality as the leading reason11. Marrero et al. reported that kidney donor risk index (KDRI) had strong discriminant ability (concordance of 0.83) that predicts discard12. Bae et al. demonstrated that higher kidney donor profile index (KDPI) was associated with higher discard rate13. Refusing a low-quality kidney may be due to risk aversion by transplant centers and KT candidates14–17. Less than half of KT candidates (47.8%) were willing to accept KDPI > 85 kidneys7, and 59.1% of kidneys with KDPI > 85 were discarded. (Throughout this article, KDPI > 85 kidneys will be called high-KDPI kidneys.) To alleviate the high kidney demand and the unwanted removals of waitlisted candidates, the United Network for Organ Sharing and the transplant centers must adapt their strategies regarding high-KDPI kidneys without worsening post-transplant survival outcomes for ESRD patients.
To understand the risk of transplanting high-KDPI kidneys in patients with different levels of physical health, this study examined the implications of patient functional status on survival outcomes between dialysis and deceased-donor kidney transplant (DDKT). Functional status could be incorporated into the decision-making process practiced by transplant centers to determine whether their listed candidates might benefit more from high-KDPI KTs than from dialysis. Transplantation professionals have taken an interest in examining functional status because it potentially represents a patient’s physiological age and predicts post-transplant survival outcomes18. Recorded in the Scientific Registry of Transplant Recipients (SRTR) and Organ Procurement and Transplantation Network (OPTN) data, the Karnofsky Performance Score (KPS) measures functional status using an 11-point rating scale, summarized in Table 1. First proposed as an assessment tool in oncology19, KPS gained traction as an independent risk factor for mortality in various renal clinical settings, such as for acute renal failure20 and ESRD21. Cox models were estimated to compare survival outcomes between dialysis and DDKT. Statistical analyses based on these models might demonstrate the extent patients may benefit from accepting a high-KDPI kidney compared to staying on dialysis. Therefore, they might guide centers to develop protocols that allocate high-KDPI kidneys to patients who will not receive transplants otherwise.
Table 1:
Karnofsky Performance Score Index
| Strata | Score | Description |
|---|---|---|
| Requires no assistance | 100 | Normal, no complaints, no evidence of disease |
| 90 | Able to carry on normal activity: minor symptoms of disease | |
| 80 | Normal activity with effort: some symptoms of disease | |
| Requires partial assistance | 70 | Cares for self: unable to carry on normal activity or active work |
| 60 | Requires occasional assistance but is able to care for needs | |
| 50 | Requires considerable assistance and frequent medical care | |
| Requires complete assistance | 40 | Disabled: requires special care and assistance |
| 30 | Severely disabled: hospitalization is indicated, death not imminent | |
| 20 | Very sick, hospitalization necessary: active treatment necessary | |
| 10 | Moribund, fatal processes progressing rapidly | |
| Dead | 0 | Dead |
Materials and Methods
Datasets
This study used SRTR data that includes information on all donors, waitlisted candidates, and transplant recipients in the US submitted by the OPTN members. The Health Resources and Services Administration, U.S. Department of Health and Human Services provides oversight to the activities of the OPTN and SRTR contractors.
The SRTR data was used to perform statistical analyses on 97,321 DDKT candidates listed from July 1, 2005, to January 1, 2014. They were at least 18 years old at the time of listing, and they were on dialysis before or on the day of listing. Candidates were removed if they transferred to another center; were listed in error; were listed for unacceptable antigens only; were transplanted at another center; received international, emergency, multi-organ, or living donor transplant; or became inactive for at least two years. Candidates were right-censored if they were lost to follow-up, or they survived by January 1, 2014.
Covariates
The following DDKT candidates’ covariates were used to estimate the Cox proportional hazards model: blood type, age at listing, diagnosis at listing, diabetes type, education, ethnicity (Latino or Non-Latino), functional status, gender, history of malignancy, history of previous transplants, primary source of payment, peripheral vascular disease status, race, time on dialysis before transplant, and transplant status. Most of these covariates are used in the current risk-adjusted SRTR survival models for post-transplant mortality22. Functional status was measured using KPS in the SRTR data. It was recorded twice: at the time of listing and at the time of transplant. We stratified KPS into four categories: 10–40, 50–70, 80–100, and “Unknown.” This stratification, summarized in Table 1, was based on recent literatures that examined KPS in transplantation23–25. KDRI26, which measures deceased-donor kidney quality, was derived from donor characteristics available in SRTR data. The model used KDRI (RAO) instead of KDPI since KDPI remaps KDRI to an integer-valued percentage ranging from 0 to 100, thus losing granularity on the kidney quality27. The covariates are summarized in Tables 2 and 3. Table 4 counts the number of deaths and provides the prevalence rate for each KPS strata at listing and at transplant.
Table 2:
Summary of covariates for deceased-donor kidney transplant candidates listed from 2007/07/01 – 2014/01/01.
| Covariates | N=97321 |
|---|---|
| Age at Listing (mean±SD) | 52.70±12.92 |
| Latino | 18.28% |
| Race | |
| Caucasian | 59.00% |
| Asian | 5.72% |
| Black | 33.19% |
| Other | 2.09% |
| Blood Type | |
| A | 33.61% |
| AB | 4.44% |
| B | 14.24% |
| O | 47.71% |
| Diabetes | |
| Type 1 | 6.02% |
| Type 2 | 38.47% |
| Other | 2.88% |
| Education | |
| Grade School/None | 8.31% |
| High School | 43.32% |
| Technical/Some College | 22.27% |
| College | 17.61% |
| Unknown/Missing | 8.49% |
| Gender | |
| Male | 62.06% |
| Female | 37.94% |
| Kidney Primary Diagnosis at Listing | |
| Congenital, Rare Familial, & Metabolic Disorders | 1.01% |
| Diabetes | 36.81% |
| Glomerular Diseases | 16.24% |
| Hypertensive Nephrosclerosis | 25.70% |
| Unknown/Other | 20.23% |
| Peripheral Vascular Disease | |
| Positive | 6.93% |
| Unknown | 2.51% |
| Previous Malignancy | |
| Positive | 6.13% |
| Unknown | 1.90% |
| Previous Transplant | 14.23% |
| Primary Payment | |
| Public | 68.54% |
| Private/Other/Unknown | 31.46% |
| Karnofsky Performance Score at Listing | |
| 10–40 | 2.01% |
| 50–70 | 27.45% |
| 80–100 | 63.64% |
| Unknown | 6.90% |
| Received Transplant | 49.82% (48486) |
| Death | 28.57%(27807s) |
Table 3:
Summary of covariates for deceased-donor kidney transplant recipients listed from 2007/07/01 – 2014/01/01.
| Covariates | N=48486 |
|---|---|
| Karnofsky Performance Score at Transplant | |
| 10–40 | 2.65% |
| 50–70 | 30.48% |
| 80–100 | 62.74% |
| Unknown | 4.13% |
| KDRI (mean±SD) Missing |
1.26±0.39 5.99% |
| Time on Dialysis until Transplant in Days (mean±SD) | 1639.84±1137.38 |
| Death | 11.90% (5769) |
Table 4:
Number of deaths among listed patients and transplanted patients for each KPS stratum
| Karnofsky Performance Score at Listing | Number of Deaths among Listed Patients |
|---|---|
| 10–40 | 712 (2.56%) |
| 50–70 | 7694 (27.67%) |
| 80–100 | 17201 (61.86%) |
| Unknown | 2200 (7.91%) |
| Total | 27807 |
| Karnofsky Performance Score at Transplant | Number of Deaths among Transplanted Patients |
|---|---|
| 10–40 | 278 (4.82%) |
| 50–70 | 1872 (32.45%) |
| 80–100 | 3411 (59.13%) |
| Unknown | 208 (3.61%) |
| Total | 5769 |
Missing Data
The candidate covariates had some values recorded as unknown/missing. If a categorical candidate covariate had at least 1% missing or unknown, these values were treated together in a separate category. None of the considered categorical covariates had less than 1% missing or unknown values. The numeric candidate covariates considered in this study had no missing values. Hence, imputation was not necessary for the candidate covariates. The percentage of missing data for each candidate covariate is shown in Tables 2 and 3.
Because some donor covariates used to compute KDRI were missing in data, multiple imputation by chained equations28 was applied to them to impute KDRI. The imputation method applied logistic regression for binary categorical covariates and predictive mean matching for numeric covariates. After imputation, 10 multiply imputed datasets were obtained and used to compute 10 different sets of KDRI values. Each set of KDRI values was concatenated to the dataset of candidate covariates. Therefore, 10 datasets of candidate covariates were obtained and used to build the survival models.
Transplant Statistical Analysis
Statistical analyses were performed using the R programming language29, which has the mice package28 for imputation and the survival package30 for survival modeling.
We divided each of the 10 imputed datasets into three separate datasets based on KPS: 10–40, 50–70, and 80–100. A univariate Cox model, where transplant is the only predictor and is also time-varying, was fitted onto each of the 30 data subsets.
A multivariate Cox model was fitted onto each of the entire 10 imputed datasets. Functional status, time on dialysis, transplant status, and KDRI were treated as time-varying covariates. That is, for waitlisted candidates, their functional statuses remained the same since listing and their transplant statuses and KDRIs were null (set to 0 numerically), but when transplanted, their functional statuses, transplant statuses, and KDRI values were updated according to information at the time of transplant. Note that the reason for excluding waiting time as an explicit covariate is because it is already accounted for by having transplant status as a time-varying covariate. The average concordance of the multivariate models was 0.664. Because the total number of covariates considered in the model is 32 and the total number of deaths is 27,807, the number of events per independent variables (EPV) is 27,807/32 = 868.97 > 10, thus ensuring accurate estimation of the regression coefficients when fitting the Cox models31. Furthermore, the EPV exceed 40–50, the recommended value that ensures minimal bias in estimating regression coefficients of binary covariates, such as KPS 10–40, with very low prevalence32.
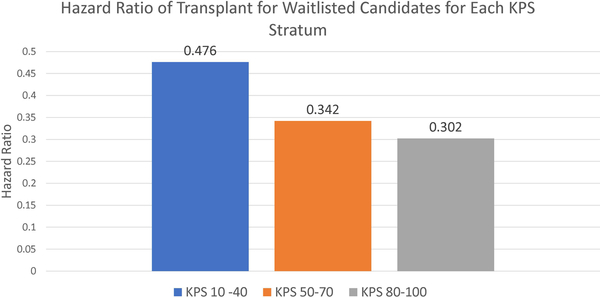
For each model, a set of coefficients was obtained. The 10 sets of coefficients were averaged to obtain the pooled coefficients, which were used to construct the pooled Cox model. For the univariate Cox models, the hazard ratios for transplant for every KPS strata are shown in Figure 1. For the multivariate Cox models, the pooled coefficients and their 95% confidence intervals, hazard ratios, and p-values were recorded in Table 5. The pooled standard deviations used to compute the confidence intervals and p-values were estimated using Rubin’s method33,34.
Figure 1:
Hazard ratios of receiving transplant vs staying on dialysis for KPS strata 10–40, 50–70, and 80–100. (p< 0.001 for transplant for all three strata)
Table 5:
Pooled coefficients of multivariate Cox proportional hazard model and their 95% confidence intervals, hazard ratios, and p-values.
| Covariates | Coefficients | 95% Confidence Intervals | Hazard Ratio | P-Value |
|---|---|---|---|---|
| Age at Listing | 2.22E-02 | (2.10E-02, 2.33E-02) | 1.02 | <0.001 |
| Latino | −0.31 | (−0.35, −0.27) | 0.73 | <0.001 |
| Race | ||||
| Caucasian | Reference | |||
| Asian | −0.38 | (−0.43, −0.32) | 0.69 | <0.001 |
| Black | −0.32 | (−0.35, −0.29) | 0.73 | <0.001 |
| Other | −0.37 | (−0.45, −0.28) | 0.69 | <0.001 |
| Blood Type | ||||
| A | −2.31E-02 | (−5.02E-02, 3.92E-03) | 0.98 | 0.09 |
| AB | 3.37E-03 | 1.00 | 0.92 | |
| B | 1.12E-02 | (−6.03E-02, 6.70E-02) | 1.01 | 0.53 |
| O | Reference | (−2.39E-02, 4.64E-02) | ||
| Diabetes | ||||
| None | −0.40 | (−0.47, −0.33) | 0.67 | <0.001 |
| Type 1 | 0.16 | (8.43E-02, 0.24) | 1.17 | <0.001 |
| Type 2 | −5.25E-02 | (−0.12, 1.33E-02) | 0.95 | 0.12 |
| Other | Reference | |||
| Education | ||||
| Grade School/None | −0.27 | (−0.33, −0.21) | 0.76 | <0.001 |
| High School | −6.26E-02 | (−0.11, −1.98E-02) | 0.94 | 0.004 |
| Technical/Some College | −4.23E-02 | (−8.85E-02, 3.90E-03) | 0.96 | 0.07 |
| College | −3.18E-02 | 0.97 | 0.19 | |
| Unknown/Missing | Reference | (−7.96E-02, 1.60E-02) | ||
| Gender | ||||
| Male | 1.71E-02 | (−7.43E-03, 4.16E-02) | 1.02 | 0.17 |
| Female | Reference | |||
| Kidney Primary Diagnosis at Listing | ||||
| Congenital, Rare Familial, & Metabolic Disorders | −0.25 | (−0.40, −0.10) | 0.78 | 0.001 |
| Diabetes | 8.10E-02 | (3.61E-02, 0.13) | 1.08 | <0.001 |
| Glomerular Diseases | −0.12 | (−0.16, −7.21E-02) | 0.89 | <0.001 |
| Hypertensive Nephrosclerosis | −2.34E-02 | (−6.20E-02, 1.52E-02) | 0.98 | 0.24 |
| Unknown/Other | Reference | |||
| Peripheral Vascular Disease | ||||
| Positive | 0.22 | (0.18, 0.27) | 1.25 | <0.001 |
| Unknown | 0.19 | (0.10, 0.26) | 1.20 | <0.001 |
| Negative | Reference | |||
| Previous Malignancy | ||||
| Positive | 5.99E-02 | (1.25E-02, 0.11) | 1.06 | 0.01 |
| Unknown | −8.68E-03 | (−0.10, 8.63E-02) | 0.99 | 0.86 |
| Negative | Reference | |||
| Previous Transplant | 0.33 | (0.30, 0.37) | 1.40 | <0.001 |
| Primary Payment | ||||
| Public | 0.11 | (7.98E-02, 0.13) | 1.11 | <0.001 |
| Private/Other/Unknown | Reference | |||
| Karnofsky Performance Score | ||||
| 10–40 | 0.90 | (0.81, 0.98) | 2.45 | <0.001 |
| 50–70 | 0.12 | (7.03E-02, 0.17) | 1.13 | <0.001 |
| 80–100 | −3.65E-02 | (−8.41E-02, 1.11E-02) | 0.96 | 0.13 |
| Unknown | Reference | |||
| Received Transplant | −2.00 | (−2.09, −1.91) | 0.14 | <0.001 |
| KDRI | 0.55 | (0.49, 0.60) | 1.73 | <0.001 |
| Time on Dialysis until Transplant in Days | 6.94E-05 | (4.50E-05, 9.38E-05) | 1.00 | <0.001 |
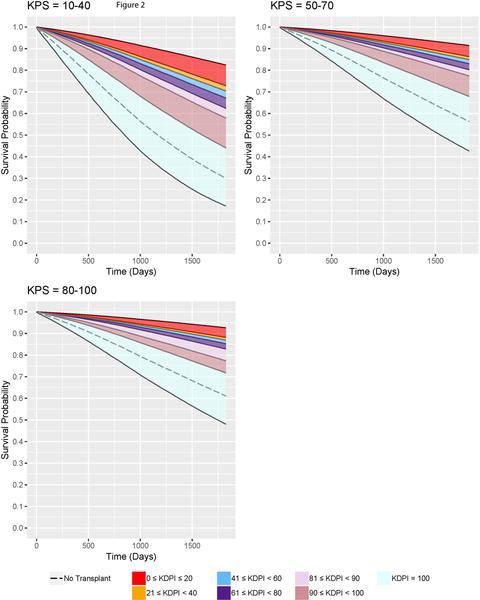
From the pooled multivariate Cox models, the adjusted expected survival curves were constructed. In order to construct the expected survival curves conditional on the specified functional status and KDRI, the combinations of categorical covariates were listed along with their frequencies within the dataset of candidate covariates. The list was converted to a dataset, where each observation corresponded to a unique combination. The dataset also had a numeric covariate age at listing whose value was the mean age at listing among the observations in the dataset of candidate covariates. Every observation in the newly constructed dataset had the same given functional status and KDRI to construct the survival curves conditioned on them. The pooled Cox model was used to estimate the survival curve of each observation of the new dataset. With the normalized frequencies as the weights, the weighted average of these estimated survival curves formed the adjusted expected survival curve conditional on the given functional status and KDRI35. For ease of interpretation, KDRI was converted to KDPI27 in our analyses so that we examined KDPI 0–20, 21–40, 41–60, 61–80, 81–90, 91–99, and 100. Table 6 provides a conversion reference. The families of survival curves are shown in Figure 2. Note that the survival curves for the transplanted patients assume that the patients receive transplant at the same time of listing so that we have a direct comparison of survival between transplanted patients and not-transplanted patients. From these survival curves, the 5-year survival probabilities are recorded in Table 7, and the median survival times are reported in Table 8.
Table 6:
KDRI to KDPI Conversion Table (2017)
| KDRI Range | KDPI Range |
|---|---|
| [0.000, 0.918] | 0%–20% |
| (0.918, 1.107] | 21%–40% |
| (1.107, 1.339] | 41%–60% |
| (1.339, 1.664] | 61%–80% |
| (1.664, 1.937] | 81%–90% |
| (1.937, 2.707] | 91%–99% |
| (2.707, 4.191] | 100% |
Figure 2:
Families of adjusted expected five-year survival curves conditional on KDPI for DDKT candidates of each KPS stratum.
Table 7:
5-year survival probabilities of remaining on dialysis vs. kidney transplant for each KPS stratum. Upper bound of the survival probabilities range corresponds to the lowest KDPI of the given KDPI range; lower bound of the survival probabilities range corresponds to the highest KDPI of the given KDPI range.
| KPS 10–40 | KPS 50–70 | KPS 80–100 | |
|---|---|---|---|
| KDPI 0–20 Kidney Transplant | [72.81%, 82.42%] | [86.26%, 91.42%] | [88.12%, 92.62%] |
| KDPI 21–40 Kidney Transplant | [70.39%, 72.81%) | [84.90%, 86.26%) | [86.93%, 88.12%) |
| KDPI 41–60 Kidney Transplant | [67.20%, 70.39%) | [83.06%, 84.90%) | [85.31%, 86.93%) |
| KDPI 61–80 Kidney Transplant | [62.32%, 67.20%) | [80.15%, 83.06%) | [82.74%, 85.31%) |
| KDPI 81–90 Kidney Transplant | [57.89%, 62.32%) | [77.39%, 80.15%) | [77.39%, 82.74%) |
| KDPI 91–99 Kidney Transplant | [44.03%, 57.89%) | [67.85%, 77.39%) | [71.71%, 77.39%) |
| KDPI 100 Kidney Transplant | [17.27%, 44.03%) | [42.73%, 67.85%) | [48.11%, 71.71%) |
| Dialysis | 30.06% | 56.31% | 61.07% |
Table 8:
Median years of survival of remaining on dialysis vs. kidney transplant for each KPS stratum. Upper bound of the median survival years range corresponds to the lowest KDPI of the given KDPI range; lower bound of the median survival years range corresponds to the highest KDPI of the given KDPI range.
| KPS 10–40 | KPS 50–70 | KPS 80–100 | |
|---|---|---|---|
| KDPI 0–20 Kidney Transplant | [8.97, NA] | [N/A, N/A] | [N/A, N/A) |
| KDPI 21–40 Kidney Transplant | [8.41, 8.97) | [N/A, N/A) | [N/A, N/A) |
| KDPI 41–60 Kidney Transplant | [7.73, 8.41) | [N/A, N/A) | [N/A, N/A) |
| KDPI 61–80 Kidney Transplant | [6.80, 7.73) | [9.85, N/A) | [N/A, N/A) |
| KDPI 81–90 Kidney Transplant | [6.10, 6.80) | [9.74, 9.85) | [9.74, N/A) |
| KDPI 91–99 Kidney Transplant | [4.38, 6.10) | [7.83, 9.74) | [8.71, 9.74) |
| KDPI 100 Kidney Transplant | [2.34, 4.38) | [4.25, 7.83) | [4.79, 8.71) |
| Dialysis | 3.21 | 5.82 | 6.60 |
N/A – median survival years was unable to be estimated.
Post-Transplant Follow-up Analysis
Among the DDKT patients who were followed up within one year of transplant, we omitted patients with unknown KDRI/KDPI and KPS at transplant. Hence, we examined the latest graft statuses within one year of transplant of 40,757 total patients. Afterward, we omitted patients with unknown KPS at times of transplant and latest follow-up within one year of transplant. Finally, we analyzed 37,813 total patients for their KPS changes.
Disclaimer
This study was obtained under IRB approval (STU00204041) from Northwestern University Institutional Review Board. All identifiers were removed upon data receipt for the purposes of this study.
Results
KPS Distribution at Listing and at Transplant
97,321 adult patients who were on hemodialysis or peritoneal dialysis were identified among the DDKT candidates listed from July 1, 2005, to January 1, 2014. According to Table 2, the most prevalent KPS recorded at listing was 80–100 (approximately 64%), followed by 50–70 (approximately 27%), and then 10–40 (approximately 2%). In addition, approximately 7% of the cohort had their KPS at listing recorded as unknown. Among the analyzed cohort, only 48,486 candidates received transplant. According to Table 3, the KPS distribution at transplant resembles the KPS distribution at listing. Reasons for the similarity between KPS distributions in both listing and transplant cohorts are unclear. Therefore, approximately 90% of the listed candidates and 90% of the DDKT recipients were capable of self-care.
Dialysis vs. Transplant in General Population
In the analyzed cohort, 27,807 (28.57%) died, both on waitlist and post-transplant. Among the 48,486 transplanted, only 5,769 died post-transplant, suggesting that transplant yielded better survival outcomes than dialysis. According to Figure 1, the hazard ratios for KPS 10–40, 50–70, and 80–100, obtained from the pooled univariate Cox models with transplant as a time-varying covariate, were less than 0.5, validating that transplant is generally a better treatment for ESRD than dialysis. From Table 5, the pooled multivariate Cox model showed that receiving transplant was a statistically significant predictor for mortality (p <0.001). The hazard ratio for receiving transplant was 0.14, indicating that a transplanted patient is less likely to die than a dialysis patient.
However, KT does not guarantee the same survival outcomes between any two patients because it depends on the kidney quality, a statistically significant covariate in the survival model (p <0.001). Because in the multivariate Cox model, the coefficient for KDRI covariate is 0.55 and the coefficient for transplant status covariate is −2.00, the kidney quality must have a KDRI > 3.64 for transplant to yield worse expected survival benefits than remaining on dialysis without receiving a better-quality offer. A kidney with KDRI 3.64 is extremely rare as it corresponds to KDPI 100. Hence, a patient with any KPS is expected to benefit more from transplant than from staying on dialysis for the rest of his or her life. However, survival outcomes between any two otherwise similar patients who are transplanted with the same quality kidneys may differ because of their functional statuses.
Impact of Functional Status on Patient Mortality
Table 5 presents that KPS 10–40 and KPS 50–70 were significant predictors in patient mortality (p < 0.001 for both).
Figure 2 shows the families of adjusted expected survival curves conditional on KDRI and each KPS stratum up to five years. Survival curves for non-transplanted patients were also plotted for comparison. Table 7 provides the ranges of 5-year survival probabilities. In this table, for a specific KPS stratum and KDPI range, the upper bound of the survival probabilities range corresponds to the lowest KDPI in the given KDPI range while the lower bound corresponds to the highest KDPI. The survival curves validate that KPS 10–40 patients have the worst survival outcomes with KDPI 0–99 KTs or with dialysis. On dialysis, their 5-year survival probabilities are 30.06%; with KDPI 0–99 KTs, their expected 5-year survival probabilities improve to 44.03%−82.42%. KPS 50–70 patients have better survival outcomes than do KPS 10–40 patients. Remaining on dialysis, they have 56.31% probabilities of surviving up to 5 years, but after accepting KDPI 0–99 KTs, they have 67.85%−91.42% probabilities. KPS 80–100 patients on dialysis have 61.07% probabilities living up to 5 years. However, their probabilities will improve to 71.71%−92.62% if transplanted with KDPI 0–99 kidneys. The results show that the survival probabilities for dialysis patients with any KPS increase significantly after receiving KDPI 0–99 KTs.
Table 8 provides the median survival years of remaining on dialysis and KTs with different ranges of KDPIs for each KPS stratum. In this table, for a specific KPS stratum and KDPI range, the upper bound of the median survival years range corresponds to the lowest KDPI in the given KDPI range while the lower bound corresponds to the highest KDPI. On dialysis, KPS 10–40 patients have median survival of 3.21 years, but after accepting KDPI 81–99 KTs, their median survival increases to 4.38–6.80 years. KPS 50–70 patients would gain more from KDPI 80–99 kidneys than KPS 10–30 patients since their median survival would increase from 5.82 years to 7.83–9.85 years. For KPS 80–100, the median survival increases from 6.60 years to at least 8.71 years after being transplanted with KDPI 0–99 kidneys. The results show that even with KDPI 99 KTs, KPS ≥50 patients will gain at least two years in median survival.
Post-Transplant Follow-up Outcomes
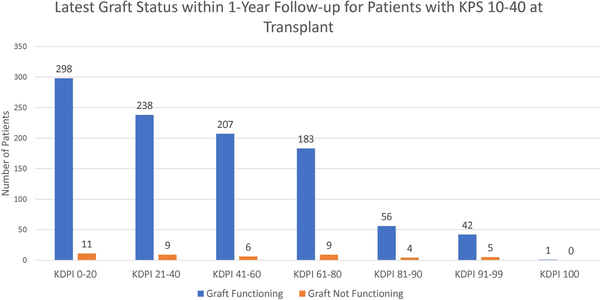
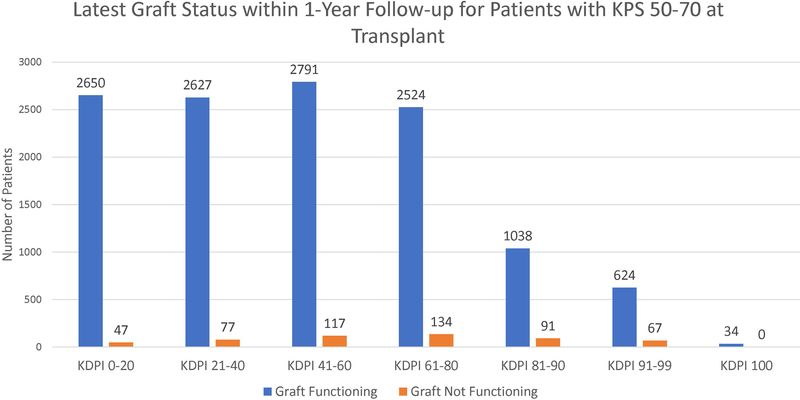
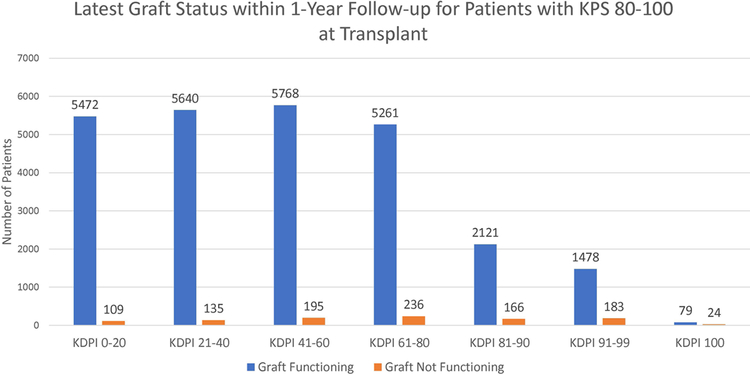
Figure 3 shows the latest graft statuses within one year of transplant for each KPS stratum. According to the figure, most patients had functioning grafts within one year. Most notably, among the patients transplanted with KDPI 81–99 kidneys, 91.59% of KPS 10–40 patients, 91.32% of KPS 50–70 patients, and 91.16% of KPS 80–100 patients still had functioning grafts.
Figure 3:
Latest graft statuses within 1-year follow-up of patients for each KPS stratum for each KDPI stratum.
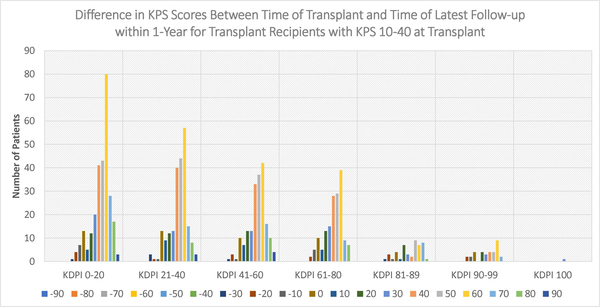
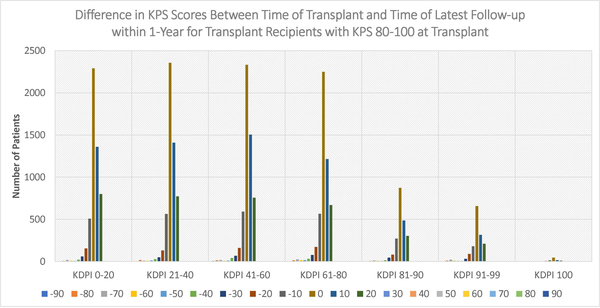
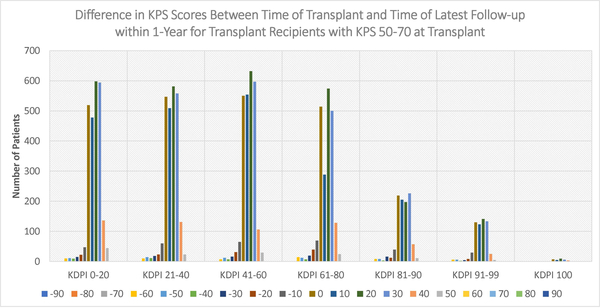
Figures 4–6 display the distributions of differences in KPS for every KDPI range for patients with KPS 10–40, 50–70, and 80–100, respectively, at transplant. Accompanying the figures is Table 9, which records the average change in KPS for each KPS stratum and KDPI range. Figures 4–5 demonstrate that transplants with KDPI 0–99 kidneys improved the KPS of most patients with KPS 10–70 at transplant. More specifically, when transplanted with KDPI 0–99 kidneys, patients with KPS 10–40 at transplant experienced an average increase of 33.82–47.04 points, while patients with KPS 50–70 experienced 13.04–15.84 points. According to Figure 6, the modes of the KPS differences across the five KDPI ranges are 0. For KPS 80–100 patients with KDPI 0–99 KTs, the average change was marginal since it was −0.33-+3.14 points, especially because these patients were the most physically able among the transplant recipients.
Figure 4:
Distribution of differences between KPS at transplant and KPS at latest follow-up within 1-year (KPS 10–40 at Transplant)
Figure 6:
Distribution of differences between KPS at transplant and KPS at latest follow-up within 1-year (KPS 80–100 at Transplant)
Table 9:
Average change in KPS after transplant within one year
| KPS 10–40 n=927 |
KPS 50–70 n=12360 |
KPS 80–100 n=26131 |
|
|---|---|---|---|
| KDPI 0–20 Kidney Transplant | +47.04 n=274 |
+15.84 n=2483 |
+3.14 n=5227 |
| KDPI 21–40 Kidney Transplant | +44.66 n=219 |
+14.69 n=2485 |
+2.89 n=5351 |
| KDPI 41–60 Kidney Transplant | +45.21 n=190 |
+14.86 n=2606 |
+2.48 n=5502 |
| KDPI 61–80 Kidney Transplant | +41.79 n=162 |
+14.59 n=2188 |
+1.66 n=5044 |
| KDPI 81–90 Kidney Transplant | +36.81 n=47 |
+13.48 n=1001 |
+1.26 n=2102 |
| KDPI 91–99 Kidney Transplant | +33.82 n=34 |
+13.04 n=612 |
−0.33 n=1529 |
| KDPI 100 Kidney Transplant | +30 n=1 |
+15.48 n=31 |
−2.74 n=95 |
Figure 5:
Distribution of differences between KPS at transplant and KPS at latest follow-up within 1-year (KPS 50–70 at Transplant)
Discussion
Functional status and its impact on post-transplant mortality for KT recipients have been confirmed in other studies. Kutner et al. fitted a multivariate Cox proportional hazard model including functional status as a covariate onto a dataset of 366 transplant patients, including living-donor and deceased-donor recipients, to estimate post-transplant hospitalization and death36. Reese et al. expanded the study to 10,994 KT recipients and estimated three-year post-transplant mortality37. Both works confirmed the statistical significance of functional status, but instead of KPS, they used Physical Functioning domain of the Medical Outcomes Study 36-Item Short Form Health Survey38, which was scored by the patients themselves instead of the medical professionals. The association between functional status and waitlist mortality among DDKT candidates was not widely studied. Reese et al. appears to be the only group to have examined it: they compared the survival outcomes between remaining on the waitlist and receiving KT for each functional status stratum, but they did not investigate the implications of kidney quality39.
Motivated by the potential utility of functional status in transplantation, this study considered KPS as a potential predictor in pre-transplant and post-transplant mortality for DDKT candidates. KPS was validated as an appropriate, physician-assessed measure for functional status40. Furthermore, it was confirmed as an independent predictor for post-transplant mortality for liver25 and lung41,42 recipients. Different from other works, this study compared the survival outcomes between dialysis and deceased-donor transplant with varying levels of kidney quality for each KPS stratum. The statistical results discussed earlier demonstrated that KDPI 81–99 kidneys could improve dialysis patients’ survival outcomes. They could provide further guidance about high-KDPI KTs while accounting for functional statuses. Potentially, the 60% discard rate of kidneys with KDPI > 85 in recent years7,43 would decrease, improving accessibility to KTs.
This study complements the work by Massie et al.44, who built a Cox regression model to examine the survival benefits of high-KDPI KTs. It confirms their arguments that patients with KDPI 81–100 KTs are more likely to survive for at least four years than patients on dialysis. Different from their work, this study examined kidney quality as a continuous covariate by measuring it using KDRI instead of four transplant-related binary covariates -- KDPI 0–70, 71–80, 81–90, and 91–100 transplants. Thus, the Cox model in this study allows for more granular sensitivity analysis to be performed on the expected survival probabilities with respect to both KDRI and KPS. Furthermore, it reveals that KDPI 100 KTs could potentially be worse than staying on dialysis for patients with any KPS. Both this work and Massie et al.’s work support that DDKT candidates are most likely better off with accepting high-KDPI kidneys than to remain on dialysis and not receive a transplant. Although DDKT candidates can risk the wait for lower-KDPI kidney, the time until next offer is uncertain because it depends on the patients’ health, compatibility, and transplant center and the availability of the lower-KDPI kidney45,46. Massie et al. confirmed that KDPI 81–100 KTs would yield lower mortality risk after 6.0–7.2 months and better survival after 18.0–19.8 months than waiting for KDPI < 80 kidneys47. If a transplant center cannot guarantee the next better offer within the next two years, DDKT candidates may be better off with high-KDPI KTs if they want better long-term survival. Therefore, a high-KDPI kidney should thoroughly be considered before being refused.
By transplanting more high-KDPI kidneys, more lives could be saved, resulting in less patients removed from the waitlist due to health deterioration or death. Table 10 shows the number of patients listed for KT, the number removed due to health deterioration or death, and the number transplanted each year. According to it, less than half of the patients listed each year eventually received transplant while patients who waited too long were more likely to face removals. For example, among the 21,735 patients listed in 2007, 1,579 patients were removed due to health deterioration while 3,853 patients died. These numbers will continue to increase if they wait any longer.
Table 10:
Number of patients on dialysis removed due to death or due to being too sick for transplant as of 9/02/2015.
| Year Listed | Number of Patient Deaths (Percentage of Patient Listed who Died) |
Number of Patients Removed Due to Being Too Sick for Transplant (Percentage of Patient Listed who were Removed due to Being too Sick for Transplant) |
Number of Patients Transplanted Either Deceased Donor or Living (Percentage of Patients Transplanted) |
Total Number of Patients Listed |
|---|---|---|---|---|
| 2006 | 3833 (17.64%) |
1579 (7.26%) |
10707 (49.26%) |
21735 |
| 2007 | 3074 (16.10%) |
1516 (7.94%) |
9301 (48.72%) |
19090 |
| 2008 | 2686 (15.22%) |
1487 (8.42%) |
8296 (47.00%) |
17651 |
| 2009 | 2572 (14.26%) |
1492 (8.27%) |
8059 (44.67%) |
18040 |
| 2010 | 2707 (13.58%) |
1632 (8.18%) |
7898 (39.61%) |
19941 |
| 2011 | 2266 (11.05%) |
1448 (7.06%) |
7256 (35.37%) |
20516 |
| 2012 | 1922 (8.90%) |
1248 (5.78%) |
6397 (29.64%) |
21584 |
| 2013 | 1319 (5.91%) |
907 (4.06%) |
5387 (24.12%) |
22334 |
The decision to accept a high-KDPI offer is made predominantly by the transplant surgeons. Solomon et al.48 surveyed 62 KT surgeons and learned that the top three factors for accepting a kidney offer were kidney quality, donor-recipient match, and kidney function. This suggested surgeons’ bias against accepting high-KDPI kidneys, so to decrease their discard rate, shared decision making should be encouraged to provide the best mutually agreed treatment. The shared decision-making process between physicians and patients allows patients to be thoroughly informed of their options, such as whether to accept high-KDPI kidneys, and their potential impact on their health49. This process can be complemented by various analytic tools50–52 to determine the wait time for their next offer and quantify their survival benefits of their available treatment options.
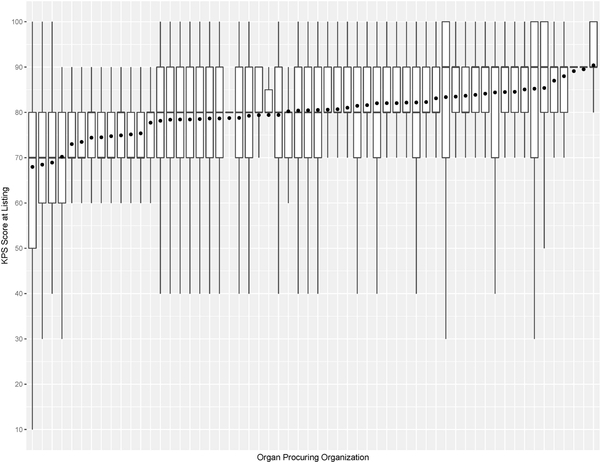
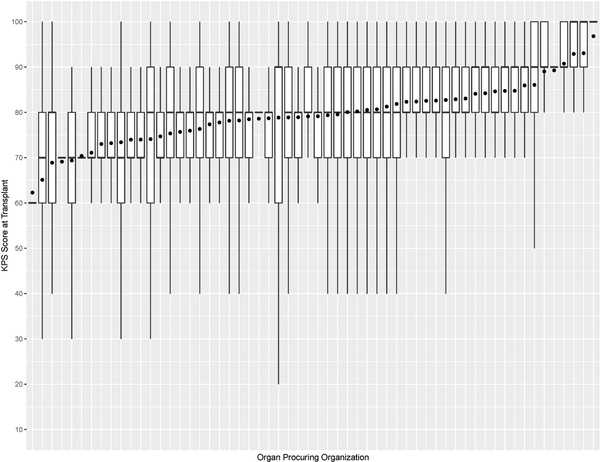
This study has some limitations. For example, KPS is susceptible to observer bias and its evaluation can vary within and between transplant centers. This is validated in Figure 7, which shows that the variations of KPS at listing and transplant across OPOs are not uniform. Moreover, the number of KPS 10–40 patients was significantly small, so post-transplant outcome prediction may not be accurate for them. KPS could be replaced with a more rigorous measure of health, such as frailty53 and nutritional parameters54. KDRI is another potentially problematic covariate used to predict post-transplant outcomes. When first proposed, it was reported to have a concordance of 0.6226. Recently, Zhong et al. reevaluated KDRI and reported it to have a concordance of about 0.6555. However, several studies47,56–58 confirmed KDRI as a statistically significant predictor of post-transplant outcomes. Even our study confirmed that KDRI is a significant predictor of post-transplant death. Another limitation is that SRTR data has missing data, which can affect survival model estimation. In addition, the survival model estimated in this study has an average concordance of 0.664. Finally, the analysis is heavily affected by selection bias when comparing between non-transplanted and transplanted patients because physicians determine whom and when and the type of kidney to transplant. There has been gender59,60 and racial disparities61,62 with access to KT. Moreover, the survey by Solomon et al. conveyed physicians’ strong bias against transplanting low-quality kidneys, but it noted that valid reasons for declining a kidney offer depend on the change in patient characteristics over time and heterogeneity of donor kidneys48.
Figure 7a:
Box plot of KPS at listing and mean KPS at listing (denoted as • in the plot) for each organ procuring organization
In conclusion, this study demonstrates that patients with any KPS could attain better survival outcomes and lower risk of death from receiving high-KDPI KTs than from remaining on dialysis without transplant.
Figure 7b:
Box plot of KPS at transplant and mean KPS at transplant (denoted as • in the plot) for each organ procuring organization
Acknowledgements
This research was supported in part through the computational resources and staff contributions provided for the Quest high performance computing facility at Northwestern University, which is jointly supported by the Office of the Provost, the Office for Research, and Northwestern University Information Technology. The authors acknowledge Dr. James R. Rodrigue from Beth Israel Deaconess Medical Center at Harvard Medical School for the helpful discussion.
The data reported here have been supplied by the Minneapolis Medical Research Foundation (MMRF) as the contractor for the Scientific Registry of Transplant Recipients (SRTR). The interpretation and reporting of these data are the responsibility of the author(s) and in no way should be seen as an official policy of or interpretation by the SRTR or the U.S. Government.
This work is funded by National Institutes for Health award 1R21DK108104–01.
Abbreviations
- CMS
Centers for Medicare and Medicaid Services
- DDKT
deceased-donor kidney transplant
- EPV
number of events per independent variables
- ESRD
end-stage renal disease
- KDPI
kidney donor profile index
- KDRI
kidney donor risk index
- KPS
Karnofsky Performance Score
- KT
kidney transplant
- OPO
organ procurement organization
- OPTN
Organ Procurement and Transplantation Network
- SD
standard deviation
- SRTR
Scientific Registry of Transplant Recipients
Footnotes
Authors have no conflicts of interest to disclose.
References
- 1.2017 USRDS Annual Data Report: Epidemiology of Kidney Disease in the United States. Bethesda, MD: 2017. [Google Scholar]
- 2.Khauli RB, Steinmuller DR, Novick AC, et al. A critical look at survival of diabetics with end-stage renal disease. Transplantation versus dialysis therapy. Transplantation. 1986;41(5):598–602. [PubMed] [Google Scholar]
- 3.Laupacis A, Keown P, Pus N, et al. A study of the quality of life and cost-utility of renal transplantation. Kidney international. 1996;50(1):235–242. [DOI] [PubMed] [Google Scholar]
- 4.Wolfe RA, Ashby VB, Milford EL, et al. Comparison of mortality in all patients on dialysis, patients on dialysis awaiting transplantation, and recipients of a first cadaveric transplant. New England Journal of Medicine. 1999;341(23):1725–1730. [DOI] [PubMed] [Google Scholar]
- 5.Meier-Kriesche H-U, Port F, Ojo A, et al. Deleterious effect of waiting time on renal transplant outcome. Paper presented at: Transplantation proceedings2001. [DOI] [PubMed] [Google Scholar]
- 6.Merion RM, Ashby VB, Wolfe RA, et al. Deceased-donor characteristics and the survival benefit of kidney transplantation. Jama. 2005;294(21):2726–2733. [DOI] [PubMed] [Google Scholar]
- 7.Hart A, Smith J, Skeans M, et al. OPTN/SRTR 2015 annual data report: kidney. American Journal of Transplantation. 2017;17(S1):21–116. [DOI] [PMC free article] [PubMed] [Google Scholar]
- 8.HRSA. Organ Procurement and Transplantation Network Data Reports. 2018.
- 9.Stewart DE, Garcia VC, Rosendale JD, Klassen DK, Carrico BJ. Diagnosing the decades-long rise in the deceased donor kidney discard rate in the United States. Transplantation. 2017;101(3):575–587. [DOI] [PubMed] [Google Scholar]
- 10.Reese PP, Harhay MN, Abt PL, Levine MH, Halpern SD. New solutions to reduce discard of kidneys donated for transplantation. Journal of the American Society of Nephrology. 2015:ASN. 2015010023. [DOI] [PMC free article] [PubMed] [Google Scholar]
- 11.Huml AM, Albert JM, Thornton JD, Sehgal AR. Outcomes of deceased donor kidney offers to patients at the top of the waiting list. Clinical Journal of the American Society of Nephrology. 2017;12(8):1311–1320. [DOI] [PMC free article] [PubMed] [Google Scholar]
- 12.Marrero WJ, Naik AS, Friedewald JJ, et al. Predictors of deceased donor kidney discard in the United States. Transplantation. 2017;101(7):1690–1697. [DOI] [PubMed] [Google Scholar]
- 13.Bae S, Massie AB, Luo X, Anjum S, Desai NM, Segev DL. Changes in discard rate after the introduction of the Kidney Donor Profile Index (KDPI). American Journal of Transplantation. 2016;16(7):2202–2207. [DOI] [PMC free article] [PubMed] [Google Scholar]
- 14.Heilman RL, Green EP, Reddy KS, Moss A, Kaplan B. Potential impact of risk and loss aversion on the process of accepting kidneys for transplantation. Transplantation. 2017;101(7):1514–1517. [DOI] [PubMed] [Google Scholar]
- 15.Axelrod D, Friedewald J. Utilizing High‐Risk Kidneys—Risks, Benefits, and Unintended Consequences? American Journal of Transplantation. 2016;16(9):2514–2515. [DOI] [PubMed] [Google Scholar]
- 16.Abecassis M, Burke R, Klintmalm G, et al. American Society of Transplant Surgeons transplant center outcomes requirements—a threat to innovation. American Journal of Transplantation. 2009;9(6):1279–1286. [DOI] [PubMed] [Google Scholar]
- 17.Snyder J, Salkowski N, Wey A, et al. Effects of High‐Risk Kidneys on Scientific Registry of Transplant Recipients Program Quality Reports. American Journal of Transplantation. 2016;16(9):2646–2653. [DOI] [PubMed] [Google Scholar]
- 18.Abecassis M, Bridges N, Clancy C, et al. Solid‐Organ Transplantation in Older Adults: Current Status and Future Research. American Journal of Transplantation. 2012;12(10):2608–2622. [DOI] [PMC free article] [PubMed] [Google Scholar]
- 19.Karnofsky DA. The clinical evaluation of chemotherapeutic agents in cancer. Evaluation of chemotherapeutic agents. 1949:191–205. [Google Scholar]
- 20.PEREZ VALDIVIESO JR, BES‐RASTROLLO M, Monedero P, De Irala J, JAVIER LAVILLA F. Karnofsky performance score in acute renal failure as a predictor of short‐term survival. Nephrology. 2007;12(6):533–538. [DOI] [PubMed] [Google Scholar]
- 21.McClellan WM, Anson C, Birkeli K, Tuttle E. Functional status and quality of life: Predictors of early mortality among patients entering treatment for end stage renal disease. Journal of clinical epidemiology. 1991;44(1):83–89. [DOI] [PubMed] [Google Scholar]
- 22.SRTR Risk Adjustment Model Documentation: Waitlist and Posttransplant Outcomes.
- 23.Grimm JC, Valero III V, Kilic A, et al. Preoperative performance status impacts perioperative morbidity and mortality after lung transplantation. The Annals of thoracic surgery. 2015;99(2):482–489. [DOI] [PubMed] [Google Scholar]
- 24.Thuluvath PJ, Thuluvath AJ, Savva Y. Karnofsky performance status before and after liver transplantation predicts graft and patient survival. Journal of hepatology. 2018;69(4):818–825. [DOI] [PubMed] [Google Scholar]
- 25.Dolgin NH, Martins PN, Movahedi B, Lapane KL, Anderson FA, Bozorgzadeh A. Functional status predicts postoperative mortality after liver transplantation. Clinical transplantation. 2016;30(11):1403–1410. [DOI] [PubMed] [Google Scholar]
- 26.Rao PS, Schaubel DE, Guidinger MK, et al. A comprehensive risk quantification score for deceased donor kidneys: the kidney donor risk index. Transplantation. 2009;88(2):231–236. [DOI] [PubMed] [Google Scholar]
- 27.OPTN. KDRI to KDPI Mapping Table. 2017.
- 28.Sv Buuren, Groothuis-Oudshoorn K. mice: Multivariate imputation by chained equations in R. Journal of statistical software. 2010:1–68. [Google Scholar]
- 29.Team RC. R: A Language and Environment for Statistical Computing. https://www.R-project.org. Published 2018. Accessed.
- 30.Therneau TM, Lumley T. Package ‘survival’. R package version. 2017:241–43. [Google Scholar]
- 31.Peduzzi P, Concato J, Feinstein AR, Holford TR. Importance of events per independent variable in proportional hazards regression analysis II. Accuracy and precision of regression estimates. Journal of clinical epidemiology. 1995;48(12):1503–1510. [DOI] [PubMed] [Google Scholar]
- 32.Austin PC, Allignol A, Fine JP. The number of primary events per variable affects estimation of the subdistribution hazard competing risks model. Journal of clinical epidemiology. 2017;83:75–84. [DOI] [PubMed] [Google Scholar]
- 33.Rubin DB. Multiple imputation for nonresponse in surveys. Vol 81: John Wiley & Sons; 2004. [Google Scholar]
- 34.Van Buuren S Flexible imputation of missing data. CRC press; 2012. [Google Scholar]
- 35.Therneau TM, Crowson CS, Atkinson EJ. Adjusted survival curves. In:2015.
- 36.Kutner NG, Zhang R, Bowles T, Painter P. Pretransplant physical functioning and kidney patients’ risk for posttransplantation hospitalization/death: evidence from a national cohort. Clinical Journal of the American Society of Nephrology. 2006;1(4):837–843. [DOI] [PubMed] [Google Scholar]
- 37.Reese PP, Bloom RD, Shults J, et al. Functional status and survival after kidney transplantation–. Transplantation. 2014;97(2):189. [DOI] [PMC free article] [PubMed] [Google Scholar]
- 38.Ware JE Jr, Sherbourne CD. The MOS 36-item short-form health survey (SF-36): I. Conceptual framework and item selection. Medical care. 1992:473–483. [PubMed] [Google Scholar]
- 39.Reese PP, Shults J, Bloom RD, et al. Functional status, time to transplantation, and survival benefit of kidney transplantation among wait-listed candidates. American Journal of Kidney Diseases. 2015;66(5):837–845. [DOI] [PMC free article] [PubMed] [Google Scholar]
- 40.Mor V, Laliberte L, Morris JN, Wiemann M. The Karnofsky performance status scale: an examination of its reliability and validity in a research setting. Cancer. 1984;53(9):2002–2007. [DOI] [PubMed] [Google Scholar]
- 41.Grimm JC, Valero V, Kilic A, et al. Preoperative performance status impacts perioperative morbidity and mortality after lung transplantation. The Annals of thoracic surgery. 2015;99(2):482–489. [DOI] [PubMed] [Google Scholar]
- 42.Kilic A, Beaty CA, Merlo CA, Conte JV, Shah AS. Functional status is highly predictive of outcomes after redo lung transplantation: an analysis of 390 cases in the modern era. The Annals of thoracic surgery. 2013;96(5):1804–1811. [DOI] [PubMed] [Google Scholar]
- 43.Hart A, Smith J, Skeans M, et al. OPTN/SRTR 2016 Annual Data Report: Kidney. American Journal of Transplantation. 2018;18(S1):18–113. [DOI] [PMC free article] [PubMed] [Google Scholar]
- 44.Gentry S, Chow E, Massie A, Segev D. Gerrymandering for justice: redistricting US liver allocation. Interfaces. 2015;45(5):462–480. [DOI] [PMC free article] [PubMed] [Google Scholar]
- 45.Gaston RS, Danovitch GM, Adams PL, et al. The report of a national conference on the wait list for kidney transplantation. American Journal of Transplantation. 2003;3(7):775–785. [DOI] [PubMed] [Google Scholar]
- 46.Hart A, Salkowski N, Snyder JJ, Israni AK, Kasiske BL. Beyond “median waiting time”: development and validation of a competing risk model to predict outcomes on the kidney transplant waiting list. Transplantation. 2016;100(7):1564. [DOI] [PMC free article] [PubMed] [Google Scholar]
- 47.Massie A, Luo X, Chow E, Alejo J, Desai N, Segev D. Survival Benefit of Primary Deceased Donor Transplantation With High‐KDPI Kidneys. American Journal of Transplantation. 2014;14(10):2310–2316. [DOI] [PubMed] [Google Scholar]
- 48.Solomon DA, Rabidou N, Kulkarni S, Formica R, Fraenkel L. Accepting a donor kidney: an evaluation of patients’ and transplant surgeons’ priorities. Clinical transplantation. 2011;25(5):786–793. [DOI] [PMC free article] [PubMed] [Google Scholar]
- 49.Gordon E, Butt Z, Jensen S, et al. Opportunities for shared decision making in kidney transplantation. American Journal of Transplantation. 2013;13(5):1149–1158. [DOI] [PubMed] [Google Scholar]
- 50.Bertsimas D, Kung J, Trichakis N, Wojciechowski D, Vagefi PA. Accept or decline? An analytics-based decision tool for kidney offer evaluation. Transplantation. 2017;101(12):2898–2904. [DOI] [PubMed] [Google Scholar]
- 51.Kilambi V, Bui K, Hazen GB, et al. Evaluation of Accepting Kidneys of Varying Quality for Transplantation or Expedited Placement with Decision Trees. Transplantation. 2019. [DOI] [PMC free article] [PubMed] [Google Scholar]
- 52.Bae S, Massie AB, Thomas AG, et al. Who can tolerate a marginal kidney? Predicting survival after deceased donor kidney transplant by donor–recipient combination. American Journal of Transplantation. 2019;19(2):425–433. [DOI] [PMC free article] [PubMed] [Google Scholar]
- 53.McAdams‐DeMarco M, Law A, King E, et al. Frailty and mortality in kidney transplant recipients. American Journal of Transplantation. 2015;15(1):149–154. [DOI] [PMC free article] [PubMed] [Google Scholar]
- 54.Hasse JM. Nutrition assessment and support of organ transplant recipients. Journal of Parenteral and Enteral Nutrition. 2001;25(3):120–131. [DOI] [PubMed] [Google Scholar]
- 55.Zhong Y, Schaubel DE, Kalbfleisch JD, Ashby VB, Rao PS, Sung RS. Reevaluation of the Kidney Donor Risk Index (KDRI). Transplantation. 2018;Online First. [DOI] [PMC free article] [PubMed] [Google Scholar]
- 56.Gupta A, Francos G, Adam F, Shah A. KDPI score is a strong predictor of future graft function: moderate KDPI (35–85) and high KDPI (> 85) grafts yield similar graft function and survival. Clinical nephrology. 2016;86(4):175. [DOI] [PubMed] [Google Scholar]
- 57.Pelletier RP, Pesavento TE, Rajab A, Henry ML. High mortality in diabetic recipients of high KDPI deceased donor kidneys. Clinical transplantation. 2016;30(8):940–945. [DOI] [PubMed] [Google Scholar]
- 58.Jay CL, Washburn K, Dean PG, Helmick RA, Pugh JA, Stegall MD. Survival benefit in older patients associated with earlier transplant with high KDPI kidneys. Transplantation. 2017;101(4):867. [DOI] [PMC free article] [PubMed] [Google Scholar]
- 59.Schaubel DE, Stewart DE, Morrison HI, et al. Sex inequality in kidney transplantation rates. Archives of internal medicine. 2000;160(15):2349–2354. [DOI] [PubMed] [Google Scholar]
- 60.Jindal RM, Ryan JJ, Sajjad I, Murthy MH, Baines LS. Kidney transplantation and gender disparity. American journal of nephrology. 2005;25(5):474–483. [DOI] [PubMed] [Google Scholar]
- 61.Patzer RE, Amaral S, Wasse H, Volkova N, Kleinbaum D, McClellan WM. Neighborhood poverty and racial disparities in kidney transplant waitlisting. Journal of the American Society of Nephrology. 2009;20(6):1333–1340. [DOI] [PMC free article] [PubMed] [Google Scholar]
- 62.Epstein AM, Ayanian JZ, Keogh JH, et al. Racial disparities in access to renal transplantation—clinically appropriate or due to underuse or overuse? New England Journal of Medicine. 2000;343(21):1537–1544. [DOI] [PMC free article] [PubMed] [Google Scholar]


