Abstract
Blood volume flow estimation is becoming an integral part of quantitative medical imaging. Three-dimensional color flow can be used to measure volumetric flow, but partial volume correction is essential due to finite beam widths and lumen diameters. Color flow power was previously assumed to be directly proportional to the perfused fractional color flow beam area (voxel). We investigate the relationship between color flow power and fractionally-perfused voxels. We simulate three-dimensional color flow imaging using Field II based on a 3.75-MHz mechanically-swept linear array. A 16-mm diameter tube with laminar flow was embedded into soft tissue. We investigated two study scenarios: (1) where soft tissue backscatter is 40 dB higher and (2) 40 dB lower relative to blood. Velocity and power were computed from color flow packets (n=16) using autocorrelation. Study 1 employed a convolution-based wall filter. Study 2 did not employ a wall filter. Volume flow was computed from the resulting color flow data as published previously. Partial volume voxels in Study 1 show less power than those in Study 2, likely due to wall filter effects. An ‘S’-shaped relationship was found between color flow power and fractionally-perfused voxel area in Study 2, which could be due to an asymmetric lateral-elevational point spread function. Flow computation is biased low by 7.3% and 7.9% in Study 1 and Study 2, respectively. Uncorrected simulation estimates are biased high by 41.5% and 12.5% in Study 1 and Study 2, respectively. Our findings show that partial volume correction improves three-dimensional volume flow estimation and that wall filter processing alters the proportionality between color flow power and fractionally-perfused voxel area.
Index Terms: Biomarker, Quantification, 3D Imaging, Wall filter
I. Introduction
BLOOD flow is essential for life, carrying nutrients and oxygen to the sites of consumption for oxidative cell metabolism. Cardiac output averages about 5.0 L/min and the major recipients are brain (13%), kidneys (20%), and liver/gut (25%) [1]. Undiagnosed changes in blood flow can lead to disease or death. Health care providers qualitatively assess blood flow using a range of surrogate measures, the simplest being pulse measurement by palpation [2] and mean arterial blood pressure assessment. Sophisticated methods include catheterization for thermodilution flow estimation [2, 3] and Fick’s gas exchange [2]. Noninvasive medical imaging techniques for blood volume flow assessment include radioisotope imaging, computed tomography (CT) with contrast injection, and phase contrast magnetic resonance imaging (MRI), all of which have limitations that need to be understood to allow for meaningful use.
In ultrasound, volume flow is typically calculated using mean blood flow velocity (from spectral Doppler) multiplied by an estimate of the vessel cross-sectional area. The method relies on multiple assumptions that have limited its usefulness and reliability [4]. These assumptions include a cylindrically symmetric flow profile depending on beam dimensions, circular vessel cross-section that is time invariant, and a Doppler angle correction requirement. Variations in each of these assumptions contribute to an overall error that can be large depending on vessel size and location in the ultrasound beam [5].
Still, given these difficulties, there continue to be persistent attempts to employ volume flow in clinical applications such as: OB [6], portal venous flow [7], and cardiac output [8]. Alternatively, a plethora of flow-related indices have evolved over time to try to estimate flow changes in lieu of true volume flow [9]. Some of these include resistive index, pulsatility index, systolic diastolic ratio, and volume flow index [10] (newer editions of [10] do not list volume flow index). Other hemodynamic markers include velocity estimates such as peak systolic (PS), end diastolic (ED), and minimum diastolic (MD) velocities. Such velocity measurements are often the clinical standard due to the lack of adequate alternatives. Hence, color flow and pulsed-wave Doppler are used to quantify and qualify flow for diagnostic purposes.
Assessment of blood flow is of interest after surgical procedures that change the vascular system. An example is cardiac surgery, where a study by Theodoraki et al. (2015) [11] assessed blood flow in abdominal organs. Specifically measured were Doppler velocities in peak systole (PS), end diastole (ED), and minimum diastole (MD), along with the pulsatility index (PI), resistive index (RI), and volume flow (VF), in both the liver and the kidney. Portal vein velocity, for example, was 18.7±3.72, 26.6±4.11, and 18.5±2.42 cm/s, pre-operative, day 1 post-op, and day 7, respectively. The average coefficient of variance for these values was 16.1% and somewhat smaller than the average pairwise percent differences between the three time points of 25.2%. Portal venous volume flow was 602±229, 709±181, and 616±207 mL/min, pre-operative, day 1 post-op, and day 7, respectively. Here, the average coefficient of variance was 32.4% and the average pairwise percent differences between the three time points was 11.0%. Large variations could be due to subject specific flow or unavoidable measurement inaccuracy.
For pulsed-wave Doppler ultrasound, a modest error in velocity, angle, and lumen diameter can result in a large volumetric flow error. In fact, Gill [12] has observed 14% standard deviation in pulsed-wave measurements of umbilical flow – these resulted from uncertainties of diameter and beam-to-flow orientation of 0.4 mm and 3°, respectively. Holland et al. [13] concluded that in vivo volume flow estimation using pulsed-wave ultrasound can lead to errors of up to 50% in small vessels (3.2-mm diameter) and were reduced to 17% in a 12.7-mm diameter pulsatile flow model. Similarly, the 2D spectral Doppler volume flow (2D SDVF) method has an interobserver variability of up to 40% with an average of 27% for slower flows (100 mL/min) [5].
In order to overcome traditional limitations, a variety of ultrasonic flowmeters have been created. Lynnworth and Liu [14] reported 50 years of ultrasonic flowmeters, mostly for industrial use where mass flow rate is well established, including under harsh environmental conditions. Medical implementations also date back 50+ years. Franklin et al. [15] introduced a clamp-on pulsed flowmeter with separate transmit and receive apertures that assessed the differential upstream/downstream time-of-flight to determine the average flow rate. Fox introduced a cross-beam imaging approach to determine 3D flow vectors transcutaneously, which was, over a 6 dB range, in good agreement with theoretical predictions [16]. Picot and Embree implemented a one-dimensional volume flow estimation technique on a Philips CVI system where the flow velocity profile is integrated across the lumen and angle corrected by the user. Vessel diameter changes through the cardiac cycle are autocorrected due to the integration, which automatically ends at the actual vessel boundary. User-determined beam-to-flow angle inputs were found to be the largest sources of uncertainty. Ricci et al. demonstrated a multigate Doppler method [17] by which real-time vector velocities [18] are acquired. The latter does not rely on user selected Doppler angle correction and was implemented on an advanced open platform for ultrasound research (ULA-OP) [19]. Simulations showed a 0.75° error over a range of 90° and a 0.6 cm/s bias for a 50 cm/s peak parabolic flow.
Hottinger and Meindl [20] introduced volume flow acquisition in terms of a flux measurement. Analytically, volume flow is the amount of volume that is displaced per unit time. A mathematical description of flux and its assessment is given by Gauß’ theorem:
| (1) |
where is the measured mean velocity vector for each integration surface element vector , and Q is the resulting flow rate computed by summing the total flux across surface S. While Hottinger and Meindl do not mention Gauß, they derive the same equation. In their two-beam approach, one beam completely encompasses the lumen of interest and the second beam completely resides within the lumen and serves as a reference. This approach is geometry and angle independent as long as there is a Doppler shift and would work especially well with annular arrays. Moser et al. [21] continued with the concept of Gauß’ theorem and conducted initial benchtop measurements using a 2D ultrasound array with 6 by 6 elements. Sun et al. [22] furthered the implementation by using a cardiac ultrasound scanner (Vingmed CFM750, 3.5-MHz phased array) and integrated color flow velocity along two arcs to form a first order bowl-shape surface. They termed this process surface integration of velocity vectors (SIVV) and in benchtop experiments estimated stroke volume rates to within ±10%. Poulsen and Kim [23] improved the scanning by producing 6 elevational scan angles using a similar cardiac scanner (Vingmed CFM-800A, 6-MHz annular phased array) and included B-mode based segmentation since they saw flow 2–3 mm outside the lumen due to “finite sample volume effects”. In vivo validations have shown mean flow estimation bias of −3.9% [24] and 10–15% error [25] in porcine arterial studies using thermodilution, and 4.7% bias with 10% error [26] when using MRI human in mitral valve flow as reference standards. Kim et al.[24] stated a principal limitation was the low lateral resolution of their imaging system when defining the flow area.
Color flow power mode imaging was introduced by Rubin et al. [27] as an alternative to color flow. Power is related to the number of moving red blood cells in a sample volume, and the acquisition is less angle dependent than color flow. Fractional moving blood volume has been defined as an estimate of vascularity based on color flow power [28].
Liu and Burns [29] implemented a direct proportionality factor, the Doppler spectrum, in their attenuation compensated C-mode flowmeter. Our group has implemented a 3D volume flow estimation method based on Gauß’ theorem that corrects for partial-volume effects based on histogram analysis of color flow power image data, which yields weighting factors for the integration area elements. Clinical ultrasound scanners provide velocity information for finite-sized ultrasound beams, i.e., color flow beams. This requires integration over finite area elements. For such, (1) can be rewritten in a finite sum, (2), over all beams and extended to include a weighting factor for each beam, which compensates for beams that are partially outside the blood vessel:
| (2) |
Equation 2 is our extension to 3D volumetric blood flow measurement by means of surface integration of velocity vectors. In (2), is the color flow velocity in pixel i as obtained from the ultrasound scanner or the color flow simulation, is the associated cross-sectional area element in the c-plane (lateral-elevational plane) of pixel i, and wi is a weighting coefficient for that accounts for area elements which span across the lumen circumference and partially reside outside blood flow. A pixel that is 20% within the blood vessel and 80% outside the vessel would have a weight wi of 0.2, i.e., 20%. Weights are obtained from color flow power [27] and used to correct for partial volume [30]. Surface integration is an angle-independent technique that can be understood by observing a cross-sectional perfused area (Figure 1). Here, the measured blood flow velocity () is multiplied by to yield volumetric flow, Qi. The elegance about this formalism is that and , where αi is the angle between the lumen direction and ultrasound beam. While and have an angle dependence, does not since cos(αi) terms cancel. When choosing the areas to be parallel to, i.e., , only and need to be known. Areas do not need to be circular. Practical implementations will still have an angle dependence due to velocities falling into the wall filter when αn approaches 90°.
Fig. 1.
Illustration for surface integration. In this Gedanken experiment, the flow Q is obtained by multiplying the cross-sectional (lumen) area A and flow velocity magnitude v as seen by color flow imaging. Since Ai = A0/cos(αi) and vi = v0 × cos(αi), this technique results in an angle independent volume flow estimate. Since the velocity vectors are parallel to the area vectors, only scalar velocities vi need to be acquired. Areas A0 to A2 are c-planes of the depicted probe P.
Experimental verification of 3D volume flow using a GE/Kretz Voluson 730 clinical scanner and a RAB2–5 probe showed a mean error of less than 15% [30]. Higher frequency vascular probes (mechanically swept linear arrays, 4D10L and 4D16L, on a GE LOGIQ 9 scanner) were used to assess femoral and carotid flow pre-clinically in vivo (−7.04% bias and 9.52% standard deviation) [31]. Initial clinical studies were performed on umbilical cords [32] and transjugular intrahepatic portosystemic shunts [33]. Most recently, 3D volume flow measurements were shown to be helpful in diagnosing preeclampsia (p=0.035) [34]. In this work, we show the effects of color flow power based partial volume correction on volume flow acquired by 3D color flow. The work is mainly of simulation in nature; however, it is motivated by experimental observations.
II. Materials and Methods
A. Experiments
Experimental data has been acquired to motivate the simulation work of this investigation, not for a one-to-one comparison between experimental and simulation results.
Flow phantom experiments were performed using a modified EPIQ 7G (Philips Ultrasound, Bothell, WA, USA) equipped with an X6–1 probe to acquire 3D color flow data. Color flow image acquisition settings were selected as follows: flow opt = med, freq opt = adapt, sweep angle = 50°, PRF = 1872 Hz, wall filter = low (56 Hz), line density = med, and number of volumes = 6. The vessel was positioned at the color flow focus depth, 4 cm. A flow phantom with an 8-mm diameter wall-less channel (ATS Laboratories, Bridgeport, CT, USA) was connected within a closed-loop tubing circuit that included a pulse dampener. A peristaltic pump was used to circulate blood mimicking fluid (Model 046: CIRS, Norfolk, VA, USA) at a constant volume flow rate of 600 mL/min. DICOM export contained color flow velocity and color flow power data for acquired 3D volumes. The blood mimicking fluid has the following properties: speed of sound 1550 m/s, particle concentration 18±1 mg/mL, particle diameter 4.7 μm, and particle density 1.03±0.015 g/mL.
B. Simulations
Color flow was simulated using Jørgen Jensen’s public domain ultrasound simulation software Field II [35]. Surface integration as described above and illustrated in Figure 1 requires 3D ultrasound data. Therefore, a 3D ultrasound probe was simulated by creating a 1D imaging array that is mechanically linearly translated in the elevational direction. Details of the simulated imaging probe are given in Table I and correspond to a common abdominal imaging probe design, without reference to any particular manufacturer or system. Lateral and elevational beams were spaced at −6 dB (round-trip) relative to their respective beam width. The field of view was chosen to be 3 by 4 cm (lateral by elevational) with a 16-mm diameter lumen at its center and with the flow directed towards the imaging probe. Blood and tissue were simulated as randomly placed scatterers with 15 per resolution cell of the achieved point-spread-function (PSF) as defined by −6 dB in axial, lateral, and elevational directions. Two studies were performed. In Study 1, tissue was set to a scatterer strength of unity (1) and blood −40 dB relative to tissue (i.e., 0.01). In Study 2, tissue scattering was set to −40 dB relative to blood, i.e., 0.0001. Study 2 mimicked the case of no dominant static (tissue) signal interfering with the dynamic (blood flow) signal and thus no need for a wall filter to eliminate such effects. For both studies tissue attenuation was set to 0 dB. A parabolic flow profile was simulated with a maximum velocity of 6.35 cm/s, which corresponds to 6.38 mL/s volumetric flow (Table II). In total, 100 volumes were simulated with 16 non-interleaved Doppler firings each to track flow, along with 104 lateral beams (0.288-mm lateral width) and 21 elevational beams (1.87-mm elevational width). Simulated scanlines were tested for fully developed speckle as an indication for the proper number of scatterers per resolution cell (Figure 2). Fully developed ultrasonic speckle follows the Rayleigh distribution [36]. Color flow processing followed the method described by Namekawa and Kasai [19, 37]. A convolution wall filter was employed with a kernel length of 4 (k=[0.16 0.53 −0.53 −0.16]).
TABLE I.
Parameters of Simulated Array
| Center frequency | 3.75 MHz | ||
| Elements No., spacing, kerf | 128, λ, 10% | ||
| f-number | 3 | ||
| Elevational lens | 30 mm | ||
| Burst length | 4 cycles | ||
| PRF, Packet size | 800 Hz, 16 | ||
| Wall filter | Convolution filter | ||
| Point-Spread-Function sensitivity level | −30 dB (Tx) | ||
| for inclusion of scatterers | −60 dB (Tx-Rx) | ||
| Lateral/elevational beam spacing | −6 dB (Tx-Rx) | ||
| Field of view: | axial | 2.65 to 3.52 cm | (632 samples) |
| lateral | 3 cm | (104 beams) | |
| elevational | 4 cm | (21 beams) |
TABLE II.
Parameters of Simulated Phantom
| Vessel diameter | 16 mm |
| Max. flow velocity | 6.35 cm/s |
| Volume flow | 6.38 mL/s |
| Scatterer density | 15 per resolution cell |
| Number of scatterers in volume | 4.29×10⁶ |
Fig. 2.
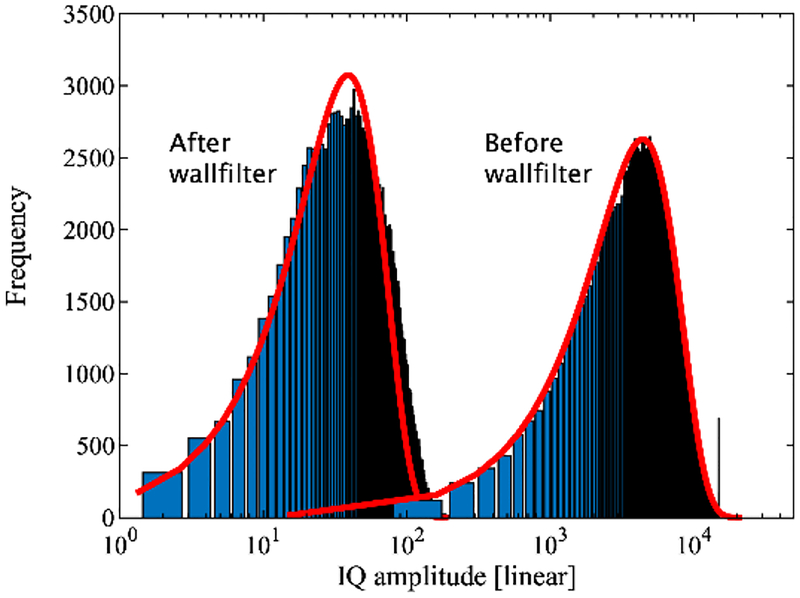
Histogram of IQ speckle amplitude distribution for a single volume. Before wall filter (right distribution) the signal is dominated by tissue, after wall filter it is dominated by the lower amplitude blood signal (left). The curve fits (red lines) reflect a Rayleigh distribution with two independent variables, mean and amplitude. [36]
III. Results and Discussion
A. Experiments
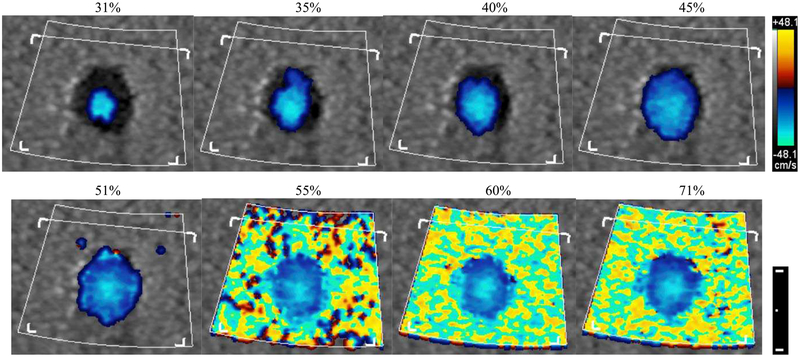
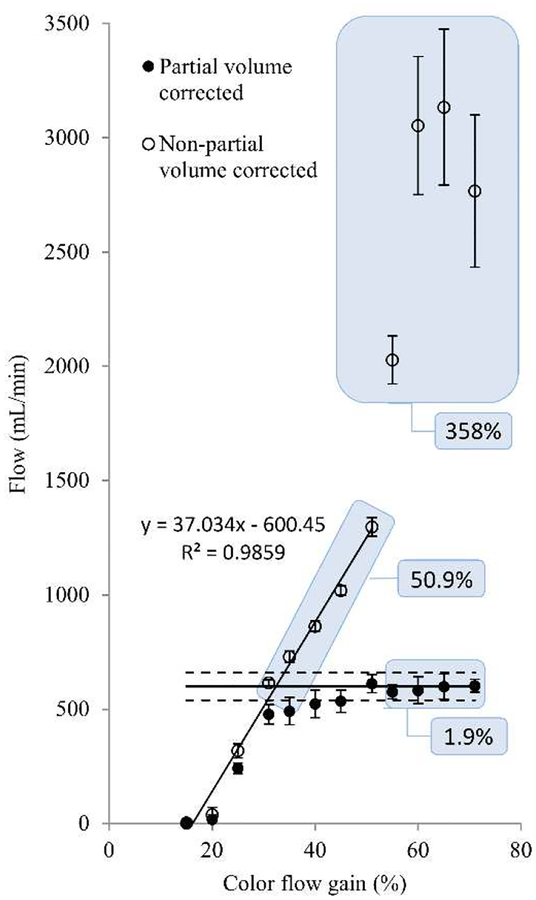
Clinical ultrasound scanners commonly provide the user with the ability to adjust the color flow signal receive gain. By doing so, the number of color flow velocity pixels shown on the screen will directly vary with gain. Figure 3 shows the change in color pixels for color gain ranging from 31% to 71% of maximum gain. Adequate gain selection depends on the intentions of the scan and clinical strategies may target filling the lumen with color for good signal to noise. Results for computing volume flow by surface integration with and without partial volume correction are shown in Figure 4. All data points represent mean and standard deviation over 20 volumes. Open circles show volumetric flow as computed solely by color pixel integration (non-partial volume corrected) and demonstrate a direct dependence with color gain. The last three settings (55% to 71%) are near or at full color saturation. Correct volumetric flow measured by this method is subject to variability due to manually set color gain. As seen from a curve fit of the first 8 settings (15% to 51%), volume flow increases at a rate of 37 mL/min per 1%-point change in receive gain. That is a 6% change in measured flow for 1% change in receive color gain (in the range of 15% to 51%), which is a potentially strong source of user-induced error. Solid circles show volume flow computed by the method shown in (2). Weighting coefficients were obtained from color flow power [30]. Using this method, the resulting volumetric flow rises for increasing receive gain and converges to ±11% of actual flow (600 mL/min, solid line) after reaching 45% receive gain. In this range the average error is 3.4%. Even for fully bloomed receive gain settings, i.e., 55% to 71% as seen in Fig. 3, partial volume corrected flow accurately depicts flow with a mean error of 1.9%, whereas velocity × area, i.e., non-partial volume corrected flow, yields flow with a mean error of 358%. Even non-saturated cases, i.e., 31% to 51%, yield an average error of 50.9%. Actual pump flow is shown as the horizontal solid line and ±10% as horizontal dashed lines. Onscreen color flow pixels may deviate from the raw DICOM data that we use to compute volume flow since (1) we use the original Doppler firing vectors, i.e., before scan conversion and (2) onscreen data may be processed for color-write priority, i.e., the threshold for when to write color pixels over bright B-mode pixels. Figure 3 illustrates what the user experiences when setting color flow gain. Even for a fully saturated color flow image, partial volume correction yields volume flow with only 1.9% error. By this method, the user selected color flow gain has little influence on the resulting quantitative volume flow measurement as long as the user fills the lumen, here, 45% or more gain. Not filling the lumen with color would underestimate flow. However, this would be counterintuitive in a clinical setting where the user specifically uses the gain knob to fill the lumen with color pixels.
Fig. 3.
Color mode 2D (axial-lateral, centered at 4 cm depth) screen displays as a function of onscreen displayed color flow receive gain setting (noted above each image). Color and dimensional scale bar are shown on the right. The dimensional scale bar shows a 1 cm distance with a 5 mm subdivision.
Fig. 4.
Volume flow as a function of color flow receive gain. Solid circles are computed based on (2), where partial volume effects are compensated by color flow power. Open circles are computed solely on the basis of color flow velocity and area (non-partial volume method). A line fit of the first 8 data points (sloped solid line) shows the strong gain dependence of the non-partial volume method where the user-set gain determines the measured volumetric flow. Partial volume corrected flow (solid circles) remains within ±11% error for the gain range from 45% to 71%. Note that even for fully bloomed receive gain settings, i.e., 55% to 71% as seen in Fig. 3, partial volume corrected flow accurately depicts flow with a mean error of 1.9%, whereas the non-partial volume method yields flow with a mean error of 358%. Even the non-saturated cases, i.e., 31% to 51%, yield an average error of 50.9%. Actual flow is shown as the horizontal solid line and ±10% as horizontal dashed lines. Error bars show the variation of 20 repeated acquisitions.
B. Simulations
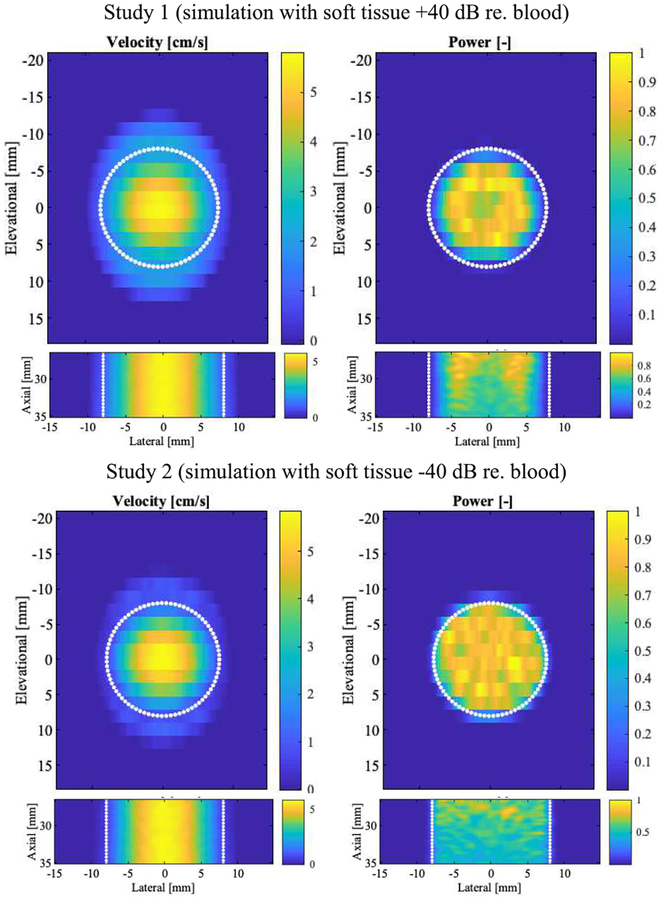
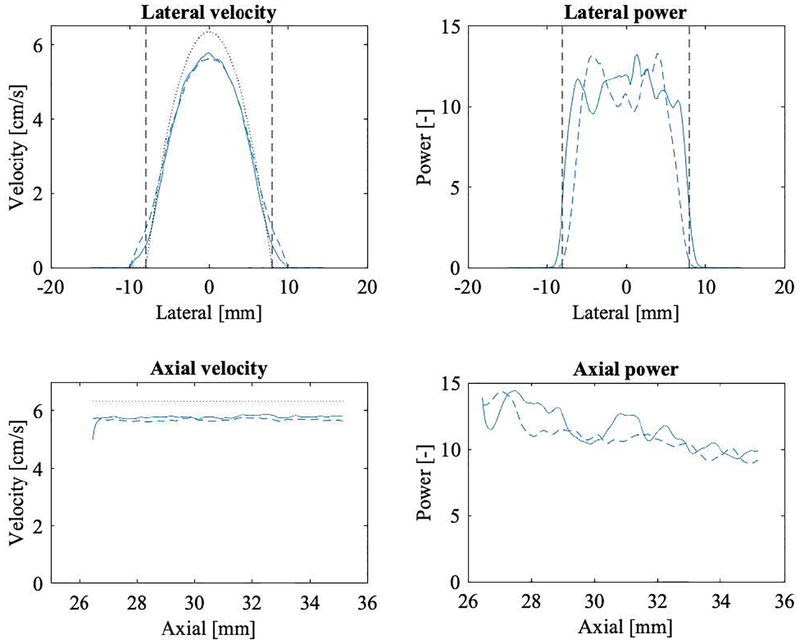
Simulations were performed to determine the effect of partial volume on the resulting color flow power. Figure 5 shows the color velocity and power for the elevational-lateral (c-plane) and axial-lateral planes of simulated flow. A total of 100 volumes were computed and averaged. Flow velocity ranges from 0 to 6.35 mL/s. Color flow power has been normalized to a scale from 0 to 1. Profile plots of velocity and power are shown in Figure 6. The simulated parabolic flow can be seen in the left column, however the theoretical maximum flow speed of 6.35 cm/s is underestimated, as one might expect from the elevational beam spacing of −6 dB, i.e., 1.87 mm. Axial dependence is flat with vaxial =5.68±0.03 cm/s (0.5% relative standard deviation). Color flow power (in the right column) diminishes around the lumen edge due to the wall filter and axially declines at a rate of 3% per millimeter. The latter is assumed to be due to the elevational lens of the array.
Fig. 5.
Simulation derived color flow velocity and power images. Columns show alternating velocity (cm/s) and normalized power on a linear scale. The top row presents c-plane cross-sections in the axial center of the simulated volume (27 to 35 mm axially, wall filter). The bottom row presents axial-lateral sections in the elevational center (no wall filter). The simulated lumen (16-mm diameter) is indicated by white dotted lines. Data is averaged (N=100).
Fig. 6.
Simulation derived color flow velocity and power profiles across a 16-mm diameter lumen. The left two panels show velocity (cm/s) and the right two panels power (arbitrary units) on a linear scale. The top row presents lateral profiles in the axial center of the simulated volume (31 mm axially, elevational center). The bottom row presents axial profiles at the lateral and elevational center. All simulated volumes have been averaged for this display (N=100). Dashed lines refer to the Study 1 simulation and solid lines refer to Study 2. Dashed vertical lines show the lumen boundaries. Dotted lines show the true velocity profile. The maximum velocity is underestimated by 11% and 9% in Study 1 and Study 2, respectively.
C. Geometric segmentation
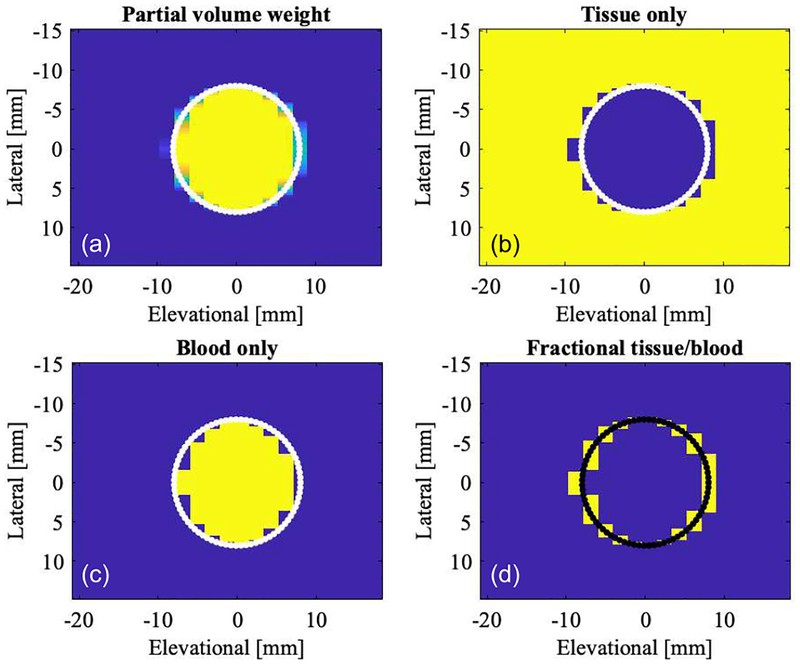
Partial volume color flow beams can be defined by the geometric relationship between color beams in the lateral-elevational direction and the definition of the simulated lumen. Figure 7 shows a segmentation based on this classification. Geometric partial volume, i.e., the fractional amount of the pixel that resides inside the lumen, is shown in panel (a). Each pixel corresponds to one color flow beam. Yellow corresponds to fully contained in the lumen (f=1) and blue not contained in the lumen at all (f=0). The lumen boundary is shown as white/black dots. Voxels close to this boundary are partial and therefore shaded between yellow and blue (0<f<1). Panels (b), (c), and (d) segment area into tissue (f=0), blood (f=1), and partial pixel (0<f<1).
Fig. 7.
Lateral-elevational cross-section showing color flow beam voxels in the c-plane. Assuming a geometric beam shape, i.e., each beam/voxel is evaluated for its geometric partial area residing inside the simulated lumen as computed from the beam spacing and lumen definition. (a) Color coded partial volume voxels, blue representing background tissue, i.e., 0% blood background, and 100% blood (yellow) in the lumen. Partial voxels are shaded from blue to yellow. (b) Image showing 100% tissue (yellow). (c) Image showing 100% blood (yellow). (d) Image showing only partial volume voxels (yellow). The simulated lumen of 16-mm diameter is indicated in each image as a solid line.
D. Finite-beam segmentation
Actual acoustic beams are not limited by their spacing and extend in a decaying fashion based on the point-spread-function (PSF). The PSF of the color flow beam was obtained by simulated calibration (calc_hhp function of Field II used to calculate pulse echo field) and then used to determine the amount of lumen imaged by the beam in each position. A 2D convolution of the PSF with a lumen function (l) yields the weighing factor needed for partial volume correction:
| (3) |
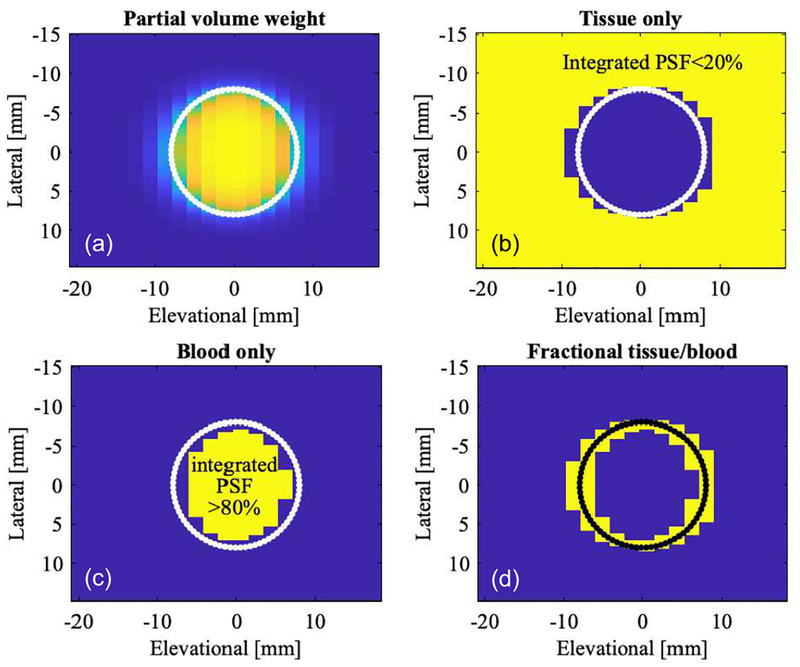
where the partial volume weight w is computed for every c-plane beam position x (lateral direction) and y (elevational direction). Using this quantity, one can redefine the segmentation from Figure 7. The partial volume weight w is shown in panel (a) of Figure 8. Panel (b) segments tissue (yellow) for an integrated PSF, i.e., weight w less than 20%. Analogously, blood (panel (c)) is defined as w more than 80% and partial voxels are defined as 20%≤ w ≤80%. This segmentation compares favorably with the solely geometrically based one in Figure 7, yet takes into account actual beam characteristics. Both tissue and 100%-blood cut-off thresholds need to be >0 and <1, respectively, due to the infinite beam extent. A tissue threshold of 0 would eliminate all tissue since the beam always sees some blood flow. A more realistic simulation could introduce a total dynamic range for the imaging system plus a noise floor. In such a case one could possibly set the tissue threshold to zero. Given this segmentation information (Figure 8), we can associate partial volume voxel information with color flow power.
Fig. 8.
Lateral-elevational cross-section showing color flow beam voxels in the c-plane. Assuming a finite beam shape, i.e., each voxel is evaluated based on its integrated color beam point-spread-function cropped by the geometry of the lumen (4). (a) Color coded partial volume voxels, 0% blood (blue) in tissue background and 100% blood (yellow) in the lumen. Partial voxels are shaded from blue to yellow. (b) Image showing 100% tissue (yellow). (c) Image showing 100% blood (yellow). (d) Image showing only partial volume voxels (yellow). The simulated lumen of 16-mm diameter is indicated in each image as a solid line.
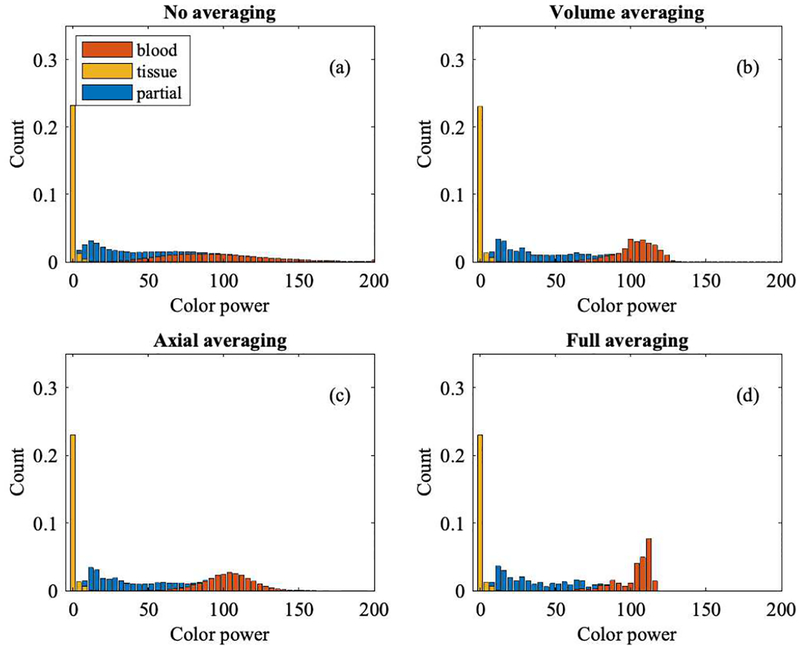
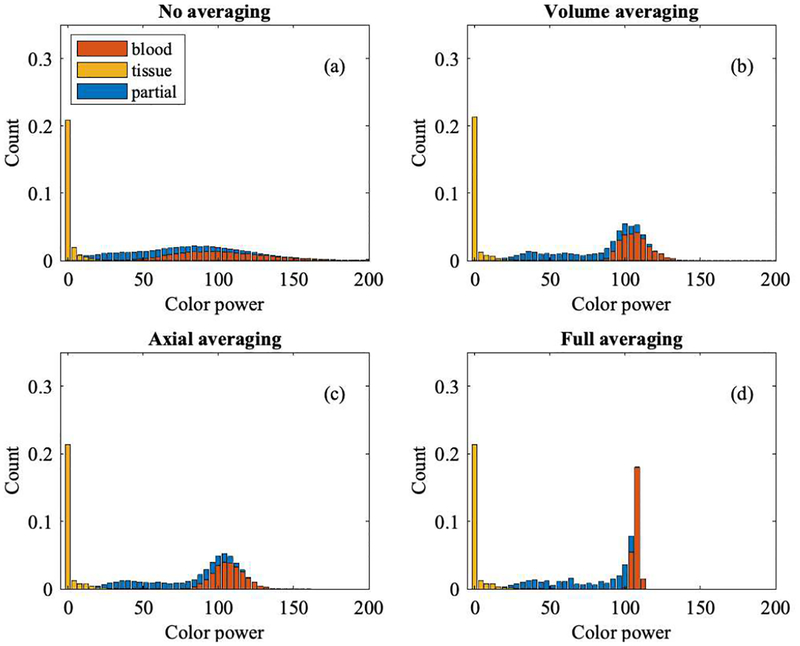
Figures 9 and 10 show histograms of color flow power from Study 1 and Study 2, respectively, segmented into background tissue (yellow), partial volume voxels (blue), and blood (red). For Study 1, tissue power is low compared to the blood signal due to wall filtering. Partial volume voxels reside between background tissue and blood since they carry less power than blood and more than background. However, this only holds for the (Rayleigh) population average, not for individual voxels. Simulation data originate from 100 volumes, with 11 axial, 104 lateral, and 21 elevational voxels, i.e., a total of 2.4 million voxels.
Fig. 9.
Histogram of color flow power (Study 1) coded by bar color as blood (red), tissue (yellow), and partial blood and tissue (blue). Non-averaged data are shown in panel (a). Averaging either by volume or axially yields the data shown in panels (b) and (c), respectively. Averaging both, by volume and axially, yields the histogram shown in panel (d). A higher level of averaging reduces speckle variation and therefore reduces the overlap of partial volume voxels with background tissue and with lumen/blood voxels.
Fig. 10.
Histogram of color flow power (Study 2) coded by bar color as blood (red), tissue (yellow), and partial blood and tissue (blue). Non-averaged data are shown in panel (a). Averaging either by volume or axially yields the data shown in panels (b) and (c), respectively. Averaging both, by volume and axially, yields the histogram shown in panel (d). A higher level of averaging reduces speckle variation and therefore reduces the overlap of partial volume voxels with background tissue and with lumen/blood voxels.
It may be helpful to understand the effect of averaging on the power distribution since averaging reduces speckle. One can assume that the segmented regions, i.e., background, partial volume, and blood, will show less overlap in the histogram when averaged. We start with Nn color flow power volumes V with axial (x), lateral (y), and elevational (z) dimensions, i.e., a 4-dimensional variable. The effects of averaging across volumes (Hvolume avg), across c-planes (i.e., in the axial direction with Nx samples, Haxial avg), and across volumes and axially (Hfull avg) are shown in panels (b), (c), and (d), respectively, in Figures 9 and 10, in addition to no averaging at all (Hno avg) in panel (a). Equation (4) defines the four histogram sets H as:
| (4) |
Volume and axial averaging show a similar change in power overlap, even though the former leads to 100 averages and the latter to 11 averages. Averaging across volumes and axially provides the greatest separation, as shown in panel (d). The ultimate goal is to obtain partial volume weights based on color flow power.
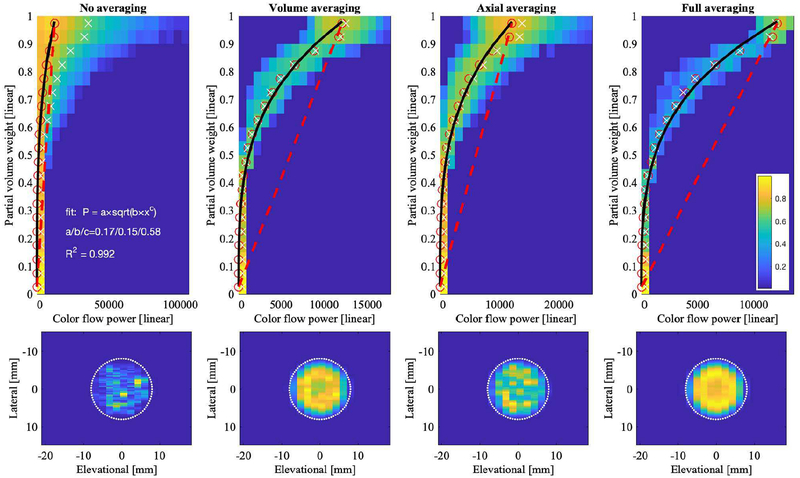
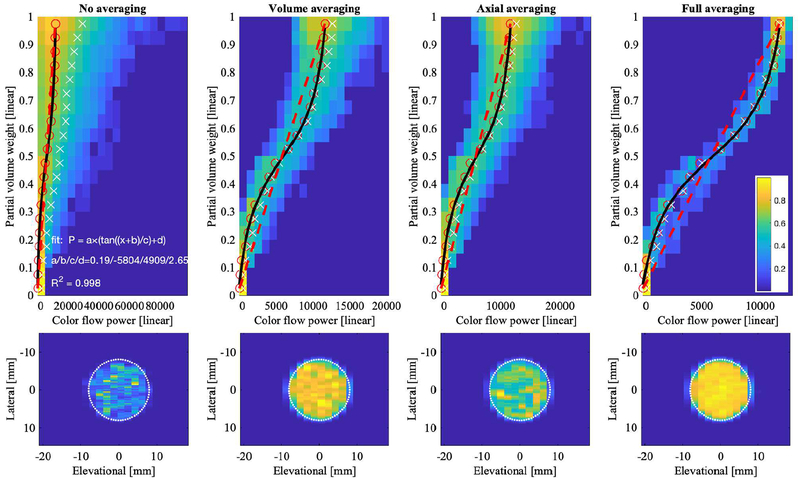
Figures 11 and 12 (top row) show the relationship between color flow power and fractional area for the same four levels of averaging as the histograms in Figures 9 and 10, respectively. While no averaging allows for a full range of speckle in the color flow power, i.e., from 0 to over 100,000 [arbitrary units], panel (a), increasing averaging causes speckle reduction and thus leads to the statistical mean of the distribution, i.e., ~12,000, panel (d). The relationship between color flow power and fractional area was assumed to be linear (red dashed line); however, simulation results deviate from this straight-line relationship. Fifty percent partial volume does not correspond to 50% color flow power. For Study 1, i.e., Figure 11, this could be due in part to the wall filter, which tapers the power as it approaches the lumen boundary. For comparison, Figures 11 and 12 also show the c-plane color flow power cross-sections (bottom row). The power of Study 2 fills the lumen more than that of Study 1. In Study 2, all processing was the same, except that no wall filter was used. Fitting partial volume weights with respect to color flow power yields an exponential and ‘S’-curve shape for Study 1 (Figure 11) and Study 2 (Figure 12), respectively. The S-curve crosses the straight-line at approximately 50% fractional area, which also equals 50% color flow power, due to the definition of the straight-line. Lower powers (<50%) are associated with higher than expected fractional area and higher powers (>50%) are associated with lower than expected fractional area. The wording expected is taken relative to the straight-line relationship.
Fig. 11.
Relationship between partial voxel area and color flow power (Study 1) for raw and averaged data shown as 2D histograms. Color bar indicates normalized histogram count. Each column shows one type of averaging. Top row shows color flow power (abscissa) versus partial volume weight w from (2) (ordinate). Dashed red line indicates where power and partial voxel area are directly proportional. A fractional area of 0 and 1 correspond to background tissue and blood, respectively. Red open circles are computed as mean power in each fractional area bin. White ‘×’ are computed as the weighted mean, i.e., for each fractional area bin, the sum over all power values times their histogram count, normalized by the total histogram count in each fractional area bin. Black line histogram fit P is defined in the top left panel. Bottom row shows lateral-elevational lumen cross-section for each type of averaging. The simulated lumen (16-mm diameter) is indicated by the white dotted line.
Fig. 12.
Relationship between partial voxel area and color flow power (Study 2) for raw and averaged data shown as 2D histograms. Color bar indicates normalized histogram count. Each column shows one type of averaging. Top row shows color flow power (abscissa) versus partial volume weight w from (2) (ordinate). Dashed red line indicates where power and partial voxel area are directly proportional. A fractional area of 0 and 1 correspond to background tissue and blood, respectively. Red open circles are computed as mean power in each fractional area bin. White ‘×’ are computed as the weighted mean, i.e., for each fractional area bin, the sum over all power values times their histogram count, normalized by the total histogram count in each fractional area bin. Black line histogram fit P is defined in the top left panel. Bottom row shows lateral-elevational lumen cross-section for each type of averaging. The simulated lumen (16-mm diameter) is indicated by the white dotted line.
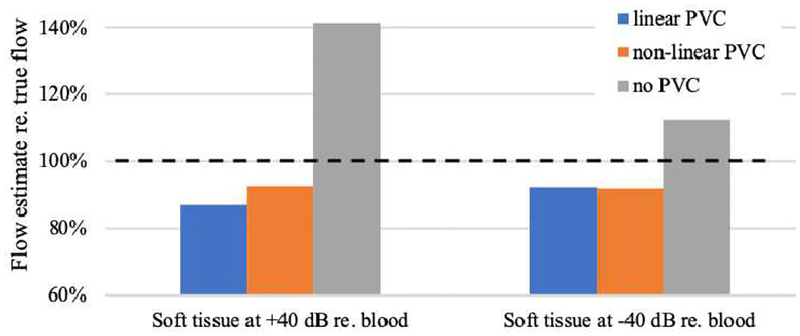
Volume flow was computed for the above discussed simulation data. Our previously published algorithm [34] uses a histogram analysis to determine the color flow power that represents 100% blood (blood only power). Subsequently that power was used to perform partial volume correction in a linear manner. Here we report volume flow estimation using: (a) linear partial volume correction, (b) non-linear partial volume correction, and (c) non-partial volume correction (only integration of color flow velocities and voxel areas). Figure 13 shows these results for Study 1 and Study 2.
Fig. 13.
Volume flow estimation using simulated color flow data. Left three bars represent results for the simulation of blood flow in Study 1, whereas the right three bars represent those from Study 2. Each group shows estimated volume flow (Q) relative to true flow. Linear partial volume correction (PVC), as in [34], is shown in blue. Non-linear PVC, as resulting from this work, is shown in orange and uses the fit functions P(Figures 11 and 12) for Study 1 and Study 2, respectively. The third bar in each group represents the flow result for no PVC. Dashed horizontal line marks true volume flow at 100%. In Study 1, non-linear PVC estimates Q by 5.8% better than linear PVC. In Study 2, linear and non-linear PVC differ by 0.2%.
For non-partial volume correction and full averaging (Hfull avg), flows for Study 1 and Study 2 are overestimated by 41.5% and 12.5%, respectively. Linear partial-volume corrected data, as used in our experimental work [30–34], yields −13.2% and −7.8% bias, for Study 1 and Study 2, respectively. Non-linear partial-volume corrected data yields −7.3% and −7.9% bias, for Study 1 and Study 2, respectively. As can be seen from Figure 10, panel (d), even full averaging still shows a finite amount of speckle, i.e., overlap of partial volume voxel power with 100% blood voxel power. This is our justification for lowering the 100%-power threshold for partial volume.
correction to 90%, which is, in practice, an empirical number. In addition, for both studies the recovered flow velocity profile underestimates the true maximum velocity, which also lowers the resulting volume flow.
IV. Conclusions
Partial volume correction allows for improved mapping of color flow power and the fractional pixel area between a blood lumen and its surrounding background tissue. The functional relationship between power and fractional area was previously assumed to be linear [30], but has now been shown, for the simulated imaging system, to be non-linear, i.e., increasing at a rate faster than linear (exponential or polynomial, n>1). Beam shape and spacing, as well as wall filter, may contribute to this modified functional relationship.
Clinical ultrasound scanners commonly change these parameters (i.e., beam shape and wall filter) depending on imaging depth, application, and scanhead. The ideal relationship between partial volume and color flow power was assumed to be a straight line. However, even for the case of stationary tissue 40 dB below blood scattering, the relationship was ‘S’-shaped. This may have to do with the asymmetric point-spread-function of the simulated color flow beam. Tissue power 40 dB below blood is unrealistic but exemplifies the need for adequate wall filters that facilitate the use of color flow power for partial volume correction. The relatively good performance of non-partial volume corrected data may be due to the lack of noise and effects of user gain as seen in Figure 4. Further investigation is required to understand the effects of these scanning parameters and noise on partial volume correction. However, the technique of partial volume correction based on color flow power is an effective approach for finite color flow beam widths – it reduces or potentially eliminates operator dependence when assessing volumetric blood flow non-invasively using 3D ultrasound.
Further investigation is necessary to obtain a deeper understanding of partial volume effects and their mediation in volume flow assessment. Possible improvements include a study of low velocity effects and their treatment by a range of wall filters. It would also be helpful to improve the underlying MATLAB (Release 2018a, The MathWorks, Inc., Natick, MA) simulation script from generic to state-of-the-art industry beamforming and subsequent color flow processing. Such a simulation script would be a beneficial tool for commercial entities to predict volume flow performance over a wide range of clinical applications, including in situ point spread function to vessel ratios. Similar to Tang et al. [38] we have observed that reliable histogram performance requires at least 4 voxels across the lumen that are 100% blood. This requirement might present a challenge for small vessels at depth, where high frequency beams are challenged by signal to noise and possible aberration effects.
While current efforts focus on mean flow estimation, future assessment of time-resolved volumetric flow might present new challenges. Even though mechanically swept arrays are able to map the cardiac cycle, with or without ECG gating, two-dimensional arrays have a competitive speed advantage. The former may require 3–5 seconds to scan a single 3D volume in color flow, whereas the latter may acquire 2–4 3D volumes per second and thus yields quasi real-time mean flow estimation or rapid temporal flow assessment.
Practical clinical considerations include aberration distortion of the color flow beam which may distort the spatial extent of the intersected lumen, thus affecting flow quantification (Q). A linear spatial distortion of the order Δε would result in a quadratic order Δε + (Δε)2 flow distortion. On the contrary, uniform spatial beam displacement, i.e., beam translation, would not affect Q. Possible acoustic reverberations in the vessel are not of great concern for the estimation of Q since the c-plane needs to intersect the lumen in a non-parallel geometry – reverberations have not been observed thus far, neither in B-mode nor color flow. However, in this geometry, axial partial volume of a voxel due to the slanted lumen and finite color flow pulse length may warrant future investigation.
TABLE III.
Field II Configuration
| Sound speed | 1540 m/s |
| Attenuation | 0 dB/MHz/cm |
| Sampling frequency | 30× center frequency |
| Elevational discretization | 7 sub-elements |
Acknowledgements
We thank Philips Healthcare for supplying the ultrasound scanner used in this investigation. This research was supported in part through computational resources and services provided by Advanced Research Computing at the University of Michigan, Ann Arbor. We would also like to acknowledge research support by the NIH R21HD095501-01A1.
Biographies

Oliver D. Kripfgans is a Research Associate Professor in the Department of Radiology at the University of Michigan with adjunct appointments in the Applied Physics Program as well as the Department of Biomedical Engineering. His current research is centered on 3D color flow-based blood flow quantification and high frequency 2D dental imaging. Dr. Kripfgans is a member of the Deutsche Physikalische Gesellschaft, the Acoustical Society of America and a Fellow of the American Institute of Ultrasound in Medicine.

Jonathan M. Rubin is a Professor Emeritus of Radiology with the University of Michigan, Ann Arbor, MI, USA. He has been involved in ultrasound research for approximately 40 years. He is currently involved in research projects related to blood volume flow measurements, blood perfusion measurements, placental function, lung ventilation, and elasticity measurements.

Stephen Z. Pinter received the B.Eng. (Hons.) and M.A.Sc. degrees in Electrical Engineering from Ryerson University, Toronto, ON, Canada, in 2003 and 2005, respectively. He received the Ph.D. degree in Biomedical Engineering Science from the University of Western Ontario in affiliation with Robarts Research Institute, London, ON, Canada, in 2009. His primary research specialization is flow imaging with preclinical and clinical ultrasound systems – interests include basic science and translational research in the areas of Doppler/flow methods, vascular detection and quantification, and three-dimensional blood volume flow evaluation. He is an IEEE member and can be contacted at spinter@ieee.org.

Ron Leichner has worked in Ultrasound Marketing/Product develoment at Advanced Technology Laboratories (ATL) and Philips Ultrasoound for the past 35 years.

James Jago was born in Surrey, England in 1961. He received a B.Sc. in Physics from the University of Nottingham in 1983 and a M.Sc. in Medical Physics from the University of Surrey in 1984. He then joined the Medical Physics Department at Newcastle General Hospital, where he conducted research into various topics including acoustic output from medical ultrasound equipment, ultrasound bio-effects, and ultrasound computed tomography of the Breast for which he received a Ph.D. from the University of Newcastle upon Tyne in 1993. In 1995 Dr. Jago joined the Ultrasound group at ATL, based in Bothell, WA, which was later acquired by Philips. Since joining ATL/Philips Dr. Jago has worked in many areas of ultrasound, including: definition of new transducers, designing B-mode features and image optimization, and applications of 3D, all across multiple clinical applications. Currently, Dr. Jago has the title of Principal Scientist within the Clinical Science group. His main responsibilities now include helping to define the strategy and roadmap for Philips Ultrasound in the General Imaging space, as well as identifying and driving opportunities, both internally and via external research partners, for new applications of ultrasound. In recent years he has been investigating the role of 3D ultrasound, plus machine learning, in organ modelling and in the quantification of biological function. He holds more than 30 patents and is an author on more than 25 scientific papers in the field of Medical Ultrasound.

J. Brian Fowlkes (M’94) received his B.S. degree in physics from the University of Central Arkansas in 1983, and his M.S. and Ph.D. degrees from the University of Mississippi in 1986 and 1988, respectively, both in physics. He came to the University of Michigan in 1988 and is now Professor of Radiology and Biomedical Engineering in the Department of Radiology. He is currently directing and conducting research in medical ultrasound for diagnostic and therapeutic applications including development of portable ultrasound systems, acoustic droplet vaporization and microbubble contrast agents for drug delivery and imaging, volume blood flow using 3D ultrasound and tissue effects of high intensity pulsed ultrasound (histotripsy).
References
- [1].Levick JR, An introduction to cardiovascular physiology, 5th ed. London: Hodder Arnold, 2010, pp. xii, 414 p. [Google Scholar]
- [2].Pinsky MR and Payen D, Functional hemodynamic monitoring (Update in intensive care medicine,). Berlin; New York: Springer, 2006, pp. xii, 419 p. [Google Scholar]
- [3].Robin ED, “The cult of the Swan-Ganz catheter. Overuse and abuse of pulmonary flow catheters,” Annals of internal medicine, vol. 103, no. 3, pp. 445–9, 1985. [DOI] [PubMed] [Google Scholar]
- [4].Gill RW, “Measurement of blood flow by ultrasound: accuracy and sources of error,” Ultrasound in Medicine and Biology, vol. 11, no. 4, pp. 625–641, 1985. [DOI] [PubMed] [Google Scholar]
- [5].Hoyt K, Hester FA, Bell RL, Lockhart ME, and Robbin ML, “Accuracy of volumetric flow rate measurements: an in vitro study using modern ultrasound scanners,” J Ultrasound Med, vol. 28, no. 11, pp. 1511–8, November 2009. [DOI] [PMC free article] [PubMed] [Google Scholar]
- [6].Cooper KM, Bernstein IM, Skelly JM, Heil SH, and Higgins ST, “The Independent Contribution of Uterine Blood Flow to Birth Weight and Body Composition in Smoking Mothers,” Am J Perinatol, vol. 35, no. 5, pp. 521–526, April 2018; [DOI] [PubMed] [Google Scholar]; Rizzo G, Rizzo L, Aiello E, Allegra E, and Arduini D, “Modelling umbilical vein blood flow normograms at 14–40 weeks of gestation by quantile regression analysis,” J Matern Fetal Neonatal Med, vol. 29, no. 5, pp. 701–6, March 2016. [DOI] [PubMed] [Google Scholar]
- [7].Chien A, Wang YL, McWilliams J, Lee E, and Kee S, “Venographic Analysis of Portal Flow After TIPS Predicts Future Shunt Revision,” AJR Am J Roentgenol, vol. 211, no. 3, pp. 684–688, September 2018. [DOI] [PubMed] [Google Scholar]
- [8].Ma IWY et al. , “Correlation of carotid blood flow and corrected carotid flow time with invasive cardiac output measurements,” Crit Ultrasound J, vol. 9, no. 1, p. 10, December 2017. [DOI] [PMC free article] [PubMed] [Google Scholar]
- [9].Shung KK, Diagnostic ultrasound: imaging and blood flow measurements, Second edition ed. Boca Raton: CRC Press, Taylor & Francis Group, 2015, pp. xvii, 273 pages. [Google Scholar]
- [10].Rumack CM, Wilson SR, and Charboneau JW, Diagnostic ultrasound, 2nd ed. St. Louis: Mosby, 1998. [Google Scholar]
- [11].Theodoraki K et al. , “Ultrasonographic evaluation of abdominal organs after cardiac surgery,” The Journal of surgical research, vol. 194, no. 2, pp. 351–60, 2015. [DOI] [PubMed] [Google Scholar]
- [12].Gill R, “Measurement of human umbilical venous blood flow in utero,” in Neonatal Physiological Measurements: Elsevier, 1986, pp. 447–455. [Google Scholar]
- [13].Holland CK, Clancy MJ, Taylor KJ, Alderman JL, Purushothaman K, and McCauley TR, “Volumetric flow estimation in vivo and in vitro using pulsed-Doppler ultrasound,” Ultrasound in Medicine and Biology, vol. 22, no. 5, pp. 591–603, 1996. [DOI] [PubMed] [Google Scholar]
- [14].Lynnworth LC and Liu Y, “Ultrasonic flowmeters: half-century progress report, 1955–2005,” Ultrasonics, vol. 44 Suppl 1, pp. e1371–8, December 22 2006. [DOI] [PubMed] [Google Scholar]
- [15].Franklin D, Baker D, Ellis R, and Rushmer R, “A pulsed ultrasonic flowmeter,” IRE Transactions on medical electronics, no. 4, pp. 204–206, 1959. [Google Scholar]
- [16].Fox MD, “Multiple Crossed-Beam Ultrasound Doppler Velocimetry,” IEEE Transactions on Sonics and Ultrasonics, vol. SU-25, no. 5, pp. 281–286, 1978. [Google Scholar]
- [17].Ricci S, Cinthio M, Ahlgren AR, and Tortoli P, “Accuracy and reproducibility of a novel dynamic volume flow measurement method,” Ultrasound Med Biol, vol. 39, no. 10, pp. 1903–14, October 2013. [DOI] [PubMed] [Google Scholar]
- [18].Ricci S, Bassi L, and Tortoli P, “Real-time vector velocity assessment through multigate Doppler and plane waves,” IEEE Trans Ultrason Ferroelectr Freq Control, vol. 61, no. 2, pp. 314–24, February 2014. [DOI] [PubMed] [Google Scholar]
- [19].Kasai C, Namekawa H, Koyano A, and Omoto R, “Real-time two-dimensional blood flow imaging using an autocorrelation technique,” IEEE Trans Sonics Ultras, vol. 32, pp. 458–464, 1985. [Google Scholar]
- [20].Hottinger CF and Meindl JD, “Blood flow measurement using the attenuation-compensated volume flowmeter,” Ultrasonic Imaging, vol. 1, no. 1, pp. 1–15, 1979. [DOI] [PubMed] [Google Scholar]
- [21].Moser U, Vieli A, Schumacher P, Pinter P, Basler S, and Anliker M, “Ein Doppler-Ultraschall-Gerät zur Bestimmung des Blut-Volumenflusses,” Ultraschall in der Medizin, vol. 13, no. 02, pp. 77–79, 1992. [DOI] [PubMed] [Google Scholar]
- [22].Sun Y, Ask P, Janerot-Sjöberg B, Eidenvall L, Loyd D, and Wranne B, “Estimation of volume flow rate by surface integration of velocity vectors from color Doppler images,” Journal of the American Society of Echocardiography, vol. 8, no. 6, pp. 904–914, 1995. [DOI] [PubMed] [Google Scholar]
- [23].Poulsen JK and Kim WY, “Measurement of volumetric flow with no angle correction using multiplanar pulsed Doppler ultrasound,” IEEE transactions on biomedical engineering, vol. 43, no. 6, pp. 589–599, 1996. [DOI] [PubMed] [Google Scholar]
- [24].Kim WY, Poulsen JK, Terp K, and Staalsen N-H, “A new Doppler method for quantification of volumetric flow: in vivo validation using color Doppler,” Journal of the American College of Cardiology, vol. 27, no. 1, pp. 182–192, 1996. [DOI] [PubMed] [Google Scholar]
- [25].Haites N, Mowat DR, Mclennan F, and Rawles J, “How far is the cardiac output?,” The Lancet, vol. 324, no. 8410, pp. 1025–1027, 1984. [DOI] [PubMed] [Google Scholar]
- [26].Underwood R and Firmin D, Magnetic resonance of the cardiovascular system. Blackwell Scientific Publications, 1991; [Google Scholar]; Mostbeck GH, Caputo GR, and Higgins CB, “MR measurement of blood flow in the cardiovascular system,” AJR. American journal of roentgenology, vol. 159, no. 3, pp. 453–461, 1992. [DOI] [PubMed] [Google Scholar]
- [27].Rubin JM, Bude RO, Carson PL, Bree RL, and Adler RS, “Power Doppler US: a potentially useful alternative to mean frequency-based color Doppler US,” Radiology, vol. 190, no. 3, pp. 853–6, March 1994. [DOI] [PubMed] [Google Scholar]
- [28].Rubin JM, Bude RO, Fowlkes JB, Spratt RS, Carson PL, and Adler RS, “Normalizing fractional moving blood volume estimates with power Doppler US: defining a stable intravascular point with the cumulative power distribution function,” Radiology, vol. 205, no. 3, pp. 757–65, December 1997. [DOI] [PubMed] [Google Scholar]
- [29].Lui G and Burns P, “The attenuation compensated C-mode flowmeter: a new Doppler method for blood volume flow measurement,” in Ultrasonics Symposium, 1997. Proceedings., 1997 IEEE, 1997, vol. 2, pp. 1285–1289: IEEE. [Google Scholar]
- [30].Kripfgans OD, Rubin JM, Hall AL, Gordon MB, and Fowlkes JB, “Measurement of volumetric flow,” J Ultrasound Med, vol. 25, no. 10, pp. 1305–11, October 2006. [DOI] [PubMed] [Google Scholar]
- [31].Richards MS, Kripfgans OD, Rubin JM, Hall AL, and Fowlkes JB, “Mean volume flow estimation in pulsatile flow conditions,” Ultrasound Med Biol, vol. 35, no. 11, pp. 1880–91, November 2009. [DOI] [PMC free article] [PubMed] [Google Scholar]
- [32].Pinter SZ et al. , “Three-dimensional sonographic measurement of blood volume flow in the umbilical cord,” J Ultrasound Med, vol. 31, no. 12, pp. 1927–34, December 2012. [DOI] [PMC free article] [PubMed] [Google Scholar]
- [33].Pinter SZ et al. , “Volumetric blood flow in transjugular intrahepatic portosystemic shunt revision using 3-dimensional Doppler sonography,” J Ultrasound Med, vol. 34, no. 2, pp. 257–66, February 2015. [DOI] [PMC free article] [PubMed] [Google Scholar]
- [34].Pinter SZ, Kripfgans OD, Treadwell MC, Kneitel AW, Fowlkes JB, and Rubin JM, “Evaluation of Umbilical Vein Blood Volume Flow in Preeclampsia by Angle-Independent 3D Sonography,” J Ultrasound Med, December 15 2017. [DOI] [PubMed] [Google Scholar]
- [35].Jensen JA and Svendsen NB, “Calculation of pressure fields from arbitrarily shaped, apodized, and excited ultrasound transducers,” IEEE Trans Ultrason Ferroelectr Freq Control, vol. 39, no. 2, pp. 262–7, 1992; [DOI] [PubMed] [Google Scholar]; Jensen JA, “Field: A Program for Simulating Ultrasound Systems,” presented at the 10th Nordic-Baltic Conference on Biomedical Imaging Published in Medical & Biological Engineering & Computing, 1996. [Google Scholar]
- [36].Goodman JW, “Statistical properties of laser speckle patterns,” in Laser speckle and related phenomena: Springer, 1975, pp. 9–75. [Google Scholar]
- [37].Namekawa K, Kasai C, Tsukamoto M, and Koyano A, “Real-time blood flow imaging system utilizing auto-correlation techniques,” in Proceedings of Ultrasound, Lerski RA and Morley P, Eds. New York: Pergamon Press, 1982. [Google Scholar]
- [38].Tang C, Blatter DD, and Parker DL, “Accuracy of phase-contrast flow measurements in the presence of partial-volume effects,” Journal of Magnetic Resonance Imaging, vol. 3, no. 2, pp. 377–385, 1993. [DOI] [PubMed] [Google Scholar]


