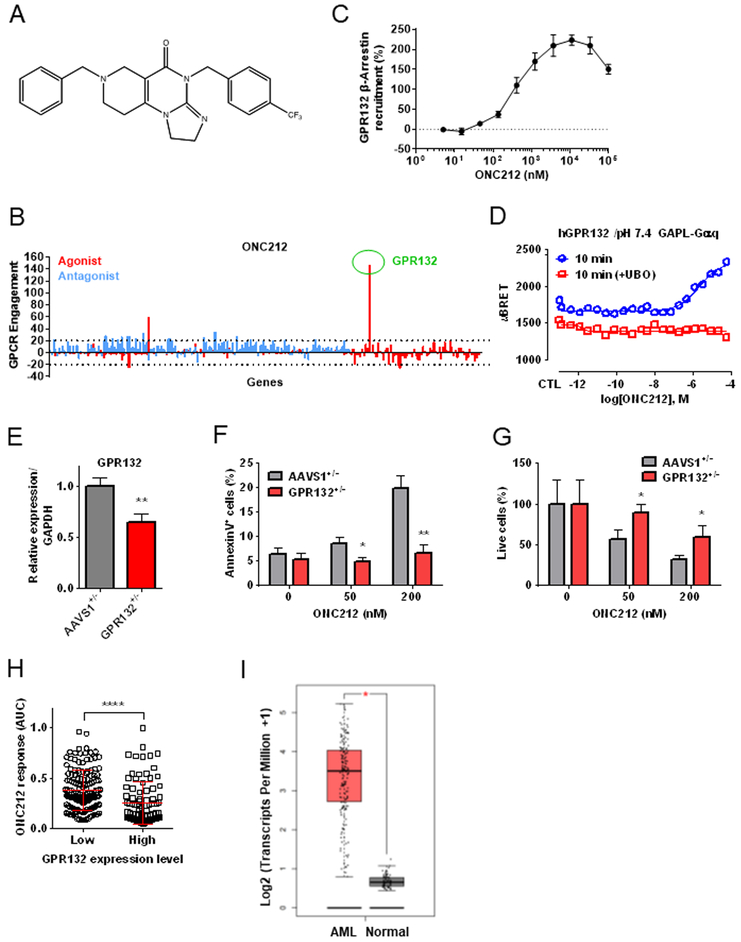
Figure 1. Target screening of G protein-coupled receptors (GPCRs) identifies GPR132 as a receptor of ONC212.
(A) Chemical structure of ONC212. (B) ONC212 (10 μM) target screening in GPCRs performed with PathHunter β-Arrestin assay. Dotted line indicates a 20% cut-off to select targets for subsequent validation. (C) ONC212 dose-response curve in the PathHunter β-Arrestin assay for GPR132. EC50 = 405 nM (n = 2). (D) Cells were pre-treated for 1h with UBO-QIC (100 nM). Experimental data were produced in singleton and curves were fitted using the 4-parameter logistic non-linear regression model (GraphPad 6). Data in graphs represent a 10 min incubation with ONC212 and expressed as uBRET. (E) qRT-PCR analysis of GPR132 expression. GFP heterozygous knock-in at GPR132 locus (GPR132+/−; GPR132 heterozygous knock-out) and at AAVS1 locus (AAVS1+/−; gene knock-in control). (F) The percentage of apoptotic cells (AnnexinV+ cells) induced by ONC212 treatment for 72 h in GPR132+/− and AAVS1+/−. (G) The percentage of live cell numbers after 72 h-treatment with ONC212 in GPR132+/− and AAVS1+/−. (H) Average ONC212 response as measured by the area under the dose-response curve (AUC) in GDSC cell lines with high versus low GPR132 expression. ****; P < 0.001. (I) comparison of GPR132 expression in AML and normal samples using Gene expression profiling interactive analysis (GEPIA). AML (n=173) and Normal (n=70) *; p < 0.01,

