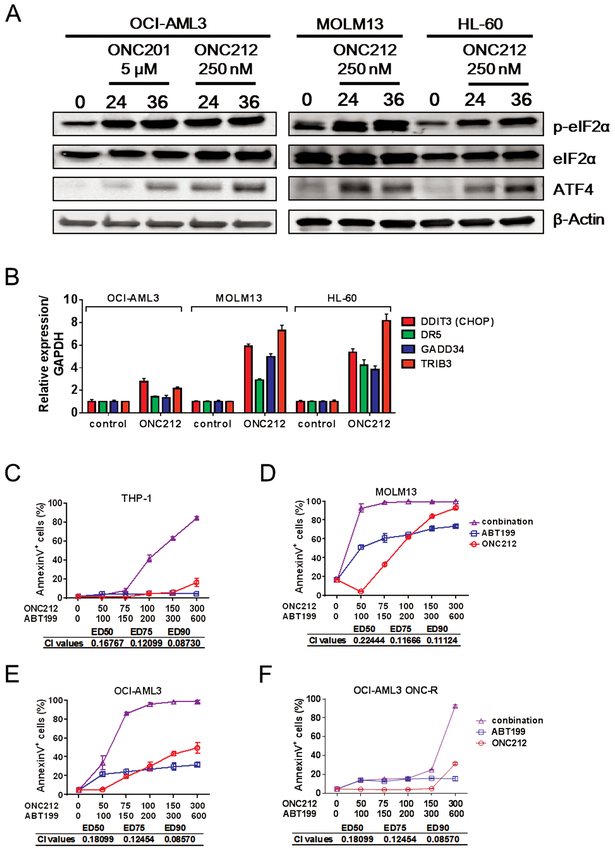
Figure 5. ONC212 induces integrated stress response and shows synergistic effects with ABT-199.
. (A) Western blotting analysis of eIF2α phosphorylation level and ATF4 expression. We treated OCI-AML3, MOLM13 and HL-60 with or without ONC212 (250 nM) or ONC201 (5 μM) for the indicated time. (B) Relative expression level of DDIT3 (CHOP), DR5, GADD34 and TRIB3. We treated OCI-AML3, MOLM13 and HL-60 with or without ONC212 (250 nM) for 24 h and analysis of gene expression by qRT-PCR. The range given for these genes relative to control were determined by evaluating the expression: 2–ΔΔCT with ΔΔCT + s and ΔΔCT – s, where s = the SD of the ΔΔCT value. (C-F) The percentage of annexin V+ cells induced by ONC212 and/or ABT-199. All data are shown as the mean ± SD (n = 3). The combination index (CI) values for synergistic effects were all performed with Compusyn software.

