Abstract
The article proposes a method for evaluation of the consistency of human movements within the context of physical therapy and rehabilitation. Captured movement data in the form of joint angular displacements in a skeletal human model is considered in this work. The proposed approach employs an autoencoder neural network to project the high-dimensional motion trajectories into a low-dimensional manifold. Afterwards, a Gaussian mixture model is used to derive a parametric probabilistic model of the density of the movements. The resulting probabilistic model is employed for evaluation of the consistency of unseen motion sequences based on the likelihood of the data being drawn from the model. The approach is validated on two physical rehabilitation movements.
Keywords: Human movement modeling, Physical rehabilitation, Neural networks, Gaussian mixture model, Skeletal data
1. Introduction
Mathematical modeling and analysis of human motions is challenging, due to the high variability and uncertainty in movement data. Sources of variability include the inherently stochastic nature of human movements and individual characteristics, such as age, gender, or weight, whereas sources of uncertainty include the errors associated with the sensory measurement in data processing. The development of mathematical models that have abilities to encode human movements of arbitrary complexity and are robust to the variability and uncertainty in movement data remains to be realized [1–8]. The presented research investigates the application of mathematical movement models for evaluating the consistency of exercises that are commonly performed in physical therapy and rehabilitation programs. Despite the design of a variety of new tools and devices in support of physical therapy and rehabilitation, such as robotic assistive systems [9], use of graphical avatars to demonstrate the prescribed exercises [10,11], and virtual reality and gaming interfaces [12], there is still a lack of versatile and robust systems for automatic evaluation of patient movements. Most of the existing studies on modeling therapy exercises focus on classification of the type of therapy movement [13–15], rather than on evaluation of movement consistency. Furthermore, the few studies in the published literature that propose methods for movement evaluation rely on a set of handcrafted features and posture descriptors for that purpose. An example of such system based on Kinect-acquired skeletal data proposed by Anton et al. [16] employed a set of 30 manually selected features for posture description. Several other works proposed similar sets of manually preselected movement features [11,17–19]. Although such movement descriptors are effective for evaluating the movements for which they were specifically designed, their performance often degrades when applied to new type of movements. In addition, current methods for movement evaluation typically employ performance metrics based on distance functions, such as Dynamic Temporal Warping distance [16, 20] or Mahalanobis distance [18], calculated at the level of individual data measurements without accounting for the variability and uncertainty of movement data.
Our proposed method is based on applying machine learning methods for automatic selection of relevant features for each individual movement from collected data of multiple repetitions of the movement. To that end, an autoencoder neural network is applied for dimensionality reduction and for extracting the most important attributes in the recorded high-dimensional movement data. Subsequently, the resulting low-dimensional data sequences are encoded with a Gaussian mixture model (GMM) yielding a parametric density estimation model of the studied motions. The derived model is used for evaluation of new instances of the movements, by using the likelihood of the movement data with respect to the mixture of Gaussian probability density functions as a performance metric. The proposed approach is validated on human skeletal data [21] collected with an optical tracking system for two physical rehabilitation exercises: deep squat and standing shoulder abduction.
The goal of the presented research is to apply machine learning algorithms for mathematical modeling of movement data and assessment of the level of correctness in the movement performance. Our long term-goal is to develop a commercial system for evaluating the quality of exercises performed by patients in rehabilitation programs. Such system can potentially provide instant feedback to patients of the correctness of their performance, as well as it can assist physical therapists in tracking the patient progress in the program. In home-based rehabilitation, the system can encourage patient engagement in the program, potentially resulting in faster functional recovery, fewer in-patient visits, and reduced healthcare costs.
2. Methods
This section begins with an introduction to the data and the data notation, and afterwards it presents the proposed method for modeling and evaluation of physical therapy movements. Autoencoder neural network used for reducing the dimensionality of the movement data is first described. Afterward, mathematical formulation of GMM is presented, which is employed for density estimation of the low-dimensional movement data produced by the autoencoder network.
2.1. Data
The movement data used in this research consists of the joint angles of 10 subjects performing 2 exercises commonly performed by patients undergoing rehabilitation therapy [21]. The two exercises are a deep squat movement and a standing shoulder abduction movement. As this research is focused on developing a model to evaluate patient consistency in performing physical therapy exercises, each subject performed 10 repetitions of the movements both correctly, i.e., simulating performance by a physical therapist (PT), and incorrectly, i.e., simulating performance by a patient with musculoskeletal constraints performing the movements in an unsupervised, home-based scenario.
The data was collected using a Vicon optical tracking system which utilizes eight cameras with high speed and resolution attributes for tracking a set of 39 retroreflective markers placed on strategic locations on the subject’s body. The collected data contains a total of 117 dimensions, representing all the joint angles recorded by the system throughout the movements. The frame rate for the data collection was set to 100 Hz. A more detailed description of the data can be found in reference [21]. The data collection was approved by the Institutional Review Boards at the University of Idaho on April 26, 2017 under the identification code IRB 16–124. The demographic information of the ten subjects who participated in the data collection is provided in Table 1. The average age of the subjects was 29.3 years, with the standard deviation of 5.85 years. The exclusion criteria included musculoskeletal injuries, pregnancy, neurological disorders that affect balance, less than 6 months postorthopedic surgery, less than 2 months post-visceral surgery, contagious illnesses, and taking medications that affect proprioceptive capabilities. In addition, the study did not include children under the age of 18.
Table 1.
Demographic information for the subjects.
| Subject ID | Gender | Height (cm) | Weight (kg) | BMI | Dominant side | Age |
|---|---|---|---|---|---|---|
| s01 | Female | 169.0 | 69.4 | 24.3 | Right | 23 |
| s02 | Male | 180.0 | 83.0 | 25.6 | Right | 31 |
| s03 | Male | 169.5 | 64.8 | 22.6 | Right | 44 |
| s04 | Female | 178.5 | 79.4 | 24.9 | Right | 31 |
| s05 | Male | 185.5 | 148.6 | 43.2 | Right | 28 |
| s06 | Female | 164.6 | 53.6 | 19.8 | Right | 27 |
| s07 | Female | 166.1 | 53.1 | 19.2 | Left | 24 |
| s08 | Male | 170.5 | 77.3 | 26.6 | Right | 29 |
| s09 | Female | 164.0 | 56.0 | 20.8 | Right | 26 |
| s10 | Male | 174.2 | 94.7 | 31.2 | Left | 26 |
The exercise data was next segmented into individual repetitions of the movements. This was completed by manually selecting the beginning and ending points of each repetition. This results in a total of 100 correct and 100 incorrect sets of data for each movement. For each set of segmented data, inconsistent or incompletely recorded repetitions were removed. For the deep squat exercise, multiple inconsistent repetitions were removed resulting in a total of 72 sequences. For the standing shoulder abduction exercise, along with removing inconsistent sequences, the data from two subjects were also removed due to them using their left arm to perform the movement versus the rest of the subjects using their right arm. This resulted in a total of 63 sequences for the standing shoulder abduction.
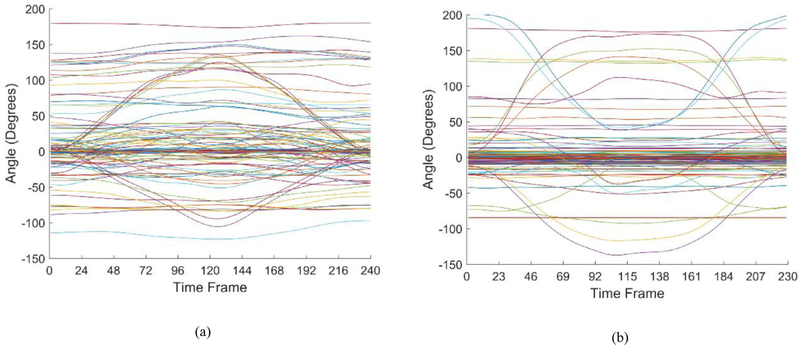
The angular movements of a single sequence for each exercise after the segmentation are shown in Fig. 1. One can note that a majority of the 117 dimensions for both movements exhibit little to no variation throughout the exercise. This is more noticeable in the standing shoulder abduction in Fig. 1(b), as the exercise involves only the movement of one of the subject’s arms. As a result, both movements can be represented by only a few of the 117 dimensions, and therefore modeling of said movements can be achieved by the extraction and evaluation of these key components through dimensionality reduction. The corresponding length of the sequences for the two movements is 240 and 229 time steps, respectively.
Fig. 1.
Single sequence representation of all 117 dimensions for: (a) Deep squat; (b) Standing shoulder abduction.
Prior to performing analysis of the proposed methods, the movement sequences for both exercises were aligned utilizing a temporal linear alignment method based on cubic interpolation of the data points. This was accomplished by determining the mean sequence length for each exercise, and applying that length to all remaining sequences.
2.2. Notation
The number of correct instances of a movement is denoted N, and the time series data for each instance of the movement is represented with Xn, where n is used to index the individual movement instances. The set of correct demonstrations of a movement is denoted
| (1) |
Each movement Xn represents a temporal sequence of Tn measurements taken at successive time steps, i.e.,
| (2) |
where superscripts are employed for indexing the temporal position of the measurements within each movement sequence. Due to the inherent variability of human motions, the movement sequences have varying lengths, i.e., Tn corresponds to the number of measurements of the instance Xn. Each individual measurement for is a D-dimensional vector, consisting of the values for all joint displacements in the human body. The following notation is used for the vectors of joint positions
| (3) |
The dimensionality D of the output data for different motion capturing systems ranges from 40 to 120 dimensions. One should note that the above notation employs bold font type for representing vectors and matrices.
The set of incorrect movements is denoted
| (4) |
where Yl symbolizes the individual movement sequence l. Similar to the notation for the correct sequences, the movement Yl consists of Tl temporal measurements, i.e.,
| (5) |
Each measurement for , i.e., it is a D-dimensional vector containing the joint displacement values in the human body at the time step t.
2.3. Dimensionality reduction
Dimensionality of the output data from sensory systems for capturing human motion is quite large, as the data encompasses displacements of the different body parts during the execution of the movements. As previously stated, the dimensionality of the various available mocap systems typically ranges between 40 and 120 dimensions. In addition, motion capture units acquire measurements of the locations of the body parts with a frame rate typically in the range from 30 Hz to 120 Hz. High frame rates are required for furnishing the ability to capture fast movements and to output smooth time series trajectories of performed body movements. Consequently, the combination of high acquisition frequency and high dimension of the streams of human motion data may impose a high computational burden in processing the data. Therefore, dimensionality reduction of recorded motion data is often considered an essential step in processing human movements.
2.3.1. Autoencoder neural networks
Autoencoders [22] are an unsupervised form of neural networks designed to learn an alternative representation of input data, through a process of data compression and reconstruction. The data processing involves a step of compressing input data through one or multiple hidden layers, i.e., encoding, followed by a step of reconstructing the output from the encoded representation through one or multiple hidden layers, i.e., decoding. Autoencoders are used for a variety of tasks in machine learning and other fields, including dimensionality reduction, feature extraction, and data denoising.
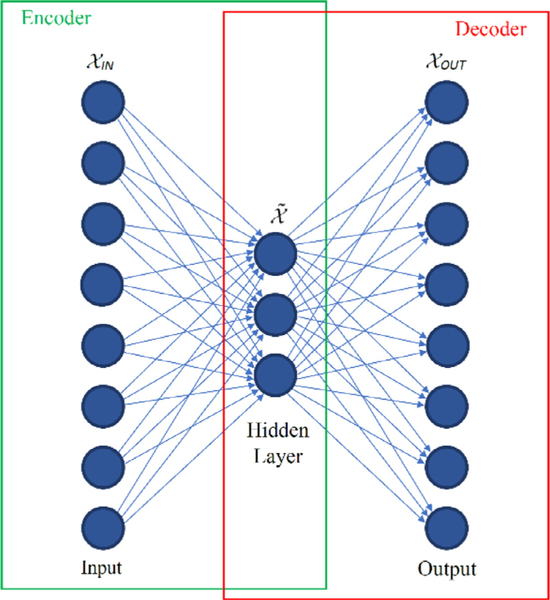
A graphical representation of an autoencoder is presented in Fig. 2. As illustrated in the figure, the structure of an autoencoder network comprises an encoder sub-net which maps the input data into a code representation , and a decoder sub-net which reprojects the code into the output . If the mapping function of the encoder is denoted , and the mapping function of the data reconstruction by the decoder is denoted the autoencoder network parameters are trained by minimizing the mean squared deviation between the output data and the compressed and then reconstructed input data, i.e.,
| (6) |
Fig. 2.
Graphical representation of an autoencoder neural network.
In terms of the current research, the key characteristic of the autoencoder is the ability to learn a sparse lower-dimensional representation of the human motion data, i.e., to extract the most significant dimensions representing the movement set . Autoencoder networks belong to the nonlinear techniques for dimensionality reduction, and as such provide greater representational capacity in comparison to the linear techniques, such as PCA [23].
2.4. Gaussian mixture model
GMM is a parametric probabilistic model for representing data with a mixture of Gaussian probability density functions [24]. GMM is parameterized with a set of mixing coefficients (also called mixture weights) for the Gaussian components, as well as means and covariances for the components. For a dataset consisting of multidimensional data vectors , for , and , a GMM with C Gaussian density components has the form
| (7) |
where πc for denote the mixing coefficients for the Gaussian components, and are the multivariate Gaussian probability density functions of the form
| (8) |
In the above equation, the mean and covariance matrix for the cth Gaussian component are denoted μc and Σc, respectively. The mixing coefficients satisfy the constraint . The complete GMM includes the parameters for all mixture components for c = 1, 2, …, C.
The most popular method for estimating the model parameters λ is the expectation maximization (EM) algorithm [25]. The objective of the EM algorithm is to maximize the likelihood of the mixture model parameters given the set of training data points . Other approaches for estimating GMM parameters include Maximum A Posterity estimation [26] and Mixture Density Networks [27].
3. Results
The presented approach for evaluation of the consistency of physical therapy movements includes a step of dimensionality reduction of movement trajectories, a step of encoding the reduced-dimensionality data into a parametric probabilistic model, and a step of quantifying the level of correctness of each movement repetition. This section first presents the implementation details of the proposed autoencoder neural network for dimensionality reduction. A comparison to other methods for dimensionality reduction is next provided, demonstrating improved capacity for data representation and feature extraction by the autoencoder network. Next, modeling the movement sequences with GMM is presented. The log-likelihood of the resulting GMM models is calculated and used to quantify the quality of the movements. A performance indicator is introduced that maps the values of the log-likelihood into a movement quality score in the range between 0 and 1.
The two most significant findings of the presented approach are: (1) dimensionality reduction of movement data with autoencoder neural networks outperforms two related conventional approaches on the therapy movement data; and (2) employing GMM for movement modeling and subsequently using the log-likelihood of the GMM model for assessment of movement consistency is efficient in distinguishing between correctly and incorrectly performed instances of the movements.
3.1. Autoencoder network architecture
A deep autoencoder artificial neural network with stacked layers of recurrent LSTM computational units [28] was employed for reducing the dimensionality of the rehabilitation exercise data. The data preprocessing steps included mean-shifting of each data dimension to a zero mean, and scaling the data in each sequence to values between −1 and 1. Furthermore, synthetic data was added at the beginning and ending of each input sequence, consisting of 50 vectors of equal values replicating the data at the first and last time frame, respectively. Adding synthetic data instances to the movement sequences resolved the problem of incorrect reconstruction of the beginnings and endings of the sequences by the autoencoder network.
Adam optimizer was used for training the neural network with the following parameters: learning rate 0.001, first and second moment exponential decay rates of 0.9 and 0.999, and zero division prevention value of 10−8. The set of motion sequences was split into a training subset containing 75% of the data, and a testing subset containing 25% of the data. The batch size was set to 20 sequences, and early stopping criterion was used in the training phase.
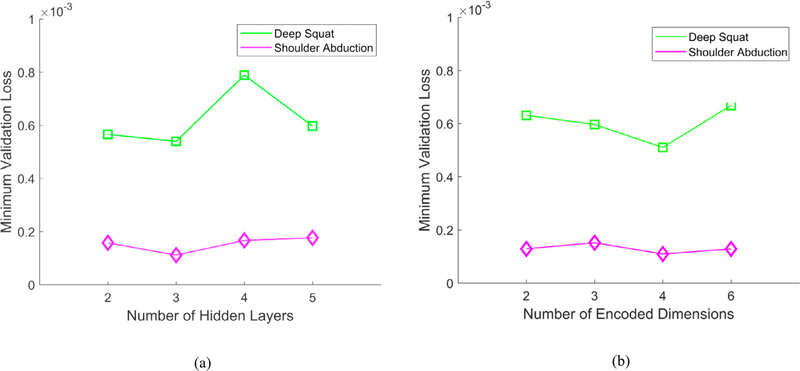
In a hyperparameters tuning phase it was found that three hidden layers yield the lowest loss on the testing subset for both studied movements, which is also shown in Fig. 3(a). Further increasing the number of layers resulted in overfitting on the training subset. Fig. 3(b) displays the loss on the testing subset for different numbers of encoded dimensions. The experiments indicated that four dimensions in the code vector produce the lowest validation loss.
Fig. 3.
Minimum validation loss for: (a) Different number of hidden layers; (b) Different number of encoded dimensions.
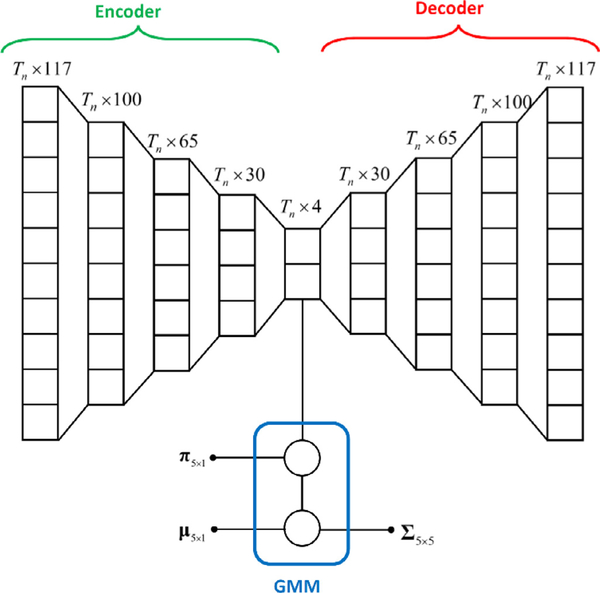
The resulting deep stacked autoencoder network with three layers of hidden units and four-dimensional code is shown in Fig. 4.
Fig. 4.
Autoencoder neural network with 3 hidden layers of neurons. The input and outputs are vectors of size Tn × 117, and the code is of size Tn × 4. The code is used as an input to a five-state GMM.
3.2. GMM encoding
GMM is next employed for encoding the low-dimensional movement sequences. For comparison, two commonly used approaches for dimensionality reduction of human movements are employed: maximum variance and PCA [23]. Maximum variance is a simple approach that presumes that the dimensions that have the highest variance of the displacement are the most important for motion representation, and the low-dimensional representation consists of the M dimensions with the largest variance. PCA is one of the most widely used approaches for dimensionality reduction. It projects the data into a lower-dimensional space by maximizing the total variance of the data, e.g., by either performing eigen decomposition of the covariance matrix or via singular value decomposition of the data matrix.
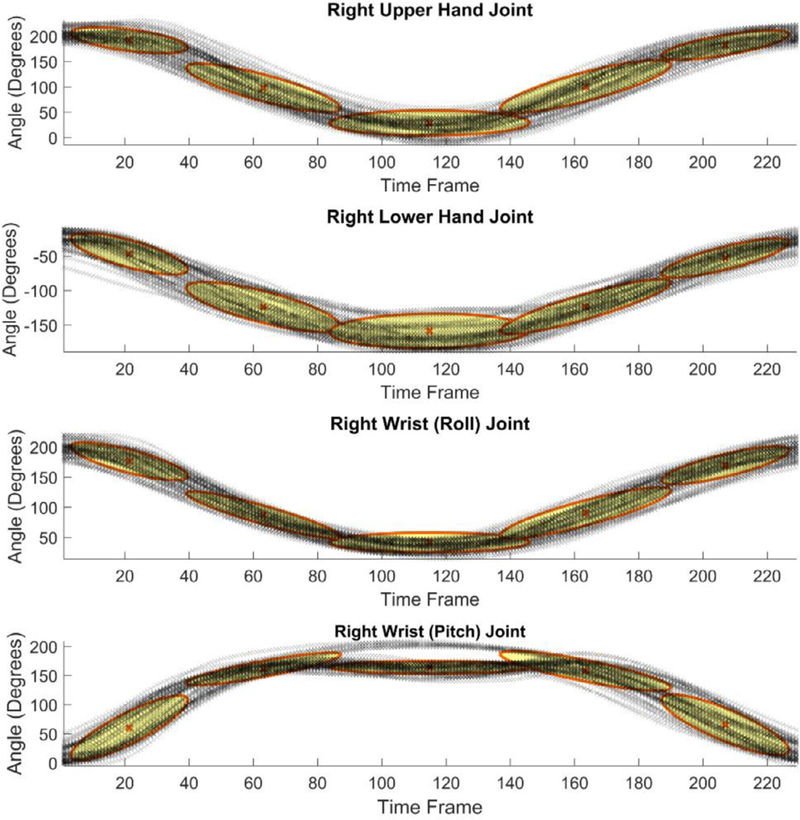
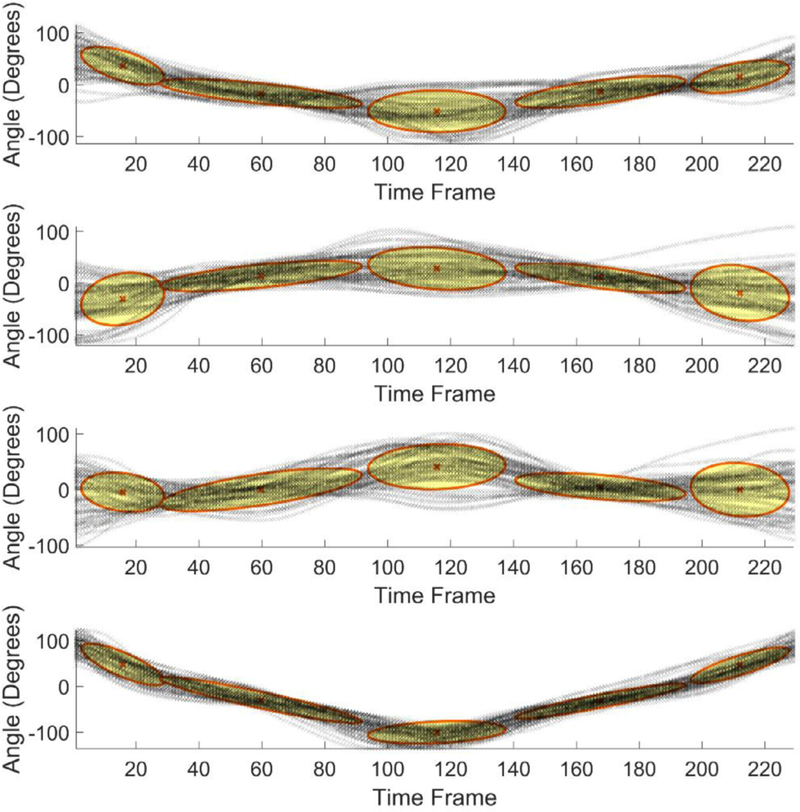
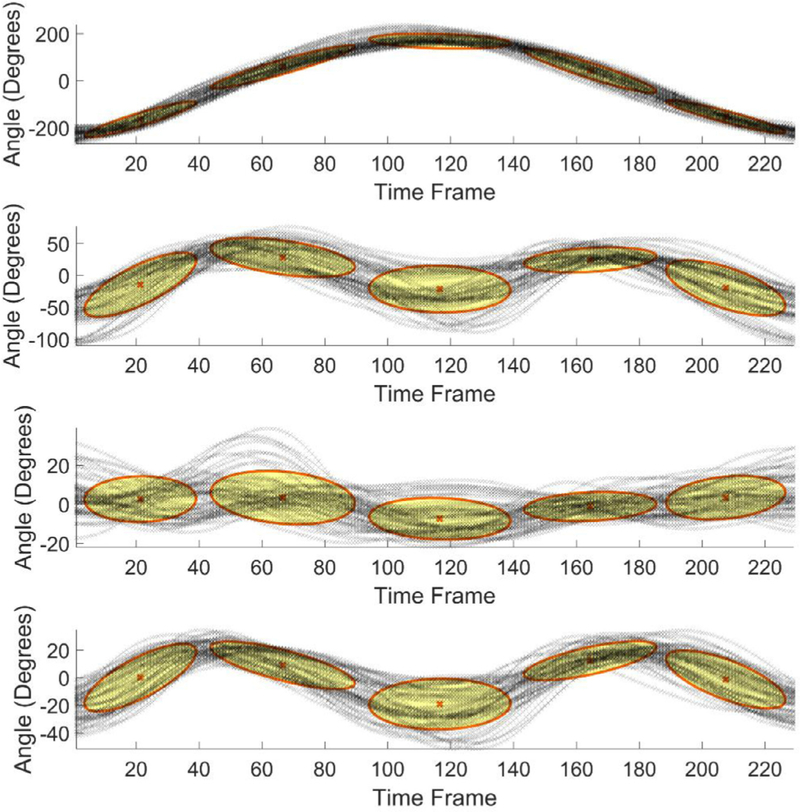
The results of GMM encoding of the dimensionality-reduced sequences for the standing shoulder abduction movement are shown in Figs. 5–7, where the figures present the GMM components for four dimensions of the input data, extracted via the maximum variance, PCA, and autoencoder neural network, respectively. The number of Gaussian mixture components was empirically set to five, based on the complexity of the movement trajectories. For the maximum variance method shown in Fig. 5, the largest angular variation corresponded to the joint angles of the right upper hand, right lower hand, and two of the angles of the right wrist. Similar, for the deep squat movement, the largest variance was noted in the angular displacements of the right and left hip joints, and the right and left knee joints. For the dimensionality reduction with PCA presented in Fig. 6 the set of motion sequences was zero mean-shifted before the four principal components were extracted. In the dimensionality reduction with the autoencoder neural network, the obtained code vectors for the movement sequences were employed as input to GMM, as shown in Fig. 4. The result of the data modeling with GMM is displayed in Fig. 7.
Fig. 5.
GMM results for data with reduced dimensionality via the maximum variance method.
Fig. 7.
GMM results for data with reduced dimensionality via autoencoder neural network.
Fig. 6.
GMM results for data with reduced dimensionality via principal component analysis.
3.3. Movement evaluation
The log-likelihood of the correct and incorrect sequences with respect to the resulting GMM model parameters is calculated and used for evaluation of the probability that the individual repetitions of the rehabilitation movements were drawn from the model. Let’s denote the log-likelihood of the correct sequence with reduced dimensionality , which is obtained from
| (9) |
And analogously, let’s denote the log-likelihood of the incorrect sequence , which is calculated in an identical manner by using the same GMM parameters λ. One should note again that the GMM model is trained by using only the correct movement sequences, because they represent the desired way to perform the movement.
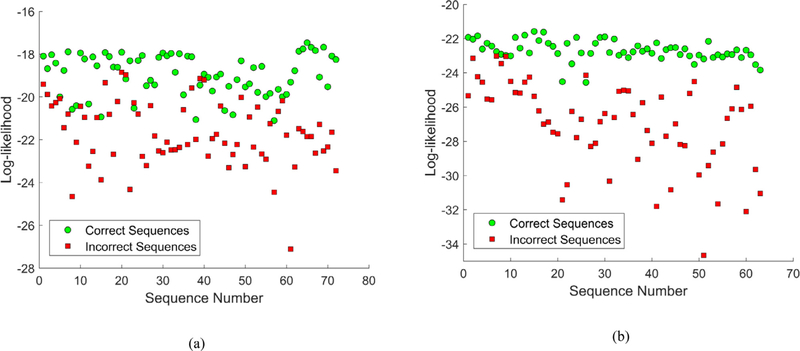
The values for the log-likelihood of the correct and incorrect sequences for the two movements are shown in Fig. 8. For most of the motion repetitions the log-likelihood of the correct sequences is higher in comparison to the values for the incorrect sequences, and there is a clear separation between the correct and incorrect sequences. For several instances, this is not the case. As multiple subjects performed the movement repetitions in the dataset, some of the repetitions were performed in a less consistent manner with respect to the other repetitions of the movement. Also, one can notice in Fig. 8(b) that for the standing shoulder abduction there is a more clear differentiation between the correct and incorrect movements, in comparison to the deep squat results presented in Fig. 8(a). The higher variation in the values of the log-likelihood for the deep squat movement in comparison to standing shoulder abduction stems from the increased complexity due to the greater number of joints involved in completing the deep squat repetitions.
Fig. 8.
Log-likelihood values for the correct and incorrect sequences for: (a) Deep squat movement; (b) Standing shoulder abduction movement.
Next, a distance metric is defined, which quantifies the absolute value of the difference between the log-likelihood values of the correct sequences and incorrect sequences , and is normalized by the root mean squared difference between and , i.e., it is calculated as:
| (10) |
The values of the mean and standard deviation for the distance metric for n = 1, 2, ..., N for the described dimensionality reduction approaches are presented in Table 2. The autoencoder neural network demonstrated the largest separation between the correct and incorrect sequences, in comparison to the values obtained with the other two methods. In general, data models that are able to better discriminate between the correct and incorrect examples of the movements are preferred.
Table 2.
Mean and standard deviation for the distance metric for the two movements and the three dimensionality reduction approaches.
| Approach | Deep Squat |
Standing shoulder abduction |
||
|---|---|---|---|---|
| Mean | Std. Deviation | Mean | Std. Deviation | |
| Maximum variance | 0.7367 | 0.5383 | 0.7659 | 0.6012 |
| PCA | 0.3777 | 0.2063 | 0.8161 | 0.5281 |
| Autoencoder Neural Network | 0.8717 | 0.4330 | 0.8696 | 0.4246 |
The distance metric is scaled and employed to derive another performance indicator S, which quantifies the distance of the log-likelihood values of the sequences from the average log-likelihood of the GMM model of the movement on a scale between 0 and 1. The proposed forms for the correct and incorrect movements are:
| (11) |
where denotes the mean values of the log-likelihood of the correct sequences.
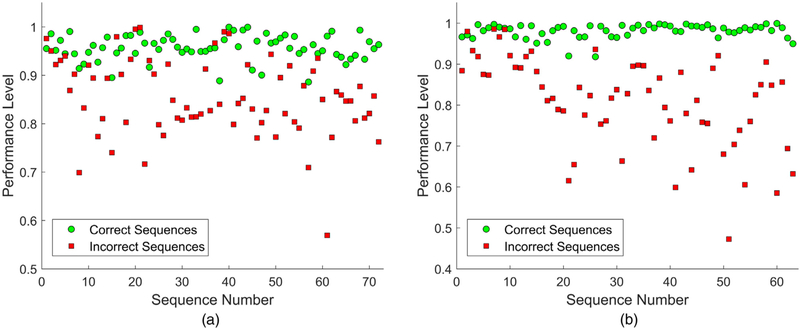
The values of the performance indicator S for the two movements are plotted in Fig. 9. This metric can be used to provide a score of a repetition of rehabilitation exercise as a percentage relative to a model of the movement. Arguably, the values of the parameter S calculated in this manner do not reflect the level of inconsistency in a qualitative fashion, and are based only on a numerical estimation of the log-likelihood deviation.
Fig. 9.
Performance indicator S values for the correct and incorrect sequences for: (a) Deep squat; (b) Standing shoulder abduction.
The accuracy in distinguishing the correct from incorrect movements based on the performance indicator Sis presented in Table 3. For the range of the scores of correct movements three different options are considered, according to the distances from the mean of the correct score values of one, two, and three standard deviations (denoted σ in the table). The table provides the number of correct repetitions that are accurately predicted as correct, versus the number of correct repetitions that are outside of the considered region and are predicted as incorrect (i.e., false positives). Similarly, the number of accurately predicted incorrect movements versus the inaccurately predicted incorrect movements (i.e., false negatives) is also presented. For the mid-region in the table that pertain to ± 2σ, the accuracy of predicting the correct movements is 94.44% and 96.83% for the two movements, whereas for the incorrect movements the accuracy values are 70.83% and 93.65%, respectively.
Table 3.
Accuracy of predicting the correct and incorrect prediction ↔ inaccurate prediction (percent of accurate predictions).
| Deep squat | Correct Movements | 62↔10 (86.11%) | 68↔4(94.44%) | 72↔ 0 (100%) |
| Incorrect Movements | 59↔13 (81.94%) | 51↔21(70.83%) | 44↔ 28 (61.11%) | |
| Standing shoulder abduction | Correct Movements | 56↔7 (88.89%) | 61↔2(96.83%) | 61↔ 2 (96.83%) |
| Incorrect Movements | 59↔ 4 (93.65%) | 59↔4(93.65%) | 56↔ 7 (88.89%) | |
3.4. Comparison to related approaches
For validation of the proposed approach, movement quality scores are assigned by the authors Vakanski and Paul based on visual observation of the recorded videos for the incorrect repetitions of the exercises. The employed metrics for movement assessment are listed in Table 4. For each metric, a score in the range from 0% to 100% is assigned to each exercise repetition, quantifying the performance in accomplishing the target posture. The metrics scores are multiplied with a set of weighting coefficients, adopted based on the metric importance in achieving the movement goal. A final ground truth score is obtained by averaging the assigned scores by the two graders, followed by dividing the scores with the maximum value for each exercise (in order to obtain ground truth score values less than 1).
Table 4.
Metrics used for assigning quality scores to the exercises, and weighting coefficients W provided in the parenthesis.
| Exercise | Metric (0–100%) |
|---|---|
| Deep squat | M1. The degree of body lowered toward the ground, based on overall angle of knees (W = 1) |
| M2. Trunk maintained vertical and straight during the exercise (W = 0.6) | |
| M3. Legs and knees maintained parallel and knees maintained over the feet (W = 0.4) | |
| M4. Maintained concurrence of left and right knee during the exercise (W = 0.4) | |
| M5. Arms maintained straight in front of the body (W = 0.2) | |
| M6. Heels maintained on the floor (W = 0.3) | |
| Standing shoulder abduction | M1. The degree of raising the arm as a percentage of the fully vertically raised arm (W = 1) |
| M2. Arm maintained in the lateral plane during the exercise (W = 0.5) | |
| M3. Arm maintained straight at the elbow and wrist, and it is not rotated (W = 0.4) | |
| M4. Trunk maintained vertical and straight during the exercise, there is not compensation for the arm rising by bending the trunk (W = 0.5) | |
| M5. Head maintained vertical and straight during the exercise (W = 0.2) | |
We compared the predicted movement quality scores by the proposed approach with three approaches for movement assessment that employ distance functions: dynamic temporal warping (DTW) distance [16,20,29], Mahalanobis distance [18], and Euclidean distance [30]. The resulting movement scores by these approaches are first scaled into a range that extends from the minimum ground truth score to the maximum ground truth score (i.e., 1). Mean squared error (MSE), mean absolute error (MAE), and mean absolute percentage error (MAPE) are used for comparison. The values of MSE, MAE, and MAPE for the four approaches are displayed in Table 5. The results indicate that the proposed approach based on GMM modeling produced the lowest deviation from the ground truth scores for the two considered exercises.
Table 5.
MSE, MAE, and MAPE between the ground truth scores and the predicted movement quality scores of four approaches for movement assessment.
| Exercise | Deep squat | Standing shoulder abduction |
|
|---|---|---|---|
| MSE | GMM | 0.0071 | 0.0029 |
| DTW | 0.0086 | 0.0042 | |
| Mahalanobis | 0.0144 | 0.0079 | |
| Euclidean | 0.0088 | 0.0037 | |
| MAE | GMM | 0.0708 | 0.0408 |
| DTW | 0.0756 | 0.0514 | |
| Mahalanobis | 0.1013 | 0.0701 | |
| Euclidean | 0.0764 | 0.0459 | |
| MAPE | GMM | 1.0342 | 1.0164 |
| DTW | 1.0606 | 1.0154 | |
| Mahalanobis | 1.1104 | 1.0516 | |
| Euclidean | 1.0635 | 0.9909 | |
4. Discussion
The paper presents a machine learning approach for modeling and quality assessment of movement data related to physical rehabilitation exercises.
Dimensionality reduction of the high-dimensional measurements of full body skeletons is performed with an autoencoder neural network. The network reduces the recorded 117dimensional data into 4-dimensional sequences, by extracting the important features and eliminating the non-relevant and redundant attributes of the movement data. The performance of the autoencoder network is compared to two other approaches that are traditionally used for dimensionality reduction: maximum variance, and PCA, based on the ability to distinguish between correctly and incorrectly performed repetitions of movements. For that purpose, a distance metric is introduced, and the results of the comparison are presented in Table 2. In conclusion, the autoencoder network produced larger distances between the correct and incorrect repetitions of the movements. This can be interpreted as an indicator that this technique was able to extract data features in the raw measurements of the body movements that are conducive toward the quantification of the level of correctness in the performance of the movements. The potential reasons for the improved performance of the autoencoder neural network stem from the capacity of the nonlinear activations in the network structure to capture richer data representations for dimensionality reduction, in comparison to PCA and maximum variance that employ a linear mapping of the input data into a lowerdimensional space. In addition, stacking multiple consecutive encoding and decoding layers in the autoencoder network produces a deep learning architecture that further increases the representational capacity in comparison to PCA and maximum variance approaches.
The proposed approach employs a Gaussian mixture model for encoding the low-dimensional data sequences into a statistical parametric representation of the movements. The motivation for using GMM for data modeling originates from the potential to utilize the likelihood, i.e., the probability of a motion sequence of being drawn from the model, as a statistical measure for assessment of the level of correctness of a recorded motion. The resulting log-likelihood values are further scaled into the [0,1] range, in order to produce performance quality scores that can be intuitively understood by patients and clinicians. The implementation results indicate that the approach was efficient in the assessment of the movement quality. The accuracy in predicting the correct movements was 94.44% and 96.83% for deep squat and standing shoulder abduction, respectively, and the corresponding accuracy for predicting the incorrect movements was 70.83% and 93.65% respectively. The potential reasons for the achieved results is the ability of GMM to handle the inter- and intra-subject variability in the movement performance.
The proposed method has several limitations. First, the data processing with the autoencoder neural network is computationally expensive, and takes several hours on a high-end computer with a graphic processing unit (GPU). Second, the presented methodology was evaluated on a dataset of movements performed by healthy subjects, where the data was acquired by using an expensive optical tracking system. In the future, we have plans to employ an inexpensive color-depth camera for collecting movements performed by patients enrolled in physical rehabilitation programs for valuation of the approach. Similarly, we will validate the proposed methodology on a larger number of movements.
The proposed method can also find use in other applications. One example is for automatic assessment of participant performance in functional screening tests, where the approach can eliminate the subjectivity of the screening procedure by the clinician. The methodology can also be employed for movement assessment by occupational therapists or athletic trainers, and in other general non-medical human movement applications.
Our ultimate goal is to develop a system that can automatically provide a score of the correctness of patient performance in homebased rehabilitation. Reports in the literature indicate that more than 90% of all therapy sessions are performed in a home-based setting [10]. Under these circumstances, the patients are asked to record their daily progress and periodically visit the PT for assessment of their progress and perhaps to be prescribed a new series of exercises. Still, numerous medical sources report of low levels of patient motivation and adherence to the recommended plans in home-based therapy, leading to prolonged treatment times and increased healthcare cost [31,32]. And although many different factors have been identified that contribute to the low compliance rate, the major impact factor is the absence of continuous feedback and oversight of patient exercises in a home environment by a healthcare professional. We believe that the provision of a system that provides a feedback to the patients will improve the therapy programs and benefit both patients and healthcare providers.
Acknowledgments
Funding
Center for Modeling Complex Interactions (CMCI) at the University of Idaho Interactions through NIH Award #P20GM104420
Footnotes
Declaration of Competing Interests
None declared.
Ethical approval
Approved by the Institutional Review Board (attached).
References
- [1].Mannini A, Sabatini AM. Machine learning methods for classifying human physical activity from on-body accelerometers. Sensors 2010;10(2):1154–75. [DOI] [PMC free article] [PubMed] [Google Scholar]
- [2].Schuldt C, Laptev I, Caputo B. Recognizing human actions: a local svm approach. In: Proceedings of the 17th international conference on pattern recognition; 2004. p. 32–6. [Google Scholar]
- [3].Begg R, Kamruzzaman J. A machine learning approach for automated recognition of movement patterns using basic, kinetic and kinematic gait data. J Biomech 2005;38(3):401–8. [DOI] [PubMed] [Google Scholar]
- [4].Fragkiadaki K, Levine S, Felsen P, Malik J. Recurrent network models for human dynamics. In: Proceedings of the 2015 IEEE international conference on computer vision; 2016. p. 4346–54. [Google Scholar]
- [5].Du Y, Wang W, Wang L. Hierarchical recurrent neural network for skeleton based action recognition. In: Proceedings of the 2015 IEEE conference on computer vision and pattern recognition; 2015. p. 1110–18. [Google Scholar]
- [6].Jain A, Zamir AR, Savarese S, Saxena A. Structural-RNN: deep learning on spatio-temporal graphs. In: Proceedings of the 2016 IEEE conference on computer vision and pattern recognition; 2016. p. 5308–17. [Google Scholar]
- [7].Field M, Stirling D, Pan Z, Ros M, Naghdy F. Recognizing human motions through mixture modeling of inertial data. Pattern Recognit 2015;48(8):2394–406. [Google Scholar]
- [8].Wang JM, Fleet DJ, Hertzmann A. Gaussian process dynamical models for human motion. IEEE Trans Pattern Anal Mach Intell 2007;30(2):283–98. [DOI] [PubMed] [Google Scholar]
- [9].Maciejasz P, Eschweiler J, Gerlach-Hahn K, Jansen-Troy A, Leonhardt S. A survey on robotic devices for upper limb rehabilitation. J NeuroEng Rehabilit 2014;11(3):1–29. [DOI] [PMC free article] [PubMed] [Google Scholar]
- [10].Komatireddy R, Chokshi A, Basnett J, Casale M, Goble D, Shubert T. Quality and quantity of rehabilitation exercises delivered by a 3-D motion controlled camera: a pilot study. Int J Phys Med Rehabilit 2014;2(4):1–14. [DOI] [PMC free article] [PubMed] [Google Scholar]
- [11].Anton D, Goni A, Illarramendi A, Torres-Unda JJ, Seco J. KiReS: a kinect based telerehabilitation system. In: Proceedings of the 2013 IEEE 15th International Conference on e-health networking, applications & services; 2013. p. 456–60. [Google Scholar]
- [12].Gauthier LV, Kane C, Borstad A, Strah N, Uswatte G, Taub E, et al. Video game rehabilitation for outpatient stroke (VIGoROUS): protocol for a multi-center comparative effectiveness trial of in-home gamified constraint-induced movement therapy for rehabilitation of chronic upper extremity hemiparesis. BMC Neurol 2017;17(109):1–18. [DOI] [PMC free article] [PubMed] [Google Scholar]
- [13].Ar I, Akgul YS. A monitoring system for home-based physiotherapy exercises In: Gelenbe E, Lent R, editors. Computer and information sciences III. London: Springer; 2013. p. 487–94. [Google Scholar]
- [14].Anton S, Anton FD. Monitoring rehabilitation exercises using ms kinect. In: Proceedings of the 2015 E-health and bioengineering conference; 2015. p. 1–4. [Google Scholar]
- [15].Lin JFS, Kulic D. Online segmentation of human motions for automated rehabilitation exercise analysis. IEEE Trans Neural Syst Rehabilit Eng 2013;22(1):168–80. [DOI] [PubMed] [Google Scholar]
- [16].Anton D, Goni A, Illarramendi A. Exercise recognition for kinect-based telerehabilitation. Methods Inf Med 2015;54(2):145–55. [DOI] [PubMed] [Google Scholar]
- [17].Haas D, Phommahavong S, Yu J, Kruger-Ziolek S, Moller K, Kretschmer J. Kinect based physiotherapy system for home use. Curr Direc Biomed Eng 2015;1:180–3. [Google Scholar]
- [18].Houmanfar R, Karg M, Kulic D. Movement analysis of rehabilitation exercises: distance metrics for measuring patient progress. IEEE Syst J 2016;10(3):1014–25. [Google Scholar]
- [19].Sandau M, Koblauch H, Moeslund TB, Aenaas H, Alkjaer T, Simonsen EB. Markerless motion capture can provide reliable 3D gain kinematics in the sagittal and frontal plance. Med Eng Phys 2014;36(9):1168–75. [DOI] [PubMed] [Google Scholar]
- [20].Zhang Z, Fang Q, Gu X. Objective assessment of upper-limb mobility for poststroke rehabilitation. IEEE Trans Biomed Eng 2016;63(4):859–68. [DOI] [PubMed] [Google Scholar]
- [21].Vakanski A, Jun HP, Paul D, Baker R. A data set of human body movements for physical rehabilitation exercises. Data 2018;3(2):1–15. [DOI] [PMC free article] [PubMed] [Google Scholar]
- [22].Bourlard H, Kamp Y. Auto-association by multilayer perceptrons and singular value decomposition. Biol Cybern 1988;59(4–5):291–4. [DOI] [PubMed] [Google Scholar]
- [23].Jolliffe IT. Principal component analysis. New York: Springer; 1989. [Google Scholar]
- [24].Bishop CM. Pattern recognition and machine learning. New York: Springer; 2006. [Google Scholar]
- [25].Dempster AP, Laird NM, Rubin DB. Maximum likelihood from incomplete data via the em algorithm. J R Stat Soc Ser B (Methodol) 1977;39(1):1–38. [Google Scholar]
- [26].McLachlan GJ, Basford KE. Mixture models: inference and applications to clustering. New York: Marcel Dekker; 1988. [Google Scholar]
- [27].Bishop CM. Mixture density networks. Neural Computing Research Group; February 1994. Report: NCRG/94/004. [Google Scholar]
- [28].Hochreiter S,Schmidhuber J. Long short-term memory. Neural Comput 1997;9(8):1735–80. [DOI] [PubMed] [Google Scholar]
- [29].Osgouei RH, Soulsbv D, Bello F. An objective evaluation method for rehabilitation exergames. In: Proceedings of the IEEE games, entertainment, media conference; 2018. p. 28–34. [Google Scholar]
- [30].Benetazzo F, Iarlori S, Ferracuti F, Giantomassi A, Ortenzi D, Freddi A, et al. Low cost rgb-d vision based system for on-line performance evaluation of motor disabilities rehabilitation at home. In: Proceedings of the fifth forum Italiano on ambient assisted living; 2014. [Google Scholar]
- [31].Bassett SF, Prapavessis H. Home-based physical therapy intervention with adherence-enhancing strategies versus clinic-based management for patients with ankle sprains. Phys Ther 2007;87(9):1132–43. [DOI] [PubMed] [Google Scholar]
- [32].Jack K, McLean SM, Moffett JK, Gardiner E. Barriers to treatment adherence in physiotherapy outpatient clinics: a systematic review. Man Ther 2010;15(3) 220–8.h. [DOI] [PMC free article] [PubMed] [Google Scholar]


