

Abstract
As rifampicin can cause the induction and inhibition of multiple metabolizing enzymes and transporters, it has been challenging to accurately predict the complex drug–drug interactions (DDIs). We previously constructed a physiologically‐based pharmacokinetic (PBPK) model of rifampicin accounting for the components for the induction of cytochrome P450 (CYP) 3A/CYP2C9 and the inhibition of organic anion transporting polypeptide 1B (OATP1B). This study aimed to expand and verify the PBPK model for rifampicin by incorporating additional components for the induction of OATP1B and CYP2C8 and the inhibition of multidrug resistance protein 2. The established PBPK model was capable of accurately predicting complex rifampicin‐induced alterations in the profiles of glibenclamide, repaglinide, and coproporphyrin I (an endogenous biomarker of OATP1B activities) with various dosing regimens. Our comprehensive rifampicin PBPK model may enable quantitative prediction of DDIs across diverse potential victim drugs and endogenous biomarkers handled by multiple metabolizing enzymes and transporters.
Study Highlights.
WHAT IS THE CURRENT KNOWLEDGE ON THE TOPIC?
☑ For drug–drug interaction (DDI) risk assessment, rifampicin is frequently administered as a perpetrator drug. To enhance the prediction accuracy of DDI risk and the applicability under various conditions, it is important for the physiologically‐based pharmacokinetic (PBPK) models of rifampicin to incorporate multifactorial mechanisms.
WHAT QUESTION DID THIS STUDY ADDRESS?
☑ Can the applicability of the rifampicin PBPK model be enhanced by incorporating additional components for organic anion transporting polypeptide 1B (OATP1B)/ cytochrome P450 (CYP) 2C8 induction and multidrug resistance protein 2 inhibition? Can the established model predict complex interactions with victim drugs as well as the endogenous biomarker coproporphyrin I (CP‐I) under diverse conditions?
WHAT DOES THIS STUDY ADD TO OUR KNOWLEDGE?
☑ Our model improved the prediction accuracy for glibenclamide, repaglinide, and CP‐I (particularly by incorporating OATP1B induction). Our results are consistent with growing clinical evidence of OATP1B induction by repeated rifampicin dosing.
HOW MIGHT THIS CHANGE DRUG DISCOVERY, DEVELOPMENT, AND/OR THERAPEUTICS?
☑ This expanded rifampicin PBPK model may offer versatility for diverse victim drugs and endogenous biomarkers handled by multiple metabolizing enzymes and transporters. The incorporation of OATP1B induction may change the current practice of assessing DDI risk for OATP1B substrates.
Rifampicin is a well‐known, potent inducer and inhibitor of drug transporters and metabolizing enzymes1, 2 and can cause complex drug–drug interactions (DDIs). The accurate prediction of DDIs involving rifampicin has, however, been challenging as the perpetration of transporters and metabolizing enzymes depends on the timing, duration, and routes of rifampicin dosing, which can impact the magnitude of DDIs. Physiologically‐based pharmacokinetic (PBPK) modeling can prove useful as a mechanism‐based approach in addressing this gap.3, 4 Recently we reported a PBPK model of rifampicin that quantitatively predicted the complex DDIs with glibenclamide mediated by the induction of cytochrome P450 (CYP)3A/2C9 and the inhibition of hepatic organic anion transporting polypeptide 1B (OATP1B).5
Recent clinical reports suggest that the pharmacokinetics of statins (substrates of OATP1B) can be altered by rifampicin via not only the inhibition but also the induction of OATP1B.6 For example, a single oral dose of 600 mg rifampicin significantly increased the area under the plasma concentration‐time curve (AUC) of pitavastatin (AUC ratios (AUCRs) of 5.7 and 6.4),7, 8 rosuvastatin (AUCR of 4.4),7 and pravastatin (AUCRs of 2.3 and 4.6),9, 10 which has been attributed to the inhibition of OATP1B by rifampicin. Meanwhile, multiple doses of rifampicin reduced the AUC of OATP1B substrates. When 2–600 mg rifampicin was given orally, AUC of pravastatin, which was given 12 hours after the last rifampicin dose, decreased in a rifampicin dose‐dependent manner.6 Similarly, the AUCR of pravastatin was also 0.69 with multiple doses of rifampicin.11 Hence, the effect of multiple doses of rifampicin on the AUC of OATP1B substrates can be complex of opposing effects: OATP1B induction and competitive inhibition. Indeed, the AUC of pitavastatin and coproporphyrin I (CP‐I; a substrate of OATP1B and a selective and sensitive clinical endogenous biomarker of OATP1B activities12, 13, 14) were increased following simultaneous rifampicin administration, but to a lesser extent after multiple doses than a single oral dose.7, 8, 14, 15 Overall, these clinical findings indicate that the induction of OATP1B by repeated rifampicin dosing may have a clinically significant impact on DDIs. Regarding the induction of CYP isoforms, CYP2C8 is induced by rifampicin as well as CYP3A and CYP2C9. Repeated oral dosing of 600 mg rifampicin significantly decreased the AUC of probe substrates for CYP2C8: pioglitazone (AUCR of 0.46)16 and rosiglitazone (AUCRs of 0.35 and 0.46).17, 18
With an increasing number of drugs identified to be substrates of OATP1B and CYP isoforms, it has become necessary to expand the applicability of our previously constructed PBPK model of rifampicin, which included its saturable hepatic uptake and autoinduction as well as the effects of CYP3A/CYP2C9 induction and OATP1B inhibition. By incorporating additional components for the induction of OATP1B and CYP2C8, the prediction accuracy of DDIs may be improved for a variety of victim drugs. In the cases of glibenclamide (a substrate of OATP1B, CYP2C9, and CYP3A) and repaglinide (a substrate of OATP1B, CYP2C8, and CYP3A), a single dose of 600 mg rifampicin resulted in the AUCRs of 2.3 (glibenclamide)19 and 1.9 and 2.8 (repaglinide).20, 21 In contrast, repeated dosing of 600 mg rifampicin resulted in the AUCRs of 0.37 and 0.78 (glibenclamide)19 and 0.2–0.68 (repaglinide)22, 23, 24 These data suggest that the dosing schedules/intervals of rifampicin are important in determining the magnitude of DDIs with the substrates of OATP1B and CYP isoforms.
In this study, we aimed to establish a further expanded PBPK model of rifampicin that can predict transporter‐mediated and CYP‐mediated DDIs. Additional components of rifampicin for the induction of OATP1B/CYP2C8 and the inhibition of multidrug resistance protein 2 (MRP2) were incorporated into our previous PBPK model, which included the induction of CYP3A/CYP2C9 and the inhibition of OATP1B.5 The induction parameters of rifampicin for OATP1B and CYP2C8 were obtained by fitting to clinical DDI the data of probe substrates for OATP1B (pravastatin) and CYP2C8 (pioglitazone), respectively. Thereafter, our unified PBPK model of rifampicin was verified by predicting complex interactions with glibenclamide, repaglinide, and CP‐I with various dosing regimens of rifampicin. By the mutual verification processes proposed previously,25, 26 the performance of our expanded PBPK model was evaluated.
Methods
Structures and parameters of PBPK models
All nomenclature and differential equations are shown in the Supplementary Text . The structures and pharmacokinetic parameters of the PBPK models developed for rifampicin,5 pravastatin,27 glibenclamide,5 repaglinide,28 and CP‐I29 were based on previous reports and are summarized in Figure 1 and Table 1. The PBPK model of pioglitazone was constructed according to the previous report (Figure 1 and Table 1).27 Physiological parameters are shown in Table S1 .
Figure 1.

Structures of physiologically‐based pharmacokinetic (PBPK) models of rifampicin (RIF) (a), pioglitazone (PIO) (b), pravastatin (PRV) (c), repaglinide (RPG) (c), coproporphyrin I (CP‐I) (c), and glibenclamide (GLB) (d). CL int,bile, intrinsic clearance of biliary excretion; CL int,E, intrinsic clearance of enterocyte metabolism; CL int,met, intrinsic clearance of hepatic metabolism; CL renal, renal clearance; EHC, enterohepatic circulation; F a, fraction of dose absorbed from gut lumen; f B, unbound fraction in blood; f E, unbound fraction in enterocytes; F g, fraction available after intestinal metabolism; f H, unbound fraction in hepatocytes; HC, hepatocytes; HE, hepatic extracellular space; IV, intravenous infusion; k a, absorption rate constant; k bile, transit rate constant in EHC; k in, k a in segregated flow model; PO, oral; PS act,inf, active uptake intrinsic clearance on sinusoidal membrane; PS dif,E, intrinsic clearance by passive diffusion on basolateral membrane of enterocytes; PS dif,eff, efflux intrinsic clearance by passive diffusion on sinusoidal membrane; PS dif,inf, influx intrinsic clearance by passive diffusion on sinusoidal membrane; Q tissue, blood flow rate in tissue (muscle, skin, adipose, hepatic, hepatic arterial, serosa, and villous); T lag, lag time in intestinal absorption. The excretion rate constant from gut lumen to feces is represented by k a(1/F a − 1) or k a(1/F a F g − 1). For CP‐I model, biosynthesis of CP‐I is incorporated in HC. The number of 1–5 in HE, HC, or liver represents each compartment of 5‐liver model.
Table 1.
Summary of fixed or initial parameters for rifampicin, pioglitazone, pravastatin, glibenclamide, repaglinide, and coproporphyrin I
| Parameter | Rifampicin | Pioglitazone | Pravastatin | Glibenclamide | Repaglinide | Coproporphyrin I |
|---|---|---|---|---|---|---|
| T lag (hour) | 0.255 | 0a , b | 0.408a | 0.773 | 0.21a | — |
| k in or k a (/hour) | 4.0 | 1.46a , b | 0.510a | 0.445 | 4.0a | 3.0 |
| F a F g | 0.943 | 0.854 | 0.5 | 0.849 | 1 | 0.318/0.309/0.256 |
| f B | 0.0778 | 0.03c | 0.99 | 0.000774 | 0.0109 | 0.0105 |
| SFKp | 6.65 | 1a | 1a | 0.57 | 1a | 1 |
| K p,liver | — | 0.324d | — | — | — | — |
| K p,muscle | 0.0947 | 0.162d | 0.409 | 0.104 | 0.112 | 0.103 |
| K p,skin | 0.326 | 0.585d | 0.716 | 0.447 | 0.479 | 0.442 |
| K p,adipose | 0.0629 | 0.818d | 0.185 | 0.0795 | 0.149 | 0.079 |
| K p,serosa | 0.200 | — | — | — | — | — |
| f BCLint,all or f BCLint,met (L/hour/kg) | 0.251 | 0.0419a , e | 1.15a | 0.123 | 1.03a | 0.453/0.402/0.369 |
| f H | 0.0814 | — | 0.496 | 0.0221 | 0.0123 | 0.0697 |
| R dif | 0.129 | — | 0.0266 | 0.246 | 0.392 | 0.035 |
| β | 0.2 | — | 0.2/0.5/0.8 | 0.2/0.5/0.8 | 0.2/0.5/0.8 | 0.2/0.5/0.8 |
| γ | 0.778 | — | 0.242 | 0.24 | 0.578 | 0.020 |
| f bile | — | — | 0.984 | — | 0.21 | 0.84 |
| k bile (/hour) | — | — | 0.774a | — | 1.39 | 5.2 |
| f m in liver | 0.759 (UGT) |
0.836 (CYP2C8)f
0.164 (CYP3A)f |
— |
0.85–1 (CYP2C9) 0–0.15 (CYP3A) |
0.805 (CYP2C8)f
0.195 (CYP3A)f |
— |
| CLrenal (L/hour/kg) | 0.011 | 0g | 0.614 | 0 | 0 | 0.0421 |
Physiologically‐based pharmacokinetic model parameters of rifampicin,5 pravastatin,27 glibenclamide,5 repaglinide,28 and coproporphyrin I29 were mostly adapted from the previous reports. Several parameters were also used. Rifampicin parameters: F a (1), F g (0.943), K m,u for hepatic uptake (0.177 μM), Emax for UGT autoinduction (1.34), Emax for CYP3A (4.57), Emax for CYP2C9 (2.41), EC50,u (0.0639 μM), f E (0.115), PSdif,E (0.14 L/hour/kg), and f m via UGT pathway in enterocytes (0.759). Pioglitazone parameters: F a F g value was calculated from reported bioavailability (0.83).42 Glibenclamide parameters: F a (1), F g (0.849), f ECLint,E (0.0131 L/hour/kg), clearance permeability in enterocytes (0.103 L/hour/kg), and f m via CYP3A pathway in enterocytes (1). For coproporphyrin I, its biosynthesis in the liver was considered according to the previous report.29
β = (CLint,met + CLint,bile)/(PSdif,eff + CLint,met+CLint,bile); CLint,all, overall hepatic intrinsic clearance; CLint,bile, intrinsic clearance of biliary excretion; CLint,E, intrinsic clearance in enterocyte metabolism; CLint,met, intrinsic clearance of hepatic metabolism; CLrenal, renal clearance; CYP, cytochrome P450; EC50,u, unbound concentration for half maximum induction effect; Emax, maximum induction effect; F a, fraction of dose absorbed from gut lumen; F a F g, intestinal availability; F g, fraction available after intestinal metabolism; f B, unbound fraction in blood; f bile = CLint,bile/(CLint,bile+CLint,met); f E, unbound fraction in enterocytes; f H, unbound fraction in hepatocytes; f P, unbound fraction in plasma; f m, fractional metabolism to CLint,met: γ = PSdif,inf/PSdif,eff; k a, absorption rate constant; k bile, transit rate constant in enterohepatic circulation; k in, k a in segregated flow model; K m,u, unbound Michaelis‐Menten constant; K p, tissue/blood concentration ratio; PSact,inf, active uptake intrinsic clearance on sinusoidal membrane; PSdif,inf, influx intrinsic clearance by passive diffusion on sinusoidal membrane; PSdif,E, intrinsic clearance by passive diffusion on basolateral membrane of enterocytes; PSdif,eff, efflux intrinsic clearance by passive diffusion on sinusoidal membrane; RB, blood‐to‐plasma concentration ratio; Rdif = PSdif,inf/PSact,inf; SFKp, common scaling factor to in silico K p values in each tissue; T lag, lag time in intestinal absorption.
aInitial value for optimization. bDetermined by compartmental analysis. cCalculated as f B = f P/RB using f P (0.03)42 and R B (1). dCalculated based on in silico methodology. eCalculated based on a five‐liver model. fDetermined as shown in Supplementary Text . gUrinary excretion was not detected.42
All PBPK models included the compartments for muscle, skin, and adipose and liver, which were divided into five compartments sequentially connected by hepatic blood flow (five‐liver model) to mimic the dispersion model.30 Absorption was described by a segregated flow model for rifampicin and a first‐order model for other drugs.31 For the intestinal metabolism of glibenclamide, a Q gut model was used with the consideration of CYP3A‐mediated intestinal DDI ( Supplementary Text ).32 Enterohepatic circulation was included for pravastatin, repaglinide, and CP‐I by incorporating three transit compartments between compartments for the hepatocytes and the gut lumen. For CP‐I, its biosynthesis was incorporated in the liver. For the OATP1B substrates, the hepatic uptake process was represented by subdividing each liver compartment into extrahepatic and hepatocellular compartments. In this case, the overall hepatic intrinsic clearance (CLint,all) and β are described using Eqs. (1) and (2), respectively, according to the extended clearance concept.30
| (1) |
| (2) |
CLint,all and the four hybrid parameters of R dif (= influx intrinsic clearance by passive diffusion on sinusoidal membrane (PSdif,inf)/active uptake intrinsic clearance on sinusoidal membrane (PSact,inf)), β, γ (= PSdif,inf/efflux intrinsic clearance by passive diffusion on sinusoidal membrane (PSdif,eff)), and f bile (= intrinsic clearance of biliary excretion (CLint,bile)/(intrinsic clearance of hepatic metabolism (CLint,met) + CLint,bile)) were employed in calculating the values of each intrinsic clearance (PSact,inf, PSdif,inf, PSdif,eff, CLint,met, and CLint,bile). The β value ranging from 0–1 can be informative when evaluating the rate‐limiting steps of CLint,all. When the sum of CLint,met and CLint,bile is much greater than PSdif,eff (β close to 1), CLint,all can be approximated as the hepatic uptake being the rate‐limiting step of CLint,all (PSinf). In contrast, when the sum of CLint,met and CLint,bile is negligible when compared with PSdif,eff (low β), CLint,all can be approximated as PSinf × (CLint,met + CLint,bile)/PSdif,eff (not only hepatic uptake but also metabolism and biliary excretion being the rate‐limiting steps of CLint,all). Because it is difficult to accurately determine the β value experimentally, sensitivity analyses were performed using the β values representing the following three different cases for pravastatin, glibenclamide, repaglinide, and CP‐I: small (0.2), moderate (0.5), and large (0.8).
Optimization of induction parameters of rifampicin for OATP1B and CYP2C8
For all analyses, Numeric Analysis Program for Pharmacokinetics (version 2.31) was used.33 The model codes used in this study are shown in Supplementary Model Code . Nonlinear least‐squares fitting was conducted with the weight for the optimization set as the square root of the value to deal with a wide range of blood concentrations of drugs. Dosing regimens were matched to the published study designs.
Stepwise optimization was applied to estimate the induction parameter of rifampicin for OATP1B, similar to our previous report.5 Briefly, pravastatin parameters (absorption rate constant, lag time in intestinal absorption, common scaling factor to in silico tissue/blood concentration ratio values in each tissue, transit rate constant in enterohepatic circulation, and f BCLint,all (= unbound fraction in blood (fB) × CLint,all)) were first estimated using the blood pravastatin concentration–time profile after a single oral dose of pravastatin (i.e., control condition).6 Thereafter, simultaneous optimization for the maximum induction effect (Emax) of rifampicin for OATP1B was conducted using four blood pravastatin profiles after repeated oral dosing of rifampicin (2–600 mg, once daily for 10 days; i.e., DDI condition).6 In the clinical study, pravastatin was administered 12 hours after the last dose of the repeated rifampicin dosing, and the inhibitory effects of rifampicin for the OATP1B‐mediated uptake and MRP2‐mediated biliary excretion of pravastatin were incorporated using the reported unbound inhibition constant (K i,u) values of rifampicin for OATP1B (0.19 μM)27 and MRP2 (0.87 μM).29 In the simultaneous optimization, rifampicin and pravastatin parameters except for rifampicin Emax were fixed as shown in Table 1 and Table S2 . The unbound concentration for the half maximum induction effect (EC50,u) of rifampicin for OATP1B was set to be equal to that for CYP3A (0.0639 μM),5 assuming that pregnane X receptor is involved as a key mediator for the induction of both OATP1B and CYP3A (i.e., EC50,u values reflecting the binding affinity of rifampicin to the pregnane X receptor may be similar for OATP1B and CYP3A).6 The Emax value of rifampicin for CYP2C8 was estimated via similar stepwise optimization using the blood pioglitazone concentration‐time profiles before and after rifampicin treatment.16
The induction process of rifampicin for OATP1B and CYP2C8 was described using a turnover model ( Supplementary Text ).34 For OATP1B induction and inhibition by rifampicin, the changes in PSact,inf of pravastatin were described by Eq. (3).
| (3) |
PSact,inf,DDI and PSact,inf,control represent the PSact,inf under rifampicin treatment and the control condition, respectively. The unbound fraction of rifampicin in blood, the concentration of rifampicin in the extrahepatic space, and the fractional OATP1B‐mediated uptake to the overall active uptake are represented by f B,RIF, [C]HE,RIF, and f OATP1B, respectively. The fOATP1B value of pravastatin was assumed to be unity. The Eratio represents the ratio of the enzyme amount under rifampicin treatment to the control condition.
For MRP2 inhibition by rifampicin, the changes in CLint,bile of pravastatin were modeled by Eq. (4): where f H,RIF and [C]H,RIF represent the unbound fraction and concentrations of rifampicin in hepatocytes, respectively.
| (4) |
For CYP2C8 induction by rifampicin, the changes in CLint,met of pioglitazone were described by Eq. (5). CLint,met,DDI and CLint,met,control represent the CLint ,met under rifampicin treatment and the control condition, respectively. The f m,CYP2C8 and f m,CYP3A represent fractional CYP2C8‐mediated and CYP3A‐mediated metabolism to CLint,met,control.
| (5) |
Prediction of relative activities of transporters and CYP isoforms during rifampicin treatment and complex interactions with victim drugs or endogenous biomarker
During repeated oral dosing of 600 mg rifampicin, the relative activities of OATP1B, MRP2, CYP3A, CYP2C8, and CYP2C9 were predicted using all the rifampicin parameters.
To verify the PBPK model of rifampicin, the following four different cases of DDIs with the victims were predicted: (i) pravastatin (a substrate of OATP1B/MRP2), (ii) glibenclamide (a substrate of OATP1B/CYP2C9/CYP3A), (iii) repaglinide (a substrate of OATP1B/CYP2C8/CYP3A), and (iv) CP‐I (a substrate of OATP1B/MRP2). The predicted results were expressed as the AUCR and concentration‐time profiles for the victims following the prediction in the presence and absence of rifampicin coadministration and then compared with the observed corresponding values (mean ± standard deviation) unless noted otherwise. As acceptance criteria, a twofold predictive measure and the geometric mean fold error (GMFE; Eq. (6)) were used.
| (6) |
The contribution of individual DDI components of rifampicin to the predicted interactions was also investigated.
To accurately capture the OATP1B inhibition effect by rifampicin, in vivo inhibition constant (K i) values were used for OATP1B‐mediated uptake of pravastatin (0.19 μM)27 and CP‐I (~0.1 μM).29 In addition, the in vivo K i values of rifampicin for OATP1B‐mediated uptake of glibenclamide (0.13 μM (= 0.44 × 0.19/0.65)) and repaglinide (0.17 μM (= 0.60 × 0.19/0.65)) were calculated considering substrate‐dependent differences according to the recent report.29 Specifically, the in vitro K i values for the uptake of glibenclamide (0.44 μM)35 and repaglinide (0.60 μM)35 were corrected with the in vivo K i (0.19 μM)27 and in vitro K i (0.65 μM)35 values for that of pravastatin (used as a reference compound). The changes in PSact,inf of the OATP1B substrates were modeled by Eq. (3) and their f OATP1B values were set to be unity. The changes in CLint,bile of CP‐I and CLint,met of glibenclamide and repaglinide were modeled by Eqs. (4) and (5), respectively. Regarding CLint,met of glibenclamide, the f m and E ratio values for CYP2C8 were replaced to the corresponding values for CYP2C9.
Results
Optimization of induction parameters of rifampicin for OATP1B and CYP2C8
Several parameters of pravastatin and pioglitazone were first estimated using the respective observed blood concentration‐time profiles under the control condition (Table S2 ). Subsequently, the Emax values of rifampicin were estimated to be 2.3 for OATP1B and 2.55 for CYP2C8 using the observed blood profiles of pravastatin and pioglitazone after the repeated oral dosing of rifampicin (Figure 2 a,b and Table S2 ).6, 16
Figure 2.
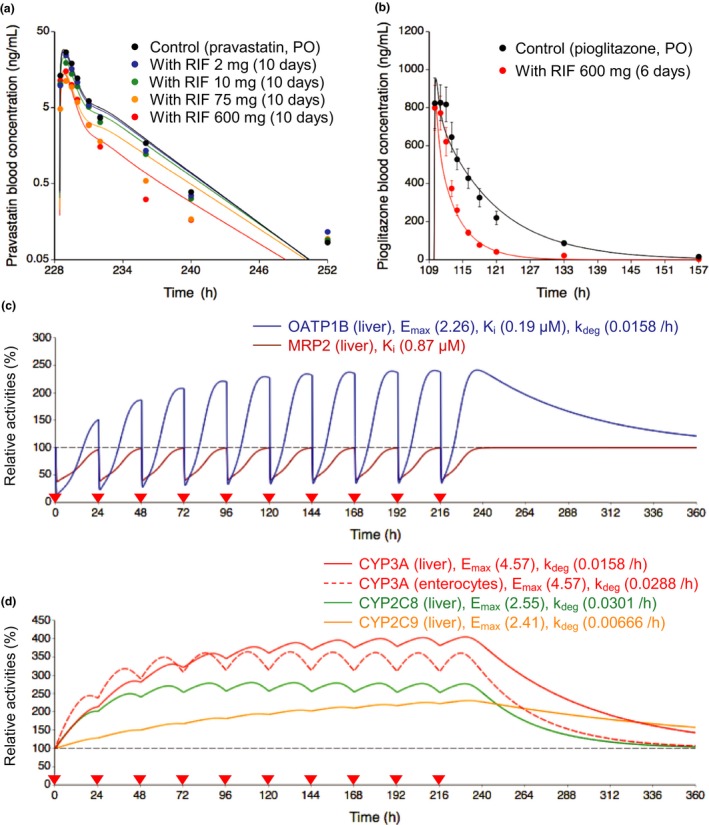
Optimized and observed blood concentration‐time profiles of pravastatin and pioglitazone before and after repeated oral dosing of rifampicin and relative activities of OATP1B, MRP2, and CYP isoforms in the liver or intestine during rifampicin treatment. (a,b) Solid lines and closed circles represent optimized and observed blood concentration‐time profiles, respectively. (a) Blood pravastatin profiles after a single oral dose of 20 mg pravastatin before (black) and after repeated oral dosing of 2 mg (blue), 10 mg (green), 75 mg (orange), and 600 mg (red) rifampicin once daily for 10 days.6 (b) Blood pioglitazone profiles after a single oral dose of 30 mg pioglitazone before (black) and after (red) repeated oral dosing of 600 mg rifampicin once daily for 6 days.16 Observed blood concentrations were shown as mean ± SD. (c,d) Solid lines represent predicted time profiles of the relative activities of OATP1B (blue), MRP2 (brown), CYP3A (red), CYP2C8 (green), and CYP2C9 (orange) in the first liver compartment during repeated oral dosing of 600 mg rifampicin. The OATP1B activities were predicted considering both induction and inhibition effects of rifampicin. The MRP2 activities were predicted considering inhibition effect of rifampicin. The CYP activities were predicted considering induction effects of rifampicin. The red dashed line represents predicted time profiles of the relative activities of CYP3A in the enterocyte compartment. The values of Emax, K i, and k deg for each transporter and CYP isoform are indicated on the figures. Black dashed horizontal line represents unity. The red closed inverted triangles represent the timing of rifampicin dosing. CYP, cytochrome P450; Emax, maximum induction effect; k deg, degradation rate constant; K i, inhibition constant; MRP2, multidrug resistance protein 2; OATP1B, organic anion transporting polypeptide 1B; PO, oral dose; RIF, rifampicin.
Prediction of relative activities of transporters and CYP isoforms during rifampicin treatment
Using the parameters of rifampicin for OATP1B/CYP3A/CYP2C8/CYP2C9 induction and OATP1B/MRP2 inhibition, the relative activity profiles of the transporters and CYP isoforms were predicted during repeated oral dosing of 600 mg rifampicin (Figure 2 c,d). The OATP1B activities were affected by both induction and inhibition effects of rifampicin. At steady state following the repeated dosing of rifampicin, the OATP1B activities increased to 240%. On the administration of the next rifampicin dose, the OATP1B activities decreased to 34% before they increased to 180% at 12 hours postdosing. In the absence of an induction effect, a single dose of 600 mg rifampicin decreased the OATP1B activities to 14% at the trough and 68% at 12 hours postdosing because of the inhibition of OATP1B. The MRP2 activities decreased to 40% at the trough and to 75% at 12 hours postdosing when considering the inhibition effects. The relative increase was greater for the activity of hepatic CYP3A (400%) than those of CYP2C8 (270%) and CYP2C9 (230%).
Prediction of complex interactions with victim drugs or endogenous biomarker
Case 1: pravastatin
The clinical DDI data were from two independent reports that investigated the impact of a single rifampicin dose (600 mg) on the pharmacokinetics of pravastatin (20 mg or 33 μg)9, 10 As shown in Figure 3 a,b, the PBPK model incorporated the components for induction of OATP1B and the inhibition of OATP1B/MRP2 by rifampicin, and the predicted AUCRs of pravastatin were within twofold of the observed AUCRs.9, 10 In addition, the estimated AUCRs of pravastatin after the repeated oral dosing of 2, 10, 75, and 600 mg rifampicin decreased in a rifampicin dose‐dependent manner and are mostly similar to the observed AUCRs (Figure 3 c).6 Overall, our PBPK model of rifampicin reasonably captured the observed AUCRs and blood profiles of pravastatin regardless of the β values (in all cases satisfying within twofold criteria and GMFE of 1.22–1.24; Figure S1 and Table S3 ).
Figure 3.

Predicted, optimized, and observed AUC ratios of pravastatin with various dosing regimens of rifampicin. (a) Illustration of the hepatic disposition of pravastatin. The physiologically‐based pharmacokinetic models incorporated the induction of OATP1B (red arrow) and the inhibition of OATP1B and MRP2 (blue lines) by rifampicin. The values of pravastatin parameters are extracted or calculated from Table 1 and Table S2 . The ratios of each intrinsic clearance (PS act,inf, PS dif,inf, PS dif,eff, and CL int,met+bile) are indicated in the figure. (b and c) Predicted, optimized, and observed AUCRs of pravastatin under rifampicin treatment (dosing regimens of rifampicin and pravastatin are indicated at the bottom). The closed circles represent the observed AUCRs of pravastatin shown as mean ± standard deviation (b)9, 10 or mean (90% confidence interval) (c).6 Predictions or optimizations were performed using three β values and the results are shown in either closed or open symbols of different shapes (squares, diamonds, and triangles for the β values of 0.2, 0.5, and 0.8, respectively). (b) both boxes: pravastatin was orally dosed simultaneously with a single oral dose of rifampicin. (c) all boxes: pravastatin was dosed 12 hours after the last dose of repeated oral dosing of 2, 10, 75, and 600 mg rifampicin once daily for 10 days. The optimized AUCRs were calculated from Figure 2 a. AUCR, area under the plasma concentration‐time curve ratio; CLint,all, overall hepatic intrinsic clearance; CLint,met+bile, sum of intrinsic clearance of hepatic metabolism (CLint,met) and biliary excretion (CLint,bile); CLrenal, renal clearance; F a, fraction of dose absorbed from gut lumen; fB, unbound fraction in blood; fbile = CLint,bile/(CLint,bile+CLint,met); F g, fraction available after intestinal metabolism; MRP2, multidrug resistance protein 2; OATP1B, organic anion transporting polypeptide 1B; PRV, pravastatin; PO, oral dose; PSact,inf, active uptake intrinsic clearance on sinusoidal membrane; PSdif,eff, efflux intrinsic clearance by passive diffusion on sinusoidal membrane; PSdif,inf, influx intrinsic clearance by passive diffusion on sinusoidal membrane; RIF, rifampicin.
Case 2: glibenclamide
The clinical DDI data were from the report that investigated the impact of single or repeated dosing of rifampicin on the pharmacokinetics of glibenclamide.19 Our PBPK model incorporated the components for induction of OATP1B/CYP2C9/CYP3A and the inhibition of OATP1B by rifampicin (Figure 4 a,b, filled symbols). Following the coadministration of oral glibenclamide and a single intravenous dose of 600 mg rifampicin, the predicted AUCRs (2.35–2.54) of glibenclamide were in agreement with the observed AUCR (2.18 ± 1.09) regardless of the β values of glibenclamide (Figure 4 b, left box, filled symbols).19 In the case in which oral rifampicin (600 mg) was administered once daily for 6 days followed by an oral dose of glibenclamide in the presence of a single intravenous dose of 600 mg rifampicin on day 7, the predicted AUCRs of glibenclamide were 0.70, 0.91, and 1.10 with the β values of 0.2, 0.5, and 0.8, respectively, compared with the observed AUCR of 0.72 ± 0.32 (Figure 4 b, middle box, filled symbols).19 Administering 600 mg rifampicin for 7 days followed by an oral dose of glibenclamide on day 9 (48 hours after the last rifampicin dosing), the predicted AUCRs of glibenclamide were 0.28, 0.36, and 0.44 with the β values of 0.2, 0.5, and 0.8, respectively, compared with the observed AUCR of 0.35 ± 0.19 (Figure 4 b, right box, filled symbols).19 In all three dosing regimens, all predicted AUCRs were within twofold of the observed AUCR, and the lower β value (0.2 and 0.5) of glibenclamide gave the higher prediction accuracy (GMFE 1.12 and 1.14, respectively) compared with the β value of 0.8 (GMFE 1.31; Table S3 ). In addition, the prediction accuracy of DDI was greatly reduced when the component for OATP1B induction was omitted (Figure 4 b, orange‐colored symbols, table in the inset).
Figure 4.

Predicted and observed AUC ratios of glibenclamide with various dosing regimens of rifampicin. (a) Illustration of the hepatic disposition of glibenclamide. The physiologically‐based pharmacokinetic (PBPK) models incorporated the induction of OATP1B, CYP2C9, and CYP3A (red arrows) and the inhibition of OATP1B (blue line) by rifampicin. The values of glibenclamide parameters are extracted or calculated from Table 1. The ratios of each intrinsic clearance (PS act,inf, PS dif,inf, PS dif,eff, and CL int,met+bile) are indicated in the figure. (b) Observed and predicted AUCRs of glibenclamide under rifampicin treatment (dosing regimens of rifampicin and glibenclamide are indicated at the bottom). The observed AUCRs of glibenclamide are shown as mean ± standard deviation (closed circles).19 Predictions were performed using three β values, and the results are shown in either open or closed symbols of different shapes (squares, diamonds, and triangles for the β values of 0.2, 0.5, and 0.8, respectively). The closed black squares, diamonds, and triangles represent predicted AUCRs by incorporating OATP1B/CYP2C9/CYP3A induction and OATP1B inhibition effects of rifampicin. The prediction results were also obtained using the PBPK models that omitted a single component (detailed in the inset table; shown in different colors). Left box: glibenclamide was orally dosed with a single intravenous dose of 600 mg rifampicin. Middle box: after repeated oral dosing of 600 mg rifampicin once daily for 6 days, glibenclamide was orally dosed with a single intravenous dose of 600 mg rifampicin on day 7. Right box: glibenclamide was orally dosed 48 hours after the last dose of repeated dosing of 600 mg rifampicin once daily for 7 days. AUCR, area under the plasma concentration‐time curve ratio; CLint,all, overall hepatic intrinsic clearance; CLint,met, intrinsic clearance of hepatic metabolism; CLrenal, renal clearance; CYP, cytochrome P450; F a, fraction of dose absorbed from gut lumen; fB, unbound fraction in blood; F g, fraction available after intestinal metabolism; fm, fractional metabolism to CLint,met: GLB, glibenclamide; IV, intravenous infusion dose; OATP1B, organic anion transporting polypeptide 1B; PO, oral dose; PSact,inf, active uptake intrinsic clearance on sinusoidal membrane; PSdif,eff, efflux intrinsic clearance by passive diffusion on sinusoidal membrane; PSdif,inf, influx intrinsic clearance by passive diffusion on sinusoidal membrane; RIF, rifampicin.
Case 3: repaglinide
The clinical DDI data were from the reports that investigated the impact of single or repeated dosing of rifampicin on the pharmacokinetics of repaglinide.20, 21, 22, 23, 24 Our PBPK model incorporated the components for induction of OATP1B/CYP2C8/CYP3A and inhibition of OATP1B by rifampicin (Figure 5 a,b, filled symbols). The parameters of repaglinide were first estimated using the blood repaglinide concentration‐time profiles under control condition (Table S2 ). When repaglinide was orally administered simultaneously with a single oral dose of 600 mg rifampicin, the predicted AUCRs (2.35–2.54) of repaglinide were within twofold of the observed AUCRs (1.92 ± 1.09 and 2.60 ± 1.49)20, 21 regardless of the β values of repaglinide (Figure 5 b, left two boxes, filled symbols). In the case of repeated oral dosing of 600 mg rifampicin followed by an oral repaglinide dose simultaneously or 1–24 hours after the last rifampicin dose, the predicted AUCRs of repaglinide are shown in Figure 5 b (right four boxes, filled symbols). In all six dosing regimens, the prediction accuracy of AUCRs was best with the β value of 0.5 (67%, 100%, and 67% cases satisfying within twofold criteria and GMFEs of 1.50, 1.41, and 1.50 for the β values of 0.2, 0.5, and 0.8, respectively; Figure S2 and Table S3 ). In the cases of repeated rifampicin dosing, the prediction accuracy of DDIs was greatly reduced when the component for OATP1B induction was omitted (Figure 5 b, orange‐colored symbols, table in the inset).
Figure 5.

Predicted and observed AUC ratios of repaglinide with various dosing regimens of rifampicin. (a) Illustration of the hepatic disposition of repaglinide. The physiologically‐based pharmacokinetic (PBPK) models incorporated the induction of OATP1B, CYP2C8, and CYP3A (red arrows) and the inhibition of OATP1B (blue line) by rifampicin. The values of repaglinide parameters are extracted or calculated from Table 1 and Table S2 . The ratios of each intrinsic clearance (PS act,inf, PS dif,inf, PS dif,eff, and CL int,met+bile) are indicated in the figure. (b) Observed and predicted AUCRs of repaglinide under rifampicin treatment (dosing regimens of rifampicin and repaglinide are indicated at the bottom). The observed AUCRs of repaglinide are shown in closed circles (mean ± standard deviation or mean (90% confidence interval, fourth box from the left). Predictions were performed using three β values, and the results are shown in either open or closed symbols of different shapes (squares, diamonds, and triangles for the β values of 0.2, 0.5, and 0.8, respectively). The prediction results were also obtained using the PBPK models that omitted a single component (detailed in the inset table; shown in different colors). First and second boxes: repaglinide was orally dosed with a single oral dose of 600 mg rifampicin.20, 21 Third, fourth, fifth, and sixth boxes: repaglinide was orally dosed simultaneously or 1–24 hours after the last dose of repeated oral dosing of 600 mg rifampicin once daily for 5 or 7 days.22, 23, 24 AUCR, area under the plasma concentration‐time curve ratio ratio; CLint,all, overall hepatic intrinsic clearance; CLint,met+bile, sum of intrinsic clearance of hepatic metabolism (CLint,met) and biliary excretion (CLint,bile); CLrenal, renal clearance; CYP, cytochrome P450; F a F g, intestinal availability; fB, unbound fraction in blood; fbile = CLint,bile/(CLint,bile+CLint,met); fm, fractional metabolism to CLint,met: OATP1B, organic anion transporting polypeptide 1B; PO, oral dose; PSact,inf, active uptake intrinsic clearance on sinusoidal membrane; PSdif,eff, efflux intrinsic clearance by passive diffusion on sinusoidal membrane; PSdif,inf, influx intrinsic clearance by passive diffusion on sinusoidal membrane; RIF, rifampicin; RPG, repaglinide.
Case 4: CP‐I
Three recent reports provided the clinical data on the blood CP‐I concentration‐time profiles impacted by single or repeated oral dosing of rifampicin.12, 13, 14 Our PBPK model incorporated the components for induction of OATP1B and inhibition of OATP1B/MRP2 by rifampicin (Figure 6 a). The predicted blood profiles after a single oral dose of 300 and 600 mg rifampicin reasonably captured the observed profiles by Takehara et al.12 regardless of the β values of CP‐I (Figure 6 b). Our PBPK model and the obtained parameters from the analysis of Takehara et al. were used to predict blood profiles of CP‐I from the other two reports.13, 14 The predicted profiles of CP‐I after a single oral dose of 600 mg rifampicin displayed a slight underestimation of the observed profiles by Lai et al.13 (Figure 6 c). When compared with the other two reports,12, 13 the observed profiles by Kunze et al.14 displayed an apparent delay for blood CP‐I levels to increase following single or repeated oral dosing of 600 mg rifampicin, and this delay was not well captured by our PBPK model and the obtained parameters from the analysis of Takehara et al.12 (Figure 6 d). The differing blood profiles of CP‐I between the single and repeated oral dosing of rifampicin were better captured by incorporating the component for OATP1B induction than by omitting it (Figure 6 d, solid lines vs. dotted lines). In all five dosing regimens, our PBPK model of rifampicin overall captured the blood profiles and AUCRs of CP‐I regardless of the β values (in all cases satisfying within twofold criteria and GMFE of 1.28; Table S3 ).
Figure 6.
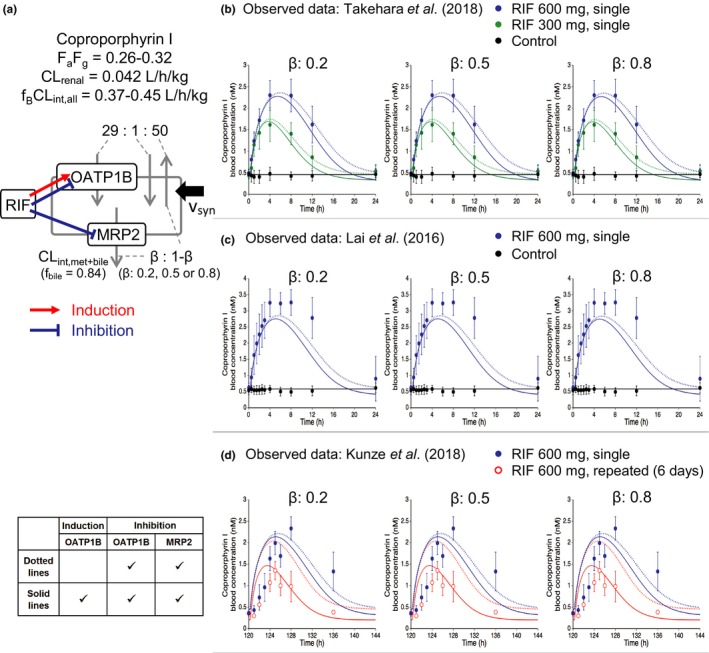
Predicted and observed blood concentration‐time profiles of coproporphyrin I (CP‐I) with various dosing regimens of rifampicin. (a) Illustration of the hepatic disposition of CP‐I. The physiologically‐based pharmacokinetic models incorporated the induction of OATP1B (red arrow) and the inhibition of OATP1B and MRP2 (blue lines) by rifampicin. The values of CP‐I parameters are extracted or calculated from Table 1. The ratios of each intrinsic clearance (PS act,inf, PS dif,inf, PS dif,eff, and CL int,met+bile) are indicated in the figure. (b–d) The symbols represent the observed blood CP‐I concentrations (mean ± standard deviation). The solid lines represent predicted blood CP‐I profiles with the β values of 0.2, 0.5, and 0.8 by incorporating OATP1B induction and OATP1B/MRP2 inhibition effects of rifampicin. The dotted lines represent the predicted results from the model omitting OATP1B induction (detailed in the inset table). (b) CP‐I profiles without (black) or with a single oral dose of 300 mg (green) or 600 mg (blue) rifampicin.12 (c) CP‐I profiles without (black) or with a single oral dose of 600 mg rifampicin (blue).13 (d) CP‐I profiles with a single oral dose of 600 mg rifampicin (blue) or repeated oral doses of 600 mg rifampicin once daily for 6 days (red).14 The predose concentration of CP‐I was set to be 0.49 nM (b), 0.58 nM (c), and 0.45 nM (d). CLint,all, overall hepatic intrinsic clearance; CLint,met+bile, sum of intrinsic clearance of hepatic metabolism (CLint,met) and biliary excretion (CLint,bile); CLrenal, renal clearance; F a F g, intestinal availability; fB, unbound fraction in blood; fbile = CLint,bile/(CLint,bile+CLint,met); MRP2, multidrug resistance protein 2; OATP1B, organic anion transporting polypeptide 1B; PSact,inf, active uptake intrinsic clearance on sinusoidal membrane; PSdif,eff, efflux intrinsic clearance by passive diffusion on sinusoidal membrane; PSdif,inf, influx intrinsic clearance by passive diffusion on sinusoidal membrane; RIF, rifampicin.
Discussion
With our growing understanding that rifampicin can cause DDIs via multiple molecular mechanisms, it is imperative to incorporate such complexity in the PBPK modeling of rifampicin and accurately predict the risk for DDIs. In this study, we incorporated the OATP1B/CYP2C8 induction and MRP2 inhibition effects of rifampicin into our previous PBPK model, which included CYP3A/CYP2C9 induction and OATP1B inhibition. Our unified PBPK model of rifampicin was then verified by predicting complex interactions with glibenclamide, repaglinide, and CP‐I.
Taking the dosing schedule into consideration, the impact of multiple rifampicin dosing on the systemic exposure of pravastatin could be explained by the net effect of induction and inhibition on hepatic uptake (OATP1B; Figure 2 a). From the data analysis of single rifampicin dosing, the effect of OATP1B inhibition can be distinguished from the net effect. The Emax value for OATP1B can be reliably estimated by using blood pravastatin profiles, where pravastatin was given 12 hours after the repeated oral dosing of rifampicin (2–600 mg). The simultaneous optimization for the set of pravastatin profiles can provide confidence for the obtained Emax value compared to optimization for limited data.
Our PBPK model predicted the oscillation of the OATP1B activities during multiple rifampicin doses (Figure 2 c). The predicted oscillation will be supported by a positron emission tomography imaging study, which allows the direct determination of hepatic uptake clearance, or by a pharmacokinetic study with a changing dosing interval. Similarly, it would be also important to validate the degradation rate constant of OATP1B, which was assumed to be equal to that of CYP3A (0.0158/hour) in this study. Varying the degradation rate constant value of OATP1B within a twofold range did not affect the estimated Emax value significantly (0.96‐fold to 1.16‐fold).
The effects of multiple rifampicin dosing on CYP isoforms were initially assessed using the probe substrates that unlikely rely on OATP1B for their hepatic uptake. Our PBPK model successfully accounted for the multiple dose effects of rifampicin on CYP3A and CYP2C9 previously5 and CYP2C8 in this study (Figure 2 b). Reliability of the optimized parameter for CYP2C8 induction was supported by the similar extent of changes for CYP2C8 activities (2.7‐fold increase) estimated using pioglitazone as a victim drug and for hepatic intrinsic clearance of rosiglitazone (2.1‐fold and 2.8‐fold increase), another CYP2C8 probe (Table S4 ).
By integrating the inhibition of OATP1B and induction for OATP1B/CYP3A/CYP2C9/CYP2C8, the PBPK model of rifampicin was versatile in quantitatively predicting the magnitude of DDIs with varying dosing schedules and intervals between OATP1B substrates (glibenclamide and repaglinide) and rifampicin. The prediction accuracy with the β values of 0.2–0.5 of glibenclamide and repaglinide was higher than that of 0.8, suggesting that the CYP‐mediated metabolism significantly contributes to the intrinsic hepatic clearance (Figures 4 b and 5 b, Table S3 ). Our analysis using the rifampicin PBPK model provides mechanistic insights into the complex interplay between in vivo induction and inhibition and their impact on DDI magnitudes, particularly when the effect of rifampicin on OATP1B expression remains uncertain in vitro because of experimental variability and an inability to capture dynamic changes with increasing rifampicin concentrations.36, 37, 38
In addressing the OATP1B‐mediated and CYP‐mediated DDIs, the β value of a victim drug is a key parameter. However, it remains challenging to estimate the β value using DDI data with a single rifampicin dose.27 Indeed, all three β values could account for the DDIs between rifampicin (single dose) and pravastatin (Figure 3 b), glibenclamide (Figure 4 b, left box), or repaglinide (Figure 5 b, left two boxes). We recommend using small β values for conservative predictions until the repeated dose effects of rifampicin or other inducers on the victims and reference probes are available for PBPK model analysis as illustrated for repaglinide and glibenclamide (Figures 4 b and 5 b).
For the interactions between CP‐I and rifampicin, the predicted blood profiles of CP‐I were overall close to the observed data (Figure 6 b–d). Notably, the predicted CP‐I profiles after repeated rifampicin dosing were in good agreement with the observed ones when incorporating the OATP1B induction effect of rifampicin (Figure 6 d). However, further investigations may be necessary to account for the delayed changes in the observed CP‐I profiles and slight discrepancies from the predicted and observed CP‐I profiles (Figure 6 c,d). The β values had a minimal impact on the prediction accuracy of CP‐I profiles, and possible reasons include (i) the relative reduction in MRP2 activities was less than that in OATP1B during rifampicin treatment (Figure 2 c) and (ii) the reduction of CLint,bile has a larger impact on the liver compared to the blood exposure.30
For rifampicin, the in vitro K i values of rifampicin were reported to be 18.5 μM for CYP3A and 30.2 μM for CYP2C8.39 A clinical report, however, indicated no statistically significant differences in midazolam AUCRs by simultaneous or staggered administration of rifampicin (600 mg, daily for 14 days),40 suggesting a minimal inhibition of CYP3A by rifampicin in vivo. Regarding the in vivo inhibition of CYP2C8 by rifampicin, there is no clinical report available. Given that the reported K i value of rifampicin for CYP2C8 was comparable with that for CYP3A, the CYP2C8 inhibition effect is expectedly negligible in vivo. More improvement on the absorption model of rifampicin and the victims may be needed to evaluate intestinal transporter–enzyme interplay precisely considering the regional expression levels of CYP3A and P‐glycoprotein in the future.41 Differential equations for all of the PBPK models in this study are provided in the Supplementary Text . It would be valuable to propagate our models to a larger mass of users by transferring them to alternative PBPK modeling platforms, such as Simcyp (Certara, Sheffield, UK) or GastroPlus (Simulations Plus, Inc., Lancaster, CA, USA).
In conclusion, the present study established a comprehensive PBPK model of rifampicin that can predict complex DDIs via the induction of OATP1B/CYP3A/CYP2C8/CYP2C9 and the inhibition of OATP1B/MRP2. Using our expanded PBPK model of rifampicin, the observed interactions with glibenclamide, repaglinide, and CP‐I were well predicted. These findings demonstrate the utility of our rifampicin PBPK model and provide valuable insights for complex interactions with various victim drugs and endogenous biomarkers handled by multiple metabolizing enzymes and transporters.
Funding
No funding was received for this work.
Conflict of Interest/Disclosure
The authors declared no competing interests for this work.
Author Contributions
R.A., K.M., W.L., K.N., H.I., K.H., and Y.S. wrote the manuscript. R.A., K.M., and Y.S. designed the research. R.A. performed the research. R.A., K.M., W.L., and Y.S. analyzed the data.
Supporting information
Supplementary Text
Table S1. Physiological parameters of physiologically‐based pharmacokinetic (PBPK) models.
Table S2. Optimized parameters of pioglitazone, pravastatin, and repaglinide.
Table S3. Predicted and observed AUC ratios of pravastatin, glibenclamide, repaglinide, and coproporphyrin I with various dosing regimens of rifampicin.
Table S4. CYP2C8 induction ratios after rifampicin treatment.
Figure S1. Predicted and observed blood concentration‐time profiles of pravastatin and glibenclamide with various dosing regimens of rifampicin.
Figure S2. Predicted and observed blood concentration‐time profiles of repaglinide with various dosing regimens of rifampicin.
Supplementary Model Code
Acknowledgments
The authors thank Takashi Yoshikado (Laboratory of Clinical Pharmacology, Yokohama University of Pharmacy) and Kota Toshimoto (Sugiyama Laboratory, RIKEN) for helpful discussion and suggestions.
References
- 1. Niemi, M. , Backman, J.T. , Fromm, M.F. , Neuvonen, P.J. & Kivistö, K.T. Pharmacokinetic interactions with rifampicin: clinical relevance. Clin. Pharmacokinet. 42, 819–850 (2003). [DOI] [PubMed] [Google Scholar]
- 2. Maeda, K. Organic anion transporting polypeptide (OATP)1B1 and OATP1B3 as important regulators of the pharmacokinetics of substrate drugs. Biol. Pharm. Bull. 38, 155–168 (2015). [DOI] [PubMed] [Google Scholar]
- 3. Center for Drug Evaluation and Research . In Vitro Metabolism‐ and Transporter‐ Mediated Drug‐Drug Interaction Studies Guidance for Industry: Draft Guidance (Food and Drug Administration, Silver Spring, MD, 2017) <https://www.fda.gov/downloads/drugs/guidancecomplianceregulatoryinformation/guidances/ucm581965.pdf>. Accessed October 25, 2017. [Google Scholar]
- 4. Committee for Human Medicinal Products . Guideline on the Investigation of Drug Interactions (European Medicines Agency, London, 2012) <http://www.ema.europa.eu/docs/en_GB/document_library/Scientific_guideline/2012/07/WC500129606.pdf>. Accessed June 21, 2012. [Google Scholar]
- 5. Asaumi, R. et al Comprehensive PBPK model of rifampicin for quantitative prediction of complex drug‐drug interactions: CYP3A/2C9 induction and OATP inhibition effects. CPT Pharmacometrics Syst. Pharmacol. 7, 186–196 (2018). [DOI] [PMC free article] [PubMed] [Google Scholar]
- 6. Lutz, J.D. et al Cytochrome P450 3A induction predicts P‐glycoprotein induction; part 1: establishing induction relationships using ascending dose rifampin. Clin. Pharmacol. Ther. 104, 1182–1190 (2018). [DOI] [PMC free article] [PubMed] [Google Scholar]
- 7. Prueksaritanont, T. et al Pitavastatin is a more sensitive and selective organic anion‐transporting polypeptide 1B clinical probe than rosuvastatin. Br. J. Clin. Pharmacol. 78, 587–598 (2014). [DOI] [PMC free article] [PubMed] [Google Scholar]
- 8. Chen, Y. et al Effect of a single‐dose rifampin on the pharmacokinetics of pitavastatin in healthy volunteers. Eur. J. Clin. Pharmacol. 69, 1933–1938 (2013). [DOI] [PubMed] [Google Scholar]
- 9. Deng, S. et al Effects of a concomitant single oral dose of rifampicin on the pharmacokinetics of pravastatin in a two‐phase, randomized, single‐blind, placebo‐controlled, crossover study in healthy Chinese male subjects. Clin. Ther. 31, 1256–1263 (2009). [DOI] [PubMed] [Google Scholar]
- 10. Maeda, K. et al Identification of the rate‐determining process in the hepatic clearance of atorvastatin in a clinical cassette microdosing study. Clin. Pharmacol. Ther. 90, 575–581 (2011). [DOI] [PubMed] [Google Scholar]
- 11. Kyrklund, C. , Backman, J.T. , Neuvonen, M. & Neuvonen, P.J. Effect of rifampicin on pravastatin pharmacokinetics in healthy subjects. Br. J. Clin. Pharmacol. 57, 181–187 (2004). [DOI] [PMC free article] [PubMed] [Google Scholar]
- 12. Takehara, I. et al Comparative study of the dose‐dependence of OATP1B inhibition by rifampicin using probe drugs and endogenous substrates in healthy volunteers. Pharm. Res. 35, 138–150 (2018). [DOI] [PubMed] [Google Scholar]
- 13. Lai, Y. et al Coproporphyrins in plasma and urine can be appropriate clinical biomarkers to recapitulate drug‐drug interactions mediated by organic anion transporting polypeptide inhibition. J. Pharmacol. Exp. Ther. 358, 397–404 (2016). [DOI] [PubMed] [Google Scholar]
- 14. Kunze, A. , Ediage, E.N. , Dillen, L. , Monshouwer, M. & Snoeys, J. Clinical investigation of coproporphyrins as sensitive biomarkers to predict mild to strong OATP1B‐mediated drug‐drug interactions. Clin. Pharmacokinet. 57, 1559–1570 (2018). [DOI] [PubMed] [Google Scholar]
- 15. US Food and Drug Administration . Drug approval package of Livalo® (pitavastatin) <https://www.accessdata.fda.gov/drugsatfda_docs/nda/2009/022363s000_ClinPharmR_P2.pdf>.
- 16. Jaakkola, T. , Backman, J.T. , Neuvonen, M. , Laitila, J. & Neuvonen, P.J. Effect of rifampicin on the pharmacokinetics of pioglitazone. Br. J. Clin. Pharmacol. 61, 70–78 (2006). [DOI] [PMC free article] [PubMed] [Google Scholar]
- 17. Park, J.Y. , Kim, K.A. , Kang, M.H. , Kim, S.L. & Shin, J.G. Effect of rifampin on the pharmacokinetics of rosiglitazone in healthy subjects. Clin. Pharmacol. Ther. 75, 157–162 (2004). [DOI] [PubMed] [Google Scholar]
- 18. Niemi, M. , Backman, J.T. & Neuvonen, P.J. Effects of trimethoprim and rifampin on the pharmacokinetics of the cytochrome P450 2C8 substrate rosiglitazone. Clin. Pharmacol. Ther. 76, 239–249 (2004). [DOI] [PubMed] [Google Scholar]
- 19. Zheng, H.X. , Huang, Y. , Frassetto, L.A. & Benet, L.Z. Elucidating rifampin's inducing and inhibiting effects on glyburide pharmacokinetics and blood glucose in healthy volunteers: unmasking the differential effects of enzyme induction and transporter inhibition for a drug and its primay metabolite. Clin. Pharmacol. Ther. 85, 78–85 (2009). [DOI] [PMC free article] [PubMed] [Google Scholar]
- 20. Yoshikado, T. et al A clinical cassette dosing study for evaluating the contribution of hepatic OATPs and CYP3A to drug‐drug interactions. Pharm. Res. 34, 1570–1583 (2017). [DOI] [PubMed] [Google Scholar]
- 21. Kim, S.J. et al Clarification of the mechanism of clopidogrel‐mediated drug‐drug interaction in a clinical cassette small‐dose study and its prediction based on in vitro information. Drug Metab. Dispos. 44, 1622–1632 (2016). [DOI] [PubMed] [Google Scholar]
- 22. Bidstrup, T.B. , Stilling, N. , Damkier, P. , Scharling, B. , Thomsen, M.S. & Brøsen, K. Rifampicin seems to act as both an inducer and an inhibitor of the metabolism of repaglinide. Eur. J. Clin. Pharmacol. 60, 109–114 (2004). [DOI] [PubMed] [Google Scholar]
- 23. Hatorp, V. , Hansen, K.T. & Thomsen, M.S. Influence of drugs interacting with CYP3A4 on the pharmacokinetics, pharmacodynamics, and safety of the prandial glucose regulator repaglinide. J. Clin. Pharmacol. 43, 649–660 (2003). [PubMed] [Google Scholar]
- 24. Niemi, M. , Backman, J.T. , Neuvonen, M. , Neuvonen, P.J. & Kivistö, K.T. Rifampin decreases the plasma concentrations and effects of repaglinide. Clin. Pharmacol. Ther. 68, 495–500 (2000). [DOI] [PubMed] [Google Scholar]
- 25. Shebley, M. et al Physiologically based pharmacokinetic model qualification and reporting procedures for regulatory submissions: a consortium perspective. Clin. Pharmacol. Ther. 104, 88–110 (2018). [DOI] [PMC free article] [PubMed] [Google Scholar]
- 26. Hanke, N. et al PBPK models for CYP3A4 and P‐gp DDI prediction: A modeling network of rifampicin, itraconazole, clarithromycin, midazolam, alfentanil, and digoxin. CPT Pharmacometrics Syst. Pharmacol. 7, 647–659 (2018). [DOI] [PMC free article] [PubMed] [Google Scholar]
- 27. Yoshikado, T. et al Quantitative analyses of hepatic OATP‐mediated interactions between statins and inhibitors using PBPK modeling with a parameter‐optimization method. Clin. Pharmacol. Ther. 100, 513–523 (2016). [DOI] [PubMed] [Google Scholar]
- 28. Kim, S.J. , Toshimoto, K. , Yao, Y. , Yoshikado, T. & Sugiyama, Y. Quantitative analysis of complex drug‐drug interactions between repaglinide and cyclosporin A/gemfibrozil using physiologically based pharmacokinetic models with in vitro transporter/enzyme inhibition data. J. Pharm. Sci. 106, 2715–2726 (2017). [DOI] [PubMed] [Google Scholar]
- 29. Yoshikado, T. et al PBPK modeling of coproporphyrin I as an endogenous biomarker for drug interactions involving inhibition of hepatic OATP1B1 and OATP1B3. CPT Pharmacometrics Syst. Pharmacol. 7, 739–747 (2018). [DOI] [PMC free article] [PubMed] [Google Scholar]
- 30. Watanabe, T. , Kusuhara, H. & Sugiyama, Y. Application of physiologically based pharmacokinetic modeling and clearance concept to drugs showing transporter‐mediated distribution and clearance in humans. J. Pharmacokinet Pharmacodyn. 37, 575–590 (2010). [DOI] [PubMed] [Google Scholar]
- 31. Chow, E.C. & Pang, K.S. Why we need proper PBPK models to examine intestine and liver oral drug absorption. Curr. Drug Metab. 14, 57–79 (2013). [PubMed] [Google Scholar]
- 32. Yang, J. , Jamei, M. , Yeo, K.R. , Tucker, G.T. & Rostami‐Hodjegan, A. Prediction of intestinal first‐pass drug metabolism. Curr. Drug Metab. 8, 676–684 (2007). [DOI] [PubMed] [Google Scholar]
- 33. Hisaka, A. & Sugiyama, Y. Analysis of nonlinear and nonsteady state hepatic extraction with the dispersion model using the finite difference method. J. Pharmacokinet. Biopharm. 26, 495–519 (1998). [DOI] [PubMed] [Google Scholar]
- 34. Levy, R.H. , Dumain, M.S. & Cook, J.L. Time‐dependent kinetics. V: time course of drug levels during enzyme induction (one‐compartment model). J. Pharmacokinet. Biopharm. 7, 557–578 (1979). [DOI] [PubMed] [Google Scholar]
- 35. Izumi, S. et al Investigation of the impact of substrate selection on in vitro organic anion transporting polypeptide 1B1 inhibition profiles for the prediction of drug‐drug interactions. Drug Metab. Dispos. 43, 235–247 (2015). [DOI] [PubMed] [Google Scholar]
- 36. Dixit, V. , Hariparsad, N. , Li, F. , Desai, P. , Thummel, K.E. & Unadkat, J.D. Cytochrome P450 enzymes and transporters induced by anti‐human immunodeficiency virus protease inhibitors in human hepatocytes: implications for predicting clinical drug interactions. Drug Metab. Dispos. 35, 1853–1859 (2007). [DOI] [PubMed] [Google Scholar]
- 37. Williamson, B. , Dooley, K.E. , Zhang, Y. , Back, D.J. & Owen, A. Induction of influx and efflux transporters and cytochrome P450 3A4 in primary human hepatocytes by rifampin, rifabutin, and rifapentine. Antimicrob. Agents Chemother. 57, 6366–6369 (2013). [DOI] [PMC free article] [PubMed] [Google Scholar]
- 38. Meyer Zu Schwabedissen, H.E. , Böttcher, K. , Chaudhry, A. , Kroemer, H.K. , Schuetz, E.G. & Kim, R.B. Liver X receptor α and farnesoid X receptor are major transcriptional regulators of OATP1B1. Hepatology 52, 1797–1807 (2010). [DOI] [PubMed] [Google Scholar]
- 39. Kajosaari, L.I. , Laitila, J. , Neuvonen, P.J. & Backman, J.T. Metabolism of repaglinide by CYP2C8 and CYP3A4 in vitro: effect of fibrates and rifampicin. Basic Clin. Pharmacol. Toxicol. 97, 249–256 (2005). [DOI] [PubMed] [Google Scholar]
- 40. Kirby, B.J. , Collier, A.C. , Kharasch, E.D. , Whittington, D. , Thummel, K.E. & Unadkat, J.D. Complex drug interactions of HIV protease inhibitors 1: inactivation, induction, and inhibition of cytochrome P450 3A by ritonavir or nelfinavir. Drug Metab. Dispos. 39, 1070–1078 (2011). [DOI] [PMC free article] [PubMed] [Google Scholar]
- 41. Darwich, A.S. & von Moltke, L. The impact of formulation, delivery, and dosing regimen on the risk of drug‐drug interactions. Clin. Pharmacol. Ther. 105, 1329–1331 (2019). [DOI] [PubMed] [Google Scholar]
- 42. Eckland, D.A. & Danhof, M. Clinical pharmacokinetics of pioglitazone. Exp. Clin. Endocrinol. Diabetes 108(suppl. 2), 234–242 (2000). [Google Scholar]
Associated Data
This section collects any data citations, data availability statements, or supplementary materials included in this article.
Supplementary Materials
Supplementary Text
Table S1. Physiological parameters of physiologically‐based pharmacokinetic (PBPK) models.
Table S2. Optimized parameters of pioglitazone, pravastatin, and repaglinide.
Table S3. Predicted and observed AUC ratios of pravastatin, glibenclamide, repaglinide, and coproporphyrin I with various dosing regimens of rifampicin.
Table S4. CYP2C8 induction ratios after rifampicin treatment.
Figure S1. Predicted and observed blood concentration‐time profiles of pravastatin and glibenclamide with various dosing regimens of rifampicin.
Figure S2. Predicted and observed blood concentration‐time profiles of repaglinide with various dosing regimens of rifampicin.
Supplementary Model Code