

Abstract
Haematological toxicity associated with cancer therapeutics is monitored by changes in blood cell count, and their primary effect is on proliferative progenitors in the bone marrow. Using observations in rat bone marrow and blood, we characterize a mathematical model that comprises cell proliferation and differentiation of the full haematopoietic phylogeny, with interacting feedback loops between lineages in homeostasis as well as following carboplatin exposure. We accurately predicted the temporal dynamics of several mature cell types related to carboplatin‐induced bone marrow toxicity and identified novel insights into haematopoiesis. Our model confirms a significant degree of plasticity within bone marrow cells, with the number and type of both early progenitors and circulating cells affecting cell balance, via feedback mechanisms, through fate decisions of the multipotent progenitors. We also demonstrated cross‐species translation of our predictions to patients, applying the same core model structure and considering differences in drug‐dependent and physiology‐dependent parameters.
Study Highlights.
WHAT IS THE CURRENT KNOWLEDGE ON THE TOPIC?
☑ Cancer therapeutics impact on proliferative progenitors in the bone marrow, disrupting the process of haematopoiesis and leading to observed changes in blood cell counts. Theoretical models have been used to characterize these variations in peripheral blood cells using assumptions based on nonquantified bone marrow toxicity.
WHAT QUESTION DID THIS STUDY ADDRESS?
☑ This study aims to mechanistically characterize the overall carboplatin‐induced myelosuppression profile, linking carboplatin pharmacokinetics with variations in bone marrow progenitors and in circulating blood cells.
WHAT DOES THIS STUDY ADD TO OUR KNOWLEDGE?
☑ Our model describes, quantitatively and mechanistically, carboplatin‐induced DNA damage on bone marrow progenitors and how toxicity propagates across cell lineages over time, modifying multiple clinical endpoints in peripheral blood.
HOW MIGHT THIS CHANGE DRUG DISCOVERY, DEVELOPMENT, AND/OR THERAPEUTICS?
☑ Our model captures the complexity and dynamics of haematopoiesis and reveals new understanding essential for better prediction of drug‐induced effects on specific lineages in rat and in man. This approach may be adopted for other drugs where myelosuppression is of concern.
Drug‐induced myelosuppression is a common dose‐limiting adverse event for cancer therapeutics,1 causing delays and discontinuation of treatment, which compromise the therapy's success. The cytotoxic activity of antineoplastic agents affects highly proliferative bone marrow progenitors, reduces bone marrow cellularity, and disrupts blood cell production.2 Carboplatin, which is the standard of care treatment for several solid tumors,3 induces DNA damage in proliferating bone marrow cells, causing cell death and consequent myelosuppression.1 The dose‐limiting toxicities in patients receiving carboplatin are thrombocytopenia and leukopenia.4, 5
Haematopoiesis is an extremely dynamic process that comprises highly complex cell differentiation cascades. Around 109 red blood cells and 108 white blood cells are generated every hour from a common set of haematopoietic stem cells (HSCs) in the bone marrow of a healthy adult.6 To enhance our understanding of this process, as well as of the mechanisms behind drug‐induced myelosuppression, it is essential to quantify cell dynamics and interactions across multiple branches of the haematopoietic phylogeny rather than modeling the differentiation of cell lineages in isolation.7 This task is not trivial because the complexity of the system's dynamics arises from the interaction of multiple cellular prosurvival mechanisms primed by suppressive drug effects.
Clinically, drug‐induced myelosuppression is monitored by tracking the variation in blood counts,8 which are relatively easy to obtain. However, haematological toxicity originates in the bone marrow, where proliferative progenitors reside. Theoretical models have been used widely to explore hypotheses on nonquantified drug‐induced toxicity in the bone marrow,7, 9 and empirical adjustments are sometimes required to capture drug effects over multiple cycles.7, 10, 11, 12 In a recent review,7 we discussed the possibility of enhancing clinical data with complementary information from preclinical studies, where measurements in the bone marrow are more feasible.
Here we present a novel quantitative systems pharmacology model to describe the link between carboplatin pharmacokinetic (PK) profiles and variations in bone marrow progenitors and in multiple lineages of mature blood cells (Figure 1 ). Combining this theoretical framework with experimental results in rats, we investigate hypotheses on progenitor cell fate, feedback mechanisms, and the disruption of cell dynamics in the haematopoiesis cascade disrupted by carboplatin. Furthermore, we translate our preclinical findings and predictions to patients by scaling the essential features of the haematopoietic process and adjusting the drug potency for interspecies variations7, 13 (Figure 2 ).
Figure 1.
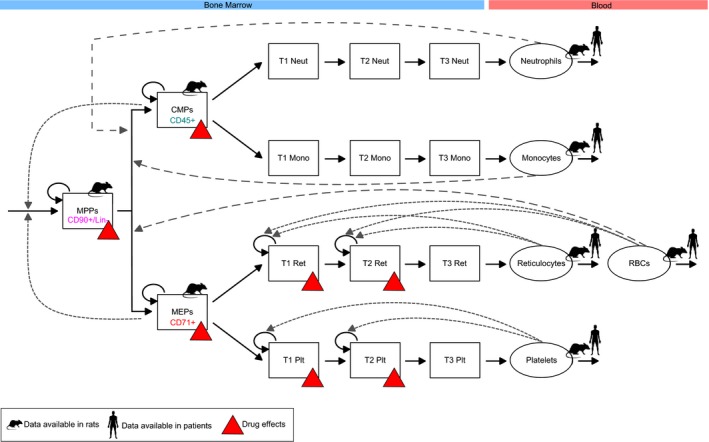
Carboplatin toxicity in the bone marrow is mechanistically linked with effects in the blood. The diagram provides a graphical representation of our quantitative systems pharmacology model defined in Eqs. (1), (2), (3), (4), (5), (6), (7), (8), (9). The formation of every mature blood cell is pictured as a path through the haematopoiesis differentiation tree, with haematopoietic stem cells at its top. Haematopoietic stem cells mature into MPPs, which then commit to specific lineages giving rise to fully differentiated blood cells. Red triangles highlight populations affected by carboplatin. Rat and human symbols mark model variables for which observations in rat and human were available. Cell surface markers used to quantify bone marrow progenitors in rats are also reported in the diagram. Proliferative cells are affected by carboplatin. Proliferation and maturation in the bone marrow are regulated by the interplay of feedback mechanisms from different circulating cells (dotted arrows). CD90+/Lin‐, CD90 positive and lineage negative cells; CMP, common‐myeloid progenitor; MEP, megakaryocyte–erythrocyte progenitor; Mono, monocytes; Neut, neutrophils; MPP, multipotent progenitor; Plt, platelets; RBCs, red blood cells; Ret, reticulocytes; T1, T2, T3, transit‐compartments.
Figure 2.
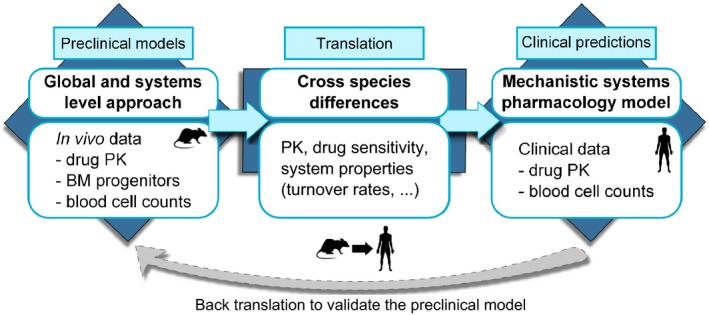
Graphical representation of our theoretical approach developed to investigate drug‐induced haematological toxicities. The first step consisted of defining a novel global and quantitative system pharmacology model able to integrate data from different sources (i.e., rat carboplatin PK, bone marrow effects, and peripheral blood counts) and describe carboplatin‐induced myelosuppression profiles in rats. Then, we considered the cross‐species differences between rat and human to update model parameter values. Last, we generated clinical predictions. In addition, when clinical data are available, back‐translation can also be performed (dotted gray arrow). BM, bone marrow; PK, pharmacokinetic.
Methods
In vivo rat studies
All animal care and experimental procedures used at the AstraZeneca facility in the United Kingdom were performed under the authority of a valid Home Office Project License and they were conformed to the UK Animals (scientific procedures) Act, 1986. Animal studies are reported in compliance with the ARRIVE (Animal Research: Reporting of In Vivo Experiments) guidelines.14, 15
A total of 178 animals were used in these experiments. Details of the study design, haematology analysis, flow cytometry analysis, and bioanalysis are reported in Table S1 and Supplementary Text S1–S4 , respectively.
Theoretical description of carboplatin‐induced myelosuppression
Details on carboplatin pharmacokinetic model are reported in Supplementary Text S5 .
We described haematopoiesis as a set of compartments connected in branches (one for each lineage), which originate from common sources of HSCs and multipotent progenitors (MPPs; Figure 1 ). Branches represent distinct cell lineages (neutrophils, monocytes, platelets, erythrocytes), and form our model subunits. Note that we did not consider the lymphoid branch because the proliferation, activation, and regulation of lymphoid cells occur mostly in lymphoid organs.16 Within lineages, compartments correspond to specific haematopoietic cell stages (progenitors, transit cells, mature cells), and model variables describe the cell count in each of these compartments.17 Our model describes a dynamic system of cells continuously proliferating and differentiating, able to maintain and recover homoeostasis after perturbations by balanced cell flows across the connected compartments (predecessor–successor populations). The value of these flows is determined from the lifespan of cells reported in the literature and observed size of compartments.
We described haematopoietic cell dynamics with a system of ordinary differential equations, which are here grouped together by the stage of the haematopoietic cell population under analysis (namely, progenitors, transamplifying cells, and mature cells).
Progenitor equations
We assumed that all haematopoietic cells come from a common pool of MPPs (CD90+/Lineage– cells):
| (1) |
A source of HSCs6 (k stem), whose flow is mediated by a feedback function (fdbkstem), feeds into the MPP compartment, and MPPs also increase their number via proliferation (). MPPs differentiate into the more mature common myeloid progenitors (CMPs; CD45+ cells) and megakaryocyte–erythrocyte progenitors (MEPs; CD71+ cells), with the rates , respectively. MPPs are affected by carboplatin, whose effect is described by the parameter SlopeMPP. We assumed that the drug effects were driven by the cell damage (Damage) and that drug‐induced damage affected the proliferative fraction of the cell compartment, which is denoted by the product of the proliferation rate (k prol) and the compartment size (MPP):
| (2) |
We quantified cell damage as the result of (i) the process of adducts formation, or DNA Damage, with rate k dam proportional to the concentration of free platinum in plasma, and (ii) the DNA repair process, with first‐order kinetics (k rep), as follows:
| (3) |
The CMP and MEP compartments follow similar rules to those previously described for MPP:
| (4) |
They proliferate with rates , respectively, and differentiate into the successors of their lineage, i.e., transit‐neutrophils (with rate ) and transit monocytes (with rate ) for CMP and transit reticulocytes (with rate ) and transit platelets (with rate ) for MEP. Differentiation rates (k tr) were derived resolving the steady‐state equations reported in Supplementary Text S6 and S7 . Similar to MPP, CMP and MEP are affected by the cytotoxic activity of carboplatin (SlopeCMP, SlopeMEP).
Transit compartment equations
We used a chain of three non proliferative transit compartments to describe maturation of both neutrophils (T1Neut, T2Neut, T3Neut) and monocytes (T1Mono, T2Mono, T3Mono):
| (5) |
As previously reported,18 we introduced a new parameter (a) to describe maturation rate within each lineage‐specific transit compartment. We defined this rate as the ratio between the number of transit compartments and the maturation time:18
| (6) |
For reticulocytes and platelets, we used a chain of two proliferative transit compartments (T1Ret, T2Ret, T1Plt, T2Plt) or late progenitor cell populations, thus susceptible to carboplatin activity, followed by non proliferative transit compartments (T3Ret, T3Plt):
| (7) |
As previously described for neutrophil and monocyte maturation, the MTTs of reticulocytes and platelets were defined as:
| (8) |
Lifespans of transit compartments (1/a) and progenitor cells (1/k tr) were obtained from the steady‐state equations (Supplementary Text S6 and S7 ) and by fitting the model to the data (Supplementary Text S8 ).
The cells in the proliferative transit compartment are affected by the cytotoxic activity of carboplatin with rates (δRetSlopeMEP, δPltSlopeMEP), which are proportional to the damage induced by carboplatin (Damage) and the proliferative fraction of the compartment.
Circulating cell equations
After maturation, fully differentiated cells are released into the blood:
| (9) |
Circulating rates (k circ) were derived from cell lifespan values (1/k circ) in the literature.
All modeling and simulations were performed in Matlab (Mathworks, Natick, MA) toolbox Simbiology (constrained nonlinear least‐square optimization) and Phoenix non linear mixed effect (NLME) 7.0 (Certara, Princeton, NJ; Supplementary Text S8 and Supplementary Model Code ).
Identification of values for the model parameters
The lifespans of mature blood cells were derived from rat values found in the literature.5, 13, 17, 19 The size of all compartments, lifespan and proliferation of transit compartments, and progenitor cells were calculated by solving the steady‐state equations of the untreated bone marrow (Supplementary Text S6 and S7 ) and by fitting the model to our experimental data sets (Supplementary Text S8 ). The parameters describing feedback strength and drug effects were calculated by fitting the model to our experimental data sets (Supplementary Text S8 ). Stability analysis was also performed with Oscill8 Dynamical Systems Toolset (Copyright (C) 2005, Emery Conrad, http://oscill8.sourceforge.net/), Supplementary Text S8 , to identify parameter regions leading to oscillatory solutions, which do not describe a physiological response of haematopoiesis to carboplatin treatment.
Model translation to the clinic
The parameters of our model were scaled to reflect the differences between rat and human (i) haematopoiesis physiology and (ii) carboplatin bone marrow toxicity.
The lifespan and the counts of peripheral blood cells were obtained from the literature, whereas for MPP counts we applied allometric scaling from rat to human20 given the specific marker‐dependency of flow cytometry data. Then we derived CMP and MEP counts using the proportions between these populations and MPP, which are experimentally reported for humans21 (Supplementary Text S9 ). Mean transit times in humans were calculated from the literature5 according to the number of non proliferative transit compartments in our model.
The drug‐dependent parameters, denoted Slope, were scaled using species‐specific in vitro drug potency experimental results (Table S2 and Supplementary Text S10 ), which express the drug effect on several proliferative cell types. To scale these parameters, we used a previously reported expression13 with the following form:
| (10) |
where correcting for the cross‐species differences in the fraction of unbound drug was not needed for carboplatin.
Last, the human carboplatin PK was simulated using a previously reported model22 (Supplementary Text S11 ).
Results
A new quantitative systems pharmacology model for haematopoiesis
Our novel approach describes cell dynamics in the haematopoietic system based on the proliferation, differentiation, and interaction of feedback processes across some of the major branches of the haematopoietic phylogeny.23 This theoretical framework was able to quantify the temporal dynamics of carboplatin‐induced DNA damage on progenitor cells in the bone marrow, which is the drug site of action, together with the downstream impact of this bone marrow toxicity on mature blood cells.
The final model structure contains the formation of distinct blood cell lineages as branches of transit compartments originated from a common source of early progenitors (Figure 1 ). Each branch incorporates the dynamics of cell proliferation, lineage differentiation, and negative feedback processes in response to stimuli.7 These feedback loops connect cells across lineages and regulate the proliferation and differentiation of common progenitors to rescue the depleted populations.24 This results in a haematopoietic dynamic system in homeostatic equilibrium capable to recover25, 26 after perturbations (Figures 3 , S1 , S2 ). Parameter values are reported in Tables 1 , 2 , S3 , and S4 .
Figure 3.
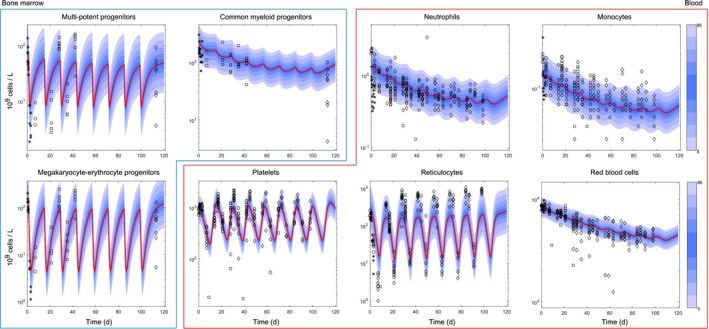
Overall myelosuppression profile induced by repeated cycles of carboplatin 40 mg/kg. Rats were dosed with carboplatin 40 mg/kg on day 1 of repeated 14‐day cycles (Table S1 ). Plots show the time course of carboplatin effects across the main bone marrow progenitor populations (multipotent progenitors, common‐myeloid progenitors, megakaryocyte–erythrocyte progenitors) and mature blood cells (neutrophils, monocytes, platelets, reticulocytes, red blood cells). Multipotent progenitor, common‐myeloid progenitor, megakaryocyte–erythrocyte progenitor, neutrophil, monocyte, and red blood cell total counts go down over multiple cycles, whereas reticulocyte and platelet recovery to baseline (after rebound) is still possible. Points show the observations, red lines show average model predictions, and blue shadow areas show percentiles in the simulated data. Visual predictive checks were generated from 1,000 simulations using the log‐additive residual errors reported in Table S4 . d, days.
Table 1.
Physiology‐dependent system parameters
| Description | Parameter | Unit | Rat | Human | ||||
|---|---|---|---|---|---|---|---|---|
| Value | CV (%) | Source | Value | Source | ||||
| Circulating rates | ||||||||
| Neutrophil circulating rate |
|
1/hour | 0.17 | – | 45 | 0.1 | 22 | |
| Monocyte circulating rate |
|
1/hour | 0.06 | – | 45 | 0.04 | 41 | |
| Platelet circulating rate |
|
1/hour | 0.01 | – | 46 | 0.0052 | 5 | |
| Red blood cell circulating rate |
|
1/hour | 0.0007 | – | 45 | 0.00037 | 13 | |
| Baseline values | ||||||||
| Neutrophil baseline value | Neut0 | 109 cells/L | 1.32 | 2.6 | Estimated | 2–7 | 22 | |
| Monocyte baseline value | Mono0 | 109 cells/L | 0.16 | 2.6 | Estimated | 0.2–10 | 41 | |
| Platelet baseline value | Plt0 | 109 cells/L | 967 | 2.5 | Estimated | 345 | 5 | |
| Reticulocyte baseline value | Ret0 | 109 cells/L | 235 | 2.7 | Estimated | 40–115 | 1 | |
| Red blood cell baseline value | RBC0 | 109 cells/L | 8,161 | 2.2 | Estimated | 4,100–5,900 | 32 | |
| Multipotent progenitor baseline value | MPP0 | 109 cells/L | 69 | 4.6 | Estimated | 1.3 | Allometric scaling ref. 42 | |
| Common myeloid progenitor baseline value | CMP0 | 109 cells/L | 214 | 4.1 | Estimated | 20.9 | Proportions from ref. 43 | |
| Megakaryocyte–erythrocyte progenitor baseline value | MEP0 | 109 cells/L | 156 | 5.2 | Estimated | 15 | Proportions from43 | |
| Transient times | ||||||||
| Neutrophil mean transient time | MTTNeut | hour | 61.5 | 56 | Estimated | 210 | Scaled from ref. 5 | |
| Monocyte mean transient time | MTTMono | hour | 62.2 | 55 | Estimated | 121.5 | Scaled from47 | |
| Platelet mean transient time | MTTPlt | h | 74 | 5.6 | Estimated | 168 | Scaled from5 | |
| Reticulocyte mean transient time | MTTRet | hour | 75 | 4.8 | Estimated | 66 | Scaled from internal AZ study (data not shown) | |
| Steady‐state equation parameters | ||||||||
| Reticulocyte 1st transit compartment baseline value | λ1 | Dimensionless | 2 | – | Fixed | 2 | As in the rat | |
| Platelet 1st transit compartment baseline value | λ2 | Dimensionless | 2 | – | Fixed | 2 | As in the rat | |
| Proliferation rate CMPs | λ3 | Dimensionless | 1.8 | – | Fixed | 1.8 | As in the rat | |
| Proliferation rate MEPs | λ4 | Dimensionless | 1.8 | – | Fixed | 1.8 | As in the rat | |
| Proliferation rate MPPs | λ5 | Dimensionless | 1.8 | – | Fixed | 1.8 | As in the rat | |
| Feedback powers controlling | ||||||||
| MPP zero order proliferation rate | γstem | Dimensionless | 0.07 | – | Fixed | 0.07 | As in the rat | |
| MPP maturation rate toward CMPs |
|
Dimensionless | 0.6 | – | Fixed | 0.6 | As in the rat | |
| MPP maturation rate toward MEPs |
|
Dimensionless | 0.3 | – | Fixed | 0.3 | As in the rat | |
| First‐order proliferation rates of T1Ret, T2Ret, T1Plt, T1Plt |
|
Dimensionless | 0.7 | – | Fixed | 0.7 | As in the rat | |
| Damage | ||||||||
| Damage creation | k dam | 1/hour | 0.017 | – | Fixed | 0.017 | As in the rat | |
| Damage repair | k rep | 1/hour | 0.017 | – | Fixed | 0.017 | As in the rat | |
Values for rat were obtained from the literature, when available; estimated by fitting the model to the data; or derived/fixed from experiments. Human values were derived from literature or scaled as explained in the main text and in the Supplementary Material. Coefficient of variation (CV%) values show the confidence in our parameter estimates. AZ, AstraZeneca; T1, T2, proliferative transit‐compartments.
Table 2.
Drug‐dependent system parameters
| Description | Parameter | Rat | Human | ||
|---|---|---|---|---|---|
| Unit | Value | CV (%) | IC50 scaled value | ||
| Carboplatin effects in multipotent progenitors | SlopeMPP | 1/μM | 2.05 | 11.8 | 0.79 |
| Carboplatin effects in common myeloid progenitors | SlopeCMP | 1/μM | 1.47 | 8.6 | 0.57 |
| Carboplatin effects in megakaryocyte–erythrocyte progenitors | SlopeMEP | 1/μM | 2.19 | 10.3 | 0.66 |
| Carboplatin effects in reticulocyte proliferating transit‐compartments | δRet | Dimensionless | 2.8 | 21 | 2.8 (as in rat) |
| Carboplatin effects in platelet proliferating transit compartments | δPlt | Dimensionless | 0.54 | 30.4 | 0.54 (as in rat) |
Carboplatin effects in rat were estimated by fitting the model to the data. Human values were calculated by adjusting the rat values for species‐specific drug sensitivity , Eq. (10). The IC50 values used to scale drug effects are reported in Table S3 . Coefficient of variation (CV%) values show the confidence in our parameter estimates. IC50, half maximal inhibitory concentration.
Carboplatin‐induced DNA damage drives proliferative cell loss
We observed that nucleated cells in the bone marrow started to decrease from the first administration of carboplatin. The nadir was observed 3–4 days post dosing, when free platinum, which is the active species of carboplatin and that is cleared relatively rapidly from blood27, 28 (Figure S3 ), was not detected in either blood or bone marrow (data not shown). Seven days from dosing, although the recovery process had started, the bone marrow cells were still compromised (Figures 3 and S1 ).
Similar to previous reports,29 we accounted for this observed temporal disconnection between free platinum concentration and effects on haematopoietic cells, modeling carboplatin toxicity as a function of the DNA damage (Damage) caused by the formation of platinum DNA adducts, which persist in the system longer than free platinum28, 29, 30 (Eq. (3); Figure S3 ).
Drug effects in Eqs. (1), (4), and (7) are driven by the damage‐induced cell death, which occurs in the proliferative fraction of the cell population compartment (Eq. (2)). Notice that the cell death rate (Slope) is independent of both the time and the structural scale of the system, and it is ready to be used for the extrapolation of predictions across scales and species with the same sensitivity to carboplatin. Moreover, Eq. (2) describes the drug effect as independent of any feedback mechanism activated by perturbations, which improves the computational tractability of our model when compared with previous approaches.17, 31
Under these assumptions, our model explained the lack of synchronicity between free platinum plasma kinetics (Figures 3 and S1 ) and the depletion of bone marrow populations previously described.
MPPs are rescued during injury
Similar to previously published models,32, 33 we implemented a flow of cells, or source of HSCs (Source), feeding into the MPP compartment (Eq. (1)). In our model, the value of this flow is regulated by negative feedback signals (fdbkstem in Eq. (1)) coming from the MPP descendants CMPs and/or MEPs, which is supported by experimental evidence.24 A decrease of the descendants below their homeostatic values (CMP0, MEP0) increases the flow of cells into the MPPs compartment. This was modeled by including the following feedback factor into Eq. (1):
| (11) |
which enabled to upregulate MPP levels after carboplatin exposure and hence model the observed oscillations of CMP and MEP in response to carboplatin (Figures 3 , S1 ). Because of the rather small value of γ stem when compared with the other feedback values, the effect of fdbkstem function on MPP dynamics were quite mild (i.e., k stem rate increased 27% when the feedback was at its maximum). However, this was enough to counterbalance MPP cell loss as a result of their differentiation into CMP and MEP,24 which are also regulated by feedback functions (Eq. (12)).
CMPs fail to balance carboplatin‐induced cell loss
We observed a mild depletion of CD45+ cells (CMP); however, the recovery of this population was relatively slow, and homeostasis was not restored before the start of the next 14‐day cycle, leading to a progressive reduction of CMP population from the first carboplatin dose (Figures 3 and S4 ). This was explained assuming that CMP proliferation rate together with feedback mechanisms controlling the in‐flow of cells into CMP compartment were not able to rebalance the cell loss induced by carboplatin. Consequently, white blood cell counts decreased progressively during the administration schedule (Figures 3 and S4 ), and we estimated a recovery period of ~50 days to reinstate at least 80% of the original CMP population after the last carboplatin cycle.
Circulating cells regulate MPP cell fate
Analysis of the progenitors in the bone marrow revealed that the most affected populations were CD90+/Lin‐ cells and CD71+ cells, i.e., MPPs and MEPs, respectively. In the first 3 dosing cycles, both MPP and MEP experienced great cell loss followed by a recovery process that, because of the well‐established negative feedback loops,34, 35 led to values first exceeding and then converging to baseline before the following cycle started (Figure 3 ). In our experiments, where bone marrow status was not assessed again until the eighth cycle, full recovery was not achieved (Figure S4 ). We assumed that this resulted from the interaction of different cellular prosurvival mechanisms that regulate bone marrow cell dynamics,25 and we defined not only proliferation but also maturation25, 36 as dependent on the level of circulating cells through feedback loops. We modeled the cell flows from MPP into CMP and MEP as dependent on feedback signals originated from circulating cells with the following functions
| (12) |
which are integrated in Eqs. (1) and (4). These functions define cross‐lineage effects and most likely describe the impact of signals mediated by lineage‐specific cytokines,7, 37 such as erythropoietin for erythrocytes, granulocyte colony stimulating factor for neutrophils, and macrophage colony stimulating factor for monocytes, on MPP cell‐fate decision.38 This is a vital process enabling the rapid recovery following myelosuppression; however, we do not have experimental measurements of such cytokines in this particular study, and as a result we have taken an empirical approach based on deviations of mature circulating cell counts from baseline values. Differentiation of MPP into CMP is favored by reduced white blood cell counts39 or equivalently by increased granulocyte and monocyte stimulating factors, whereas maturation toward MEP is controlled by red blood cells29 or erythropoietin. The effects of these feedback functions can be quantified from the recovery times required by each progenitor cell population after the last carboplatin cycle. We estimated that MEP require 12 days to reinstate at least 80% of their original population size vs. the 30 days required by MPP.
Figure 3 shows that, when considering feedback from circulating cells on MPP maturation, as described in Eq. (12), the model predicted the observed decreasing numbers of progenitors in successive cycles, whereas this pattern was not predicted when feedback mechanisms were modulating only proliferation (Figure S5 ). This hypothesis is supported by independent experimental findings, which suggest that high levels of erythropoietin, in response to the progressive depletion of red blood cells, introduces bias in the differentiation process, guiding MPP fate in favor of committed erythroid progenitors.40
Reticulocyte and platelet transit cells proliferate
Carboplatin induced severe depletion in reticulocytes and platelets, for which the nadir was more than 95% and 45% reduction from baseline, respectively. However, as previously reported,29, 41 within each one of the eight cycles, we observed a strong rebound of these populations exceeding by 290% and 180% their baseline, respectively, before the recovery of homeostatic values. These large oscillations could not be explained by toxicity and proliferation of their common progenitor, MEP (Figure S6 ). We hypothesized that the first two transit compartments of reticulocytes35 and platelets42 are proliferative and thus also sensitive to carboplatin. Furthermore, we also considered that erythropoietin and thrombopoietin significantly affected proliferation in these erythroid and platelet transit‐amplifying compartments by a negative feedback loop from circulating cells expressed by the following functions
| (13) |
which are included in Eq. (7).
Under the hypothesis that immature transit cells are proliferative (i.e., late progenitor cells), the large oscillations observed in circulating reticulocytes and platelets were accurately described by the model (Figure 3 ). Using stability analysis, we found that the power of the feedback function defined in Eq. (13) (γprolTrans) is a crucial parameter that can lead our system into oscillatory solutions and that does not describe a physiological haematopoiesis process (Figure S7 ).
Clinical predictions
We assumed that parameter values, but not model structure (i.e., haematopoiesis biology), were species dependent. Model predictions generated scaling our mathematical model (Eqs. (1), (2), (3), (4), (5), (6), (7), (8), (9)) to reflect the differences between rat and human haematopoiesis physiology (e.g., population size, maturation time, etc.), but using the drug‐effect parameters estimated in rats did not reflect accurately either clinical neutropenia or thrombocytopenia (Figure 4 ). Therefore, we scaled our mathematical model to also account for the differences in sensitivity to carboplatin between human and rat bone marrow cells. Then, we provided predictions in patients and compared these with simulated clinical data, which were generated using the model by Schmitt et al.5 (Supplementary Text S12 ).
Figure 4.
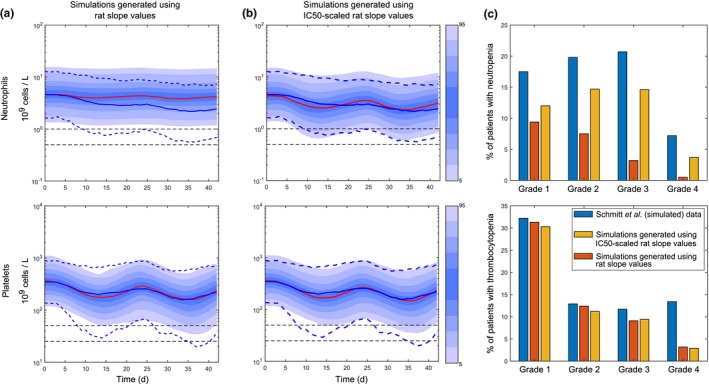
Clinical predictions of carboplatin‐induced neutropenia and thrombocytopenia were generated translating our quantitative systems pharmacology model of carboplatin‐induced myelotoxicity from rat to human. Clinical predictions (solid red lines) generated using the same slope values as those estimated from the rat (a) and predictions generated using slope values adjusted for species‐specific drug sensitivity, Eq. (10), Table 2 (b), were compared with clinical data of carboplatin‐induced neutropenia and thrombocytopenia described in ref.5 which are represented by solid (means) and dotted (percentiles) blue lines. Blue shadow areas show percentiles in our simulations (1,000 individuals), dotted horizontal black lines are thresholds for grades 3 and 4 (neutropenia and thrombocytopenia). Two cycles of 21 days of carboplatin were simulated. Doses were calculated with the Calvert formula,51 targeting an AUC (0–24) of 5 (mg/mL) minutes (Supplementary Text S11 ). The predicted percentages of patients with neutropenia (top) and thrombocytopenia (bottom) grades with those in ref.5 are compared (c). d, days. AUC(0‐24), area under the curve in the 24 h time interval; IC50, half maximal inhibitory concentration.
Our in vitro experimental results suggested that carboplatin is more potent in rat than human, with MEP being more sensitive than CMP in both species (Table S2 ). After scaling the drug‐effect parameters according to the observed species‐specific drug sensitivity (Eq. (10)), both clinical neutropenia and thrombocytopenia predictions improved (Figure 4 ). Precisely, the percentages of patients experiencing grade 3 and grade 4 neutropenia and grade 3 thrombocytopenia were predicted within onefold difference (Figure 4 c). However, grade 4 thrombocytopenia remained underpredicted by fourfold, suggesting that further understanding of the differences between human and rat platelet biology is crucial for increasing confidence in the predictions of severe clinical thrombocytopenia. Other factors that could affect the predictions are the underlying disease itself or impaired bone marrow function as a result of previous treatments, which would also impact on haematopoietic recovery, and these features were not accounted in our translation.
Discussion
In this study, we described a new systems pharmacology model of haematopoiesis that quantitatively and mechanistically links carboplatin‐induced effects in the bone marrow with multiple clinical endpoints, considering various lineages of the haematopoietic phylogeny, cellular turnover, and interaction among lineage‐dependent feedback loops (Figure 1 ) rather than effects on single lineages in isolation.7 We used the rat as a model system to investigate haematotoxicity, and we accurately predicted the temporal dynamics of bone marrow progenitors and mature blood cells with our theoretical model.
Carboplatin‐induced loss of proliferative cells is driven by DNA damage, which is caused by the formation of platinum DNA adducts,28, 30 and these adducts are stable for days28, 30 after carboplatin is cleared. We modeled the temporal dynamics of the damage induced by platinum DNA adducts (Eqs. (2), (3)) in proliferative progenitors, and this was sufficient to capture the observed lack of synchronicity between carboplatin plasma kinetics and the response of bone marrow populations (Figures 3 and S3 ).
When homeostasis is perturbed, the number and type of progenitor cells in the bone marrow, as well as of circulating cells, influence the balance between cell in flow and out flow in early progenitor populations via complex interacting feedback signals to facilitate the recovery of the system. In our model, the feedback signals affect not only the proliferation potential of susceptible populations but also impact cell‐fate decision at a higher level by modulating the competitive equilibrium between pro‐proliferation and pro‐differentiation inputs coming from other progenitors and mature cells. For instance, we observed that MPP progenitors lost their capacity to recover baseline values after successive dosing cycles (Figure S4 ). To explain this result, and in agreement with previously reported findings,40 we hypothesized that, after several cycles of carboplatin, erythropoietin levels raised to rescue the progressive (but late) detectable loss of red blood cells, thus inducing bias toward erythroid lineages.40 This is achieved by disrupting the equilibrium controlling cell‐fate decision and favoring MPP differentiation into the erythroid lineage over proliferation (Figure 3 ). These model assumptions reflect a degree of plasticity of haematopoietic progenitors to rapidly respond to strong perturbations.43 In this respect, a number of studies suggest that, in some pathological conditions, HSCs are even able to shift out of the haematopoietic hierarchy and transdifferentiate into cell types that belong to other organ systems, although these results remain controversial.44
Furthermore, we observed large oscillations in reticulocyte and platelet counts, which MEP proliferation activity coupled with carboplatin cytotoxicity were not able to capture (Figure S6 ). We described these large variations (Figure 3 ) by assuming that T1Ret, T2Ret, T1Plt, T2Plt are proliferative compartments (i.e., late progenitor populations) and thus are susceptible to carboplatin toxicity, and with a proliferation potential responsive to erythropoietin‐mediated35 and thrombopoietin‐mediated42feedback, respectively.
Beyond this exemplar case with carboplatin, our approach easily enables the incorporation of additional motifs capturing cell type–dependent and drug‐dependent mechanisms that act at the molecular scale and drive the haematopoietic response. For instance, modeling how specific progenitor cell types cope with DNA damage45 will enable the quantification of the haematological toxicity of DNA damage repair inhibitors. Similarly, the effects of cytokines, such as granulocyte‐colony stimulating factor on progenitors’ proliferation and differentiation46 can be measured and then explicitly considered to predict the rescuing effects of adjuvant therapies during chemotherapy.39 For this purpose, hypotheses derived from in vitro systems, such as bone marrow organ‐on‐a‐chip, where a niche of HSCs and progenitors sustains a dynamic haematopoietic system,47 could be integrated into the model to quantify cytokine‐driven feedback dynamics.7 Other aspects are the investigations of bone marrow microenvironments or niches6 and the spatial properties of the haematopoietic system. Our model hypotheses can be integrated in computational models48 and/or partial differential equations that, combined with high‐resolution imaging techniques, will enable the study of the effect of the microenvironment or niche6 on HSCs and early progenitors cell‐fate decision.49
We demonstrated the application of our model to describe carboplatin toxicity and, based on the assumption that the same core structure would apply to human (i.e., assuming a conserved haematopoiesis biology across species), we showed the translation of our theoretical insights and predictions for the observed clinical neutropenia and grade 3 thrombocytopenia induced by carboplatin treatment (Figure 4 ). We accounted for known cross‐species differences in model parameters, tested hypotheses about exposure–response relationships, and made assumptions where knowledge was not available (e.g., allometric scaling of parameters).50 Although extrapolation beyond the observed data must always be undertaken with caution, our multidisciplinary approach can be easily adapted to model the impact of other drugs on patients’ bone marrow, where the sampling of such cells is rarely feasible. Likewise, bone marrow disease models, such as for acute myeloid leukemia,31 can be straightforwardly built on our theoretical framework to provide prospective clinical predictions for different patient populations.
Altogether, our quantitative systems toxicology approach enables the investigation of the effects of compounds and combinations, with substantial potential to explore new schedules and inform drug‐induced effects in man, prior to the initiation of clinical trials.
Funding
C.F. was a fellow of the AstraZeneca postdoc program.
Conflict of Interest
C.F., L.O.O.C., C.P., J.W.T.Y., J.T.M., and T.A.C. are AstraZeneca employees; J.W.T.Y., T.A.C., and L.O.O.C. are shareholders of AstraZeneca. D.I.J. receives funding for clinical trials and associated laboratory studies from AstraZeneca.
Author Contributions
C.F., C.P., T.A.C., J.W.T.Y., J.T.M., D.I.J., and A.C. wrote the manuscript. C.F. and T.A.C. designed the research. C.F., L.O.O.C., and A.S. performed the research. C.F. and L.O.O.C. analyzed the data.
Supporting information
Figure S1. Overall myelosuppression profile induced by one cycle of carboplatin 30 mg/kg.
Figure S2. Residuals.
Figure S3. Free platinum pharmacokinetics in rat and damage response.
Figure S4. Bone marrow status after several cycles of carboplatin is compromised.
Figure S5. Alternative scenarios for competitive feedback mechanisms.
Figure S6. Proliferation in immature transit cells result in relatively large oscillations in reticulocytes and platelets as experimentally observed.
Figure S7. Bifurcation plots and model oscillations.
Table S1. Designs of rat in vivo studies.
Table S2. Species‐specific drug sensitivity quantified with colony forming unit assays for both human and rat progenitor cells.
Table S3. Carboplatin pharmacokinetic model parameter values.
Table S4. Residual variability values.
Supplementary text.
Model code.
Supplementary References
References
- 1. Kurtin, S. Myeloid toxicity of cancer treatment. J Adv Pr. Oncol. 3, 209–224 (2012). [PMC free article] [PubMed] [Google Scholar]
- 2. Barreto, J.N. , McCullough, K.B. , Ice, L.L. & Smith, J.A. Antineoplastic agents and the associated myelosuppressive effects: a review. J. Pharm. Pract. 27, 440–446 (2014). [DOI] [PubMed] [Google Scholar]
- 3. Alberts, D. & Dorr, R. New perspectives on an old friend: optimizing carboplatin for the treatment of solid tumors. Oncologist 3, 15–34 (1998). [PubMed] [Google Scholar]
- 4. Jodrell, D.I. et al Relationships between carboplatin exposure and tumor response and toxicity in patients with ovarian cancer. J. Clin. Oncol. 10, 520–528 (1992). [DOI] [PubMed] [Google Scholar]
- 5. Schmitt, A. et al Factors for hematopoietic toxicity of carboplatin: refining the targeting of carboplatin systemic exposure. J. Clin. Oncol. 28, 4568–4574 (2010). [DOI] [PubMed] [Google Scholar]
- 6. Wang, L.D. & Wagers, A.J. Dynamic niches in the origination and differentiation of haematopoietic stem cells. Nat. Rev. Mol. Cell Biol. 12, 643–655 (2011). [DOI] [PMC free article] [PubMed] [Google Scholar]
- 7. Fornari, C. et al Understanding haematological toxicities with mathematical modelling. Clin Pharmacol Ther. 104, 644–654 (2018). [DOI] [PubMed] [Google Scholar]
- 8. Friberg, L.E. & Karlsson, M.O. Mechanistic models for myelosuppression. Invest. New Drugs 21, 183–194 (2003). [DOI] [PubMed] [Google Scholar]
- 9. Craig, M. Towards quantitative systems pharmacology models of chemotherapy‐induced neutropenia. CPT Pharmacometrics Syst. Pharmacol. 6, 293–304 (2017). [DOI] [PMC free article] [PubMed] [Google Scholar]
- 10. Mangas‐Sanjuan, V. , Buil‐Bruna, N. , Garrido, M.J. , Soto, E. & Trocóniz, I.F. Semimechanistic cell‐cycle type‐based pharmacokinetic/pharmacodynamic model of chemotherapy‐induced neutropenic effects of diflomotecan under different dosing schedules. J. Pharmacol. Exp. Ther. 354, 55–64 (2015). [DOI] [PubMed] [Google Scholar]
- 11. Bender, B.C. et al A population pharmacokinetic/pharmacodynamic model of thrombocytopenia characterizing the effect of trastuzumab emtansine (T‐DM1) on platelet counts in patients with HER2‐positive metastatic breast cancer. Cancer Chemother. Pharmacol. 70, 591–601 (2012). [DOI] [PubMed] [Google Scholar]
- 12. Henrich, A. et al Semimechanistic bone marrow exhaustion pharmacokinetic/pharmacodynamic model for chemotherapy‐induced cumulative neutropenia. J. Pharmacol. Exp. Ther. 362, 347–358 (2017). [DOI] [PubMed] [Google Scholar]
- 13. Friberg, L.E. , Sandström, M. & Karlsson, M.O. Scaling the time‐course of myelosuppression from rats to patients with a semi‐physiological model. Invest. New Drugs 28, 744–753 (2010). [DOI] [PubMed] [Google Scholar]
- 14. Kilkenny, C. , Browne, W.J. , Cuthill, I.C. , Emerson, M. & Altman, D.G. Improving bioscience research reporting: the ARRIVE guidelines for reporting animal research. PLoS Biol. 8, 94–99 (2010). [DOI] [PMC free article] [PubMed] [Google Scholar]
- 15. McGrath, J. & Lilley, E. Implementing guidelines on reporting research using animals (ARRIVE etc.): new requirements for publication in BJP. Br. J. Pharmacol. 172, 3189–3193 (2015). [DOI] [PMC free article] [PubMed] [Google Scholar]
- 16. Pujo‐Menjouet, L. Blood cell dynamics: half of a century of modelling. Math. Model. Nat. Phenom. 10, 182–205 (2015). [Google Scholar]
- 17. Friberg, L.E. , Henningsson, A. , Maas, H. , Nguyen, L. & Karlsson, M.O. Model of chemotherapy‐induced myelosuppression with parameter consistency across drugs. J. Clin. Oncol. 20, 4713–4721 (2002). [DOI] [PubMed] [Google Scholar]
- 18. Câmara De Souza, D. et al Transit and lifespan in neutrophil production: implications for drug intervention. J. Pharmacokinet Pharmacodyn. 45, 59–77 (2018). [DOI] [PubMed] [Google Scholar]
- 19. Patel, A. et al The fate and lifespan of human monocyte subsets in steady state and systemic inflammation. J. Exp. Med. 214, 1913–1923 (2017). [DOI] [PMC free article] [PubMed] [Google Scholar]
- 20. Dingli, D. & Pacheco, J.M. Allometric scaling of the active hematopoietic stem cell pool across mammals. PLoS ONE 1, 1–4 (2006). [DOI] [PMC free article] [PubMed] [Google Scholar]
- 21. Basso‐Ricci, L. et al Multiparametric Whole Blood Dissection: a one‐shot comprehensive picture of the human hematopoietic system. Cytom. Part A 91, 952–965 (2017). [DOI] [PMC free article] [PubMed] [Google Scholar]
- 22. Zandvliet, A.S. et al Population pharmacokinetic and pharmacodynamic analysis to support treatment optimization of combination chemotherapy with indisulam and carboplatin. Br. J. Clin. Pharmacol. 66, 485–497 (2008). [DOI] [PMC free article] [PubMed] [Google Scholar]
- 23. Bryder, D. , Rossi, D.J. & Weissman, I.L. Hematopoietic stem cells the paradigmatic tissue‐specific stem cell. Am. J. Pathol. 419, 338–346 (2006). [DOI] [PMC free article] [PubMed] [Google Scholar]
- 24. Eaves, C.J. Hematopoietic stem cells: concepts, definitions, and the new reality. Blood 125, 2605–2614 (2015). [DOI] [PMC free article] [PubMed] [Google Scholar]
- 25. Seita, J. & Weissman, I.L. Hematopoietic stem cell: self‐renewal versus differentiation. Wiley Interdiscip. Rev. Syst. Biol. Med. 2, 640–653 (2010). [DOI] [PMC free article] [PubMed] [Google Scholar]
- 26. Marciniak‐Czochra, A. , Stiehl, T. , Ho, A.D. , Jäger, W. & Wagner, W. Modeling of asymmetric cell division in hematopoietic stem cells regulation of self‐renewal is essential for efficient repopulation. Stem Cells Dev. 18, 377–385 (2009). [DOI] [PubMed] [Google Scholar]
- 27. Siddik, Z.H. , Newell, D.R. , Boxall, F.E. & Harrap, K.R. The comparative pharmacokinetics of carboplatin and cisplatin in mice and rats. Biochem. Pharmacol. 36, 1925–1932 (1987). [DOI] [PubMed] [Google Scholar]
- 28. Murry, D.J. Comparative clinical pharmacology of cisplatin and carboplatin. Pharmacotherapy 140S–145S (1997). [PubMed] [Google Scholar]
- 29. Woo, S. , Krzyzanski, W. & Jusko, W.J. Pharmacodynamic model for chemotherapy‐induced anemia in rats. Cancer Chemother. Pharmacol. 62, 123–133 (2008). [DOI] [PMC free article] [PubMed] [Google Scholar]
- 30. Knox, R.J. , Friedlos, D.A. & Lydall, J.J.R. . Mechanism of cytoxicity of anticancer Platinum drugs: evidence that cis‐Diamminedichloroplatinum(II) and cis‐Diammine‐(1,1‐cyclobutanedicarboxylato)platinum(II) differ only in the kinetics of their interaction with DNA.pdf. Cancer Res. 46, 1972–1979 (1986). [PubMed] [Google Scholar]
- 31. Collins, T.A. et al Translational modeling of drug‐induced myelosuppression and effect of pretreatment myelosuppression for AZD5153, a selective BRD4 inhibitor. CPT Pharmacometrics Syst. Pharmacol. 6, 357–364 (2017). [DOI] [PMC free article] [PubMed] [Google Scholar]
- 32. Kaefer, A. et al Mechanism‐based pharmacokinetic/pharmacodynamic meta‐analysis of navitoclax (ABT‐263) induced thrombocytopenia. Cancer Chemother. Pharmacol. 74, 593–602 (2014). [DOI] [PubMed] [Google Scholar]
- 33. Friberg, L.E. , Freijs, A. , Sandstrom, M. & Karlsson, M.O. Semiphysiological model for the time course of leukocytes after varying schedules of 5‐fluorouracil in rats. J. Pharmacol. Exp. Ther. 295, 734–740 (2000). [PubMed] [Google Scholar]
- 34. Juul, S. & Felderhoff‐Mueser, U. Epo and other hematopoietic factors. Semin. Fetal Neonatal. Med. 12, 250–258 (2007). [DOI] [PMC free article] [PubMed] [Google Scholar]
- 35. Dzierzak, E. & Philipsen, S. Erythropoiesis: development and differentiation. Cold Spring Harb. Perspect Med. 3, 1–16 (2013). [DOI] [PMC free article] [PubMed] [Google Scholar]
- 36. Manesso, E. , Teles, J. , Bryder, D. & Peterson, C. Dynamical modelling of haematopoiesis: an integrated view over the system in homeostasis and under perturbation. J. R. Soc. Interface 10, 20120817 (2013). [DOI] [PMC free article] [PubMed] [Google Scholar]
- 37. Whichard, Z. , Sarkar, C.A. , Kimmel, M. & Corey, S.J. Hematopoiesis and its disorders: a systems biology approach. Blood 115, 2339–2347 (2010). [DOI] [PMC free article] [PubMed] [Google Scholar]
- 38. Stroncek, D. et al Changes in blood counts after the administration of granulocyte‐colony‐stimulating factor and the collection of peripheral blood stem cells from healthy donors. Transfusion 36, 596–600 (1996). [DOI] [PubMed] [Google Scholar]
- 39. Quartino, A.L. , Karlsson, M.O. , Lindman, H. & Friberg, L.E. Characterization of endogenous G‐CSF and the inverse correlation to chemotherapy‐induced neutropenia in patients with breast cancer using population modeling. Pharm. Res. 31, 3390–3403 (2014). [DOI] [PubMed] [Google Scholar]
- 40. Grover, A. et al Erythropoietin guides multipotent hematopoietic progenitor cells toward an erythroid fate. J. Exp. Med. 211, 181–188 (2014). [DOI] [PMC free article] [PubMed] [Google Scholar]
- 41. Siddik, Z.H. , Boxall, F.E. & Harrap, K.R. Haematological toxicity of carboplatin in rats. Br. J. Cancer 55, 375–379 (1987). [DOI] [PMC free article] [PubMed] [Google Scholar]
- 42. Kuter, D.J. The physiology of platelet production. Stem Cells 14, 88–101 (1996). [DOI] [PubMed] [Google Scholar]
- 43. Paul, F. et al Transcriptional heterogeneity and lineage commitment in myeloid progenitors. Cell 163, 1663–1677 (2015). [DOI] [PubMed] [Google Scholar]
- 44. Wagers, A.J. & Weissman, I.L. Plasticity of adult stem cells. Cell 116, 639–648 (2004). [DOI] [PubMed] [Google Scholar]
- 45. So, E.Y. & Ouchi, T. Decreased DNA repair activity in bone marrow due to low expression of DNA damage repair proteins. Cancer Biol. Ther. 15, 1–5 (2014). [DOI] [PMC free article] [PubMed] [Google Scholar]
- 46. Schirm, S. , Engel, C. , Loeffler, M. & Scholz, M. A combined model of human erythropoiesis and granulopoiesis under growth factor and chemotherapy treatment. Theor. Biol. Med. Model. 11, 24 (2014). [DOI] [PMC free article] [PubMed] [Google Scholar]
- 47. Torisawa, Y. et al Bone marrow–on–a–chip replicates hematopoietic niche physiology in vitro. Nat. Methods 11, 663–669 (2014). [DOI] [PubMed] [Google Scholar]
- 48. Silva, A. , Anderson, A.R.A. & Gatenby, R. A multiscale model of the bone marrow and hematopoiesis. Math. Biosci. Eng. 8, 643–658 (2011). [DOI] [PMC free article] [PubMed] [Google Scholar]
- 49. Kang, K.S. & Trosko, J.E. Stem cells in toxicology: fundamental biology and practical considerations. Toxicol. Sci. 120, 269–289 (2010). [DOI] [PubMed] [Google Scholar]
- 50. Mettetal, J.T. Model‐informed reverse and forward translation of safety risks in drug development. Clin. Pharmacol. Ther. 103, 199–201 (2018). [DOI] [PubMed] [Google Scholar]
- 51. Calvert, A.H. et al Carboplatin dosage:prospective evaluation of a simple formula based on renal function. J. Clin. Oncol. 7, 1748–1756 (1989). [DOI] [PubMed] [Google Scholar]
Associated Data
This section collects any data citations, data availability statements, or supplementary materials included in this article.
Supplementary Materials
Figure S1. Overall myelosuppression profile induced by one cycle of carboplatin 30 mg/kg.
Figure S2. Residuals.
Figure S3. Free platinum pharmacokinetics in rat and damage response.
Figure S4. Bone marrow status after several cycles of carboplatin is compromised.
Figure S5. Alternative scenarios for competitive feedback mechanisms.
Figure S6. Proliferation in immature transit cells result in relatively large oscillations in reticulocytes and platelets as experimentally observed.
Figure S7. Bifurcation plots and model oscillations.
Table S1. Designs of rat in vivo studies.
Table S2. Species‐specific drug sensitivity quantified with colony forming unit assays for both human and rat progenitor cells.
Table S3. Carboplatin pharmacokinetic model parameter values.
Table S4. Residual variability values.
Supplementary text.
Model code.
Supplementary References