Significance
Mitochondrial superoxide dismutase (SOD2) has been established as a suppressor of tumor initiation. However, late-stage solid tumors display high levels of SOD2 expression. Here, we report that overexpression of SOD2 causes its accumulation in an acetylated form that increases mitochondrial reactive oxygen species as well as HIF2α activity. HIF2α is a potent promoter of cancer stem cell formation, which is largely responsible for treatment failure and metastatic recurrence of breast cancer. In agreement, we found increased SOD2 and HIF2α in metastatic lesions compared with primary tumors from the same patients. Taken together, our results indicate that the accumulation of acetylated SOD2 observed in late-stage cancer may drive cancer stem cell formation, contributing to tumor aggressiveness and poorer outcomes.
Keywords: breast cancer, stem cells, acetylation, SOD2, MnSOD
Abstract
Mitochondrial superoxide dismutase (SOD2) suppresses tumor initiation but promotes invasion and dissemination of tumor cells at later stages of the disease. The mechanism of this functional switch remains poorly defined. Our results indicate that as SOD2 expression increases acetylation of lysine 68 ensues. Acetylated SOD2 promotes hypoxic signaling via increased mitochondrial reactive oxygen species (mtROS). mtROS, in turn, stabilize hypoxia-induced factor 2α (HIF2α), a transcription factor upstream of “stemness” genes such as Oct4, Sox2, and Nanog. In this sense, our findings indicate that SOD2K68Ac and mtROS are linked to stemness reprogramming in breast cancer cells via HIF2α signaling. Based on these findings we propose that, as tumors evolve, the accumulation of SOD2K68Ac turns on a mitochondrial pathway to stemness that depends on HIF2α and may be relevant for the progression of breast cancer toward poor outcomes.
Cancer stem cells (CSC) represent a small but extremely relevant subpopulation of cells in tumors due to their capacity to self-renew, invade healthy tissues, and initiate tumors at distant organs. They are significantly more resistant to clinical interventions than bulk cells and are largely responsible for treatment failure, recurrence, and the metastasis of primary tumors (1–8). Hence, the identification of targetable pathways supporting CSC formation may have significant clinical impact. The tumor microenvironment changes as tumors grow, resulting in cellular adaptation to evolving new conditions, including hypoxia. The abnormal activation of hypoxia-inducible factors (HIFs) in tumors contributes to the acquisition of “stemness” by bulk cells in the tumor (9). HIF “alpha” subunits are continuously synthesized and degraded in the presence of oxygen. In hypoxia the stabilization of HIFα activates hypoxic signaling response. HIF1α and HIF2α share a common “β” partner subunit called HIF1β or ARNT. HIF1 and HIF2 transcription factors also share a number of redundant target genes (10). Although both promote CSC formation and amplification in cancer (11–14), mechanisms are distinct (reviewed in ref. 15). In the case of HIF2α reprogramming to stemness (14, 16–18) involves the (re)activation of Oct4, an HIF2-target gene that is essential for the maintenance of pluripotency during embryonic development (19) and CSC formation in cancer (20).
We found that in breast cancer cells expressing high SOD2 levels, HIF2α is stabilized, suggesting that SOD2 overexpression in advanced stage tumors may be involved in the evolution of cellular states prone to dedifferentiation and metastasis. In addition, we observed that the overexpression of SOD2 leads to its accumulation in an acetylated state that lacks antioxidant activity but promotes, instead, mitochondrial reactive oxygen species (ROS) production and the activation of HIF2α. Scavenging of mitochondrial H2O2 or suppression of HIF2α reduced SOD2-induced expression of stemness genes and CSC characteristics in breast cancer cells. Further, increasing acetylated SOD2, via the knockdown of sirtuin-3 deacetylase, promoted stem cell gene expression as well as the acquisition of stem cell characteristics by luminal estrogen receptor-positive epithelial cancer cell lines. Sirtuin-3 is the major deacetylase acting upon SOD2 in mitochondria (21, 22) and reducing its expression increased levels of SOD2 acetylation similarly to SOD2 overexpression. Based on these studies, we propose that it is SOD2K68Ac that stimulates the development of CSC and contributes to breast cancer progression to metastasis, helping to explain in part the dichotomous behavior of SOD2 that inhibits tumor initiation and yet promotes more aggressive cancer phenotypes at the later stages of the disease.
Results
Increased SOD2 Promotes Hypoxia- and Stem Cell-Associated Gene Expression.
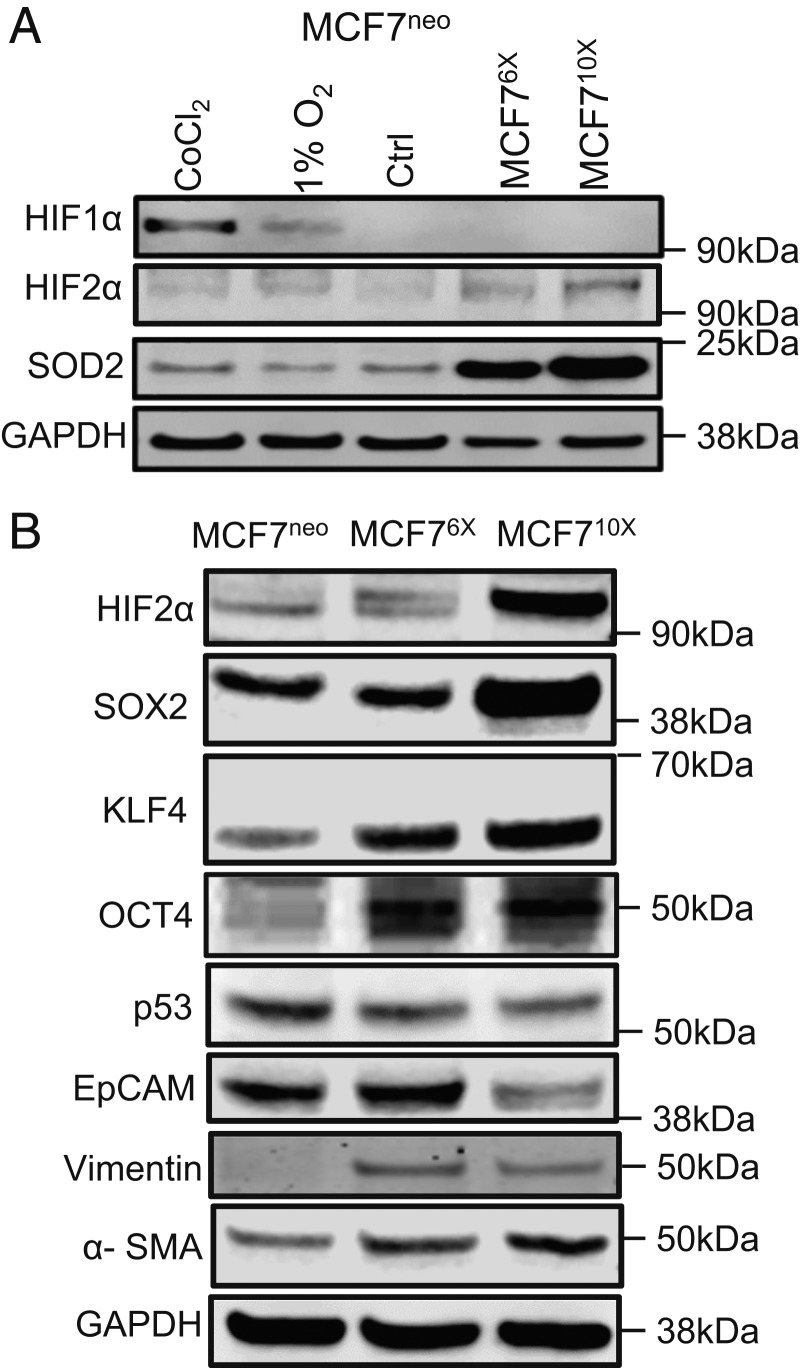
It has been found that SOD2 expression is higher in breast cancer compared to noncancerous parental tissue (23). This increase is particularly evident in tumors of higher histologic and clinical grade (24). Recent studies have also indicated that SOD2 may play an active role in the phenotypic transition of cancer toward more invasive, drug-resistant, and prometastatic phenotypes (25–27). The mechanisms involved are unclear. Hence, we obtained a collection of epithelial breast cancer cells based on the MCF7 cell line, stably expressing SOD2 at different levels (28) (i.e., 6-fold and 10-fold higher than wild-type cells, referred heretofore as MCF76X and MCF710X, respectively). Genome-wide messenger RNA (mRNA) expression comparing MCF710X against vector control, MCF7neo, showed that higher SOD2 levels increased the expression of genes associated with ROS metabolism, hypoxia, and epithelial-to-mesenchymal transition (EMT) (SI Appendix, Fig. S1A). Genes involved in each of these pathways were randomly selected for validation using qRT-PCR (SI Appendix, Fig. S2A). Because ROS (29) and hypoxia (30, 31) can promote EMT via either HIF1α or HIF2α stabilization, we next focused on determining if SOD2 overexpression selectively effected a specific type of hypoxic signaling. Western blot analysis showed an increase in HIF2α protein levels in MCF76X and MCF710X that rose proportionally to increases in SOD2 expression (Fig. 1A and SI Appendix, Fig. S1B). Both protein (SI Appendix, Fig. S1C) and HIF2α mRNA (SI Appendix, Fig. S1D) levels increased with SOD2 up-regulation. HIF1α protein was also analyzed but in our hands SOD2 up-regulation failed to stabilize HIF1α in MCF7 cells (Fig. 1A), consistent with previous reports that indicated SOD2 suppresses hypoxia-induced HIF1α stabilization when overexpressed (32, 33). While both HIF1α and HIF2α have been implicated in CSC reprogramming (11–14), HIF2α is uniquely positioned as an upstream regulator of Oct4 (34, 35), a bona fide stemness factor that contributes to somatic cell reprogramming to pluripotency (36). Consistent with the idea that SOD2 up-regulation promotes stem cell factor expression via HIF2α signaling, Fig. 1B showed increased Oct4 as well as additional stem cell/pluripotency genes such as Sox2 and KLF4, in clones expressing high SOD2 levels. This was consistent with suppression of epithelial differentiation marker, EpCAM, and a parallel rise in mesenchymal cell markers such as vimentin and α-SMA. In turn, the expression of the tumor suppressor factor p53 (Fig. 1B and SI Appendix, Fig. S1C), shown to hinder stem cell reprogramming (37), was slightly reduced by SOD2 up-regulation in MCF710X. We also verified if SOD2 affected phosphatase and tensin homolog (PTEN), a tumor-suppressor pathway independent of HIF2 signaling. Data shown in SI Appendix, Figs. S2B and S2C indicated that PTEN expression, oxidation status, or activity (assessed using Akt1 phosphorylation as a proxy) are not affected by SOD2. These results support a model whereby SOD2 up-regulation promotes breast cancer dedifferentiation via stabilization of HIF2α and the transcription of stem cell-associated gene expression.
Fig. 1.
SOD2 activates HIF2α and stem cell reprogramming. (A) Western blot analysis of HIFα subunits in cells expressing different levels of SOD2. MCF7neo are control MCF7 cells expressing a neomycin resistance cassette. MCF76X and MCF710X are single clones expressing ∼6- and 10-fold higher SOD2 levels than parental MCF7 cells. (B) Western blot analysis of pluripotency/“stem cell” markers including Oct4, SOX2, and KLF4 as well as phenotypic markers including epithelial (EpCAM) and mesenchymal (α-SMA and vimentin). B also shows Western blot results for levels of expression of the tumor suppressor p53 in MCF7 cells. Figures are representative of at least 3 independent biological replicates.
Elevated SOD2 Expression Supports CSC Function and Transcriptional Reprogramming.
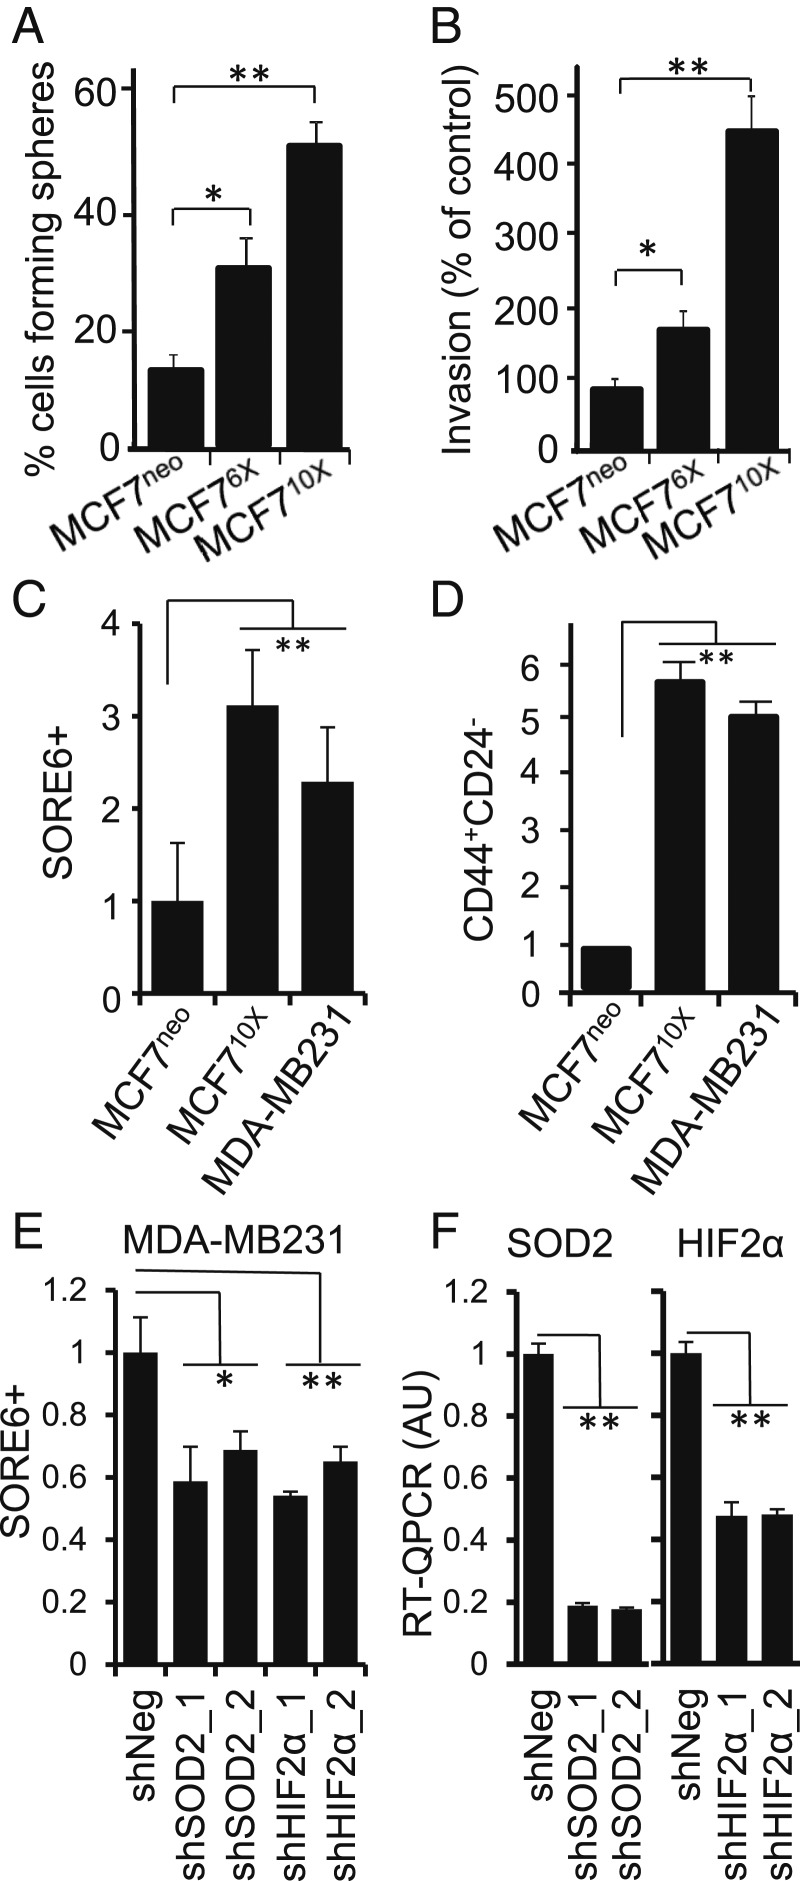
Consistent with other studies (38, 39), we observed that increased SOD2 led to profound changes in cellular phenotype including increased anchorage-independent growth of MCF76X as well as MCF710X compared with control MCF7neo (Fig. 2A) and invasiveness of cells grown in Matrigel (Fig. 2B). These functional changes are consistent with reports that SOD2 promotes anoikis resistance (39) and invasiveness (40), characteristics frequently observed in CSC.
Fig. 2.
SOD2 promotes the expansion of the CSC population. (A) Up-regulation of SOD2 expression promotes mammosphere formation shown as percent of cells capable of forming colonies when plated as single cells per well in a 5% Matrigel suspension. (B) Up-regulation of SOD2 increases invasiveness of MCF7 clones plated on Matrigel in a transwell invasion assay. The number of invading cells was normalized per MCF7neo (MCF7) control. Errors represent ± SD. (C) Quantification of SORE6+ cells in MCF7neo, MCF710X as well as MDA-MB231. Results are averages of at least 3 independent flow cytometry experiments. Errors represent ± SD. (D) Flow cytometry quantification of CD44+/CD24− after staining of the membrane markers. (E) Effect of silencing either SOD2 or HIF2α on the counts of SORE6+ cells in the MDA-MB231 cell line. (F) Knocking down SOD2 and HIF2α expression in MDA-MB231 cells measured by qRT-PCR. **P < 0.01 and *P < 0.05.
The functional changes, combined with our observation of stem cell-associated gene expression in Fig. 1 and SI Appendix, Fig. S1, led us to examine transcriptional reprogramming more directly. We used a recently developed reporter that detects the functional activity of the stem cell-associated transcription factors, Oct4 and Sox2. This is accomplished by assaying for a destabilized green fluorescent protein (GFP) gene whose expression is driven by the SORE6 promoter (41). The expression of SOD2 in MCF710X resulted in an increase of SORE6+ cells (Fig. 2C and SI Appendix, Fig. S3). The population of SORE6+ cells in MCF710X was comparable to that seen in MDA-MB231 cells (Fig. 2C), an estrogen receptor-negative breast cancer line that shows high percentage of CSC-like cells compared to MCF7 at baseline (34). In addition to SORE6 activity, we also saw an increased percentage of cells with surface marker expression characteristic of breast CSC (i.e., CD44+/CD24−) in MCF710X and MDA-MB231, compared with MCF7neo controls (Fig. 2D). Consistent with MCF7s, 2 other estrogen receptor-positive epithelial breast cancer cell lines, T47D and ZR75.1, showed a significant increase in SOD2K68Ac, HIF2α, and the percentage of CD44+/CD24− CSC-like cells when SOD2 expression is enforced (SI Appendix, Fig. S4 A–D). We also performed loss-of-function analysis in MDA-MB231 cells by knocking down SOD2 or HIF2α expression using 2 independent constructs (Fig. 2 E and F). Suppressing either SOD2 or HIF2α reduced the SORE6+ cell subpopulation by ∼50% (Fig. 2 E and F). These results indicate SOD2 overexpression contributes to the expansion of cells exhibiting CSC characteristics, including surface marker expression, and behavior.
Acetylated SOD2 promotes stemness reprogramming.
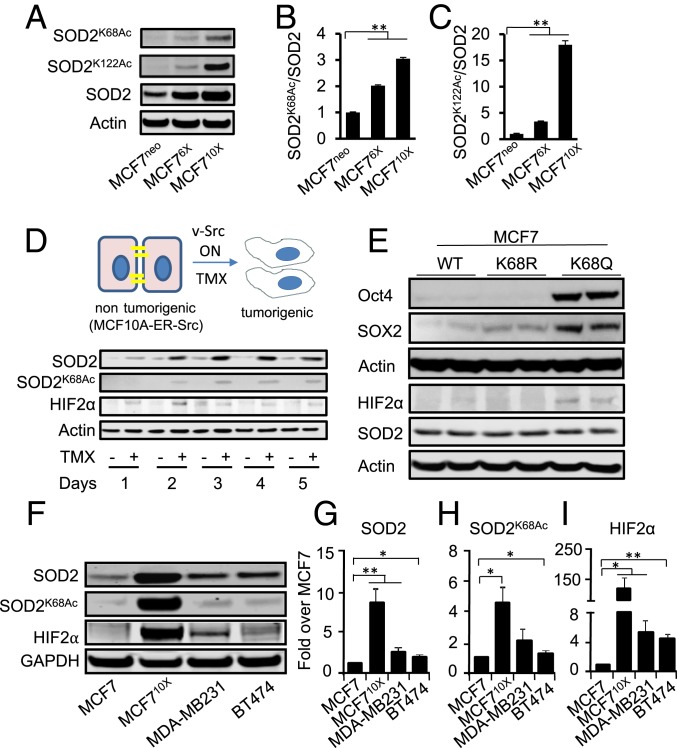
Acetylation of SOD2 has been receiving considerable attention as a mechanism promoting aggressive forms of breast cancer (27, 42). We observed increased acetylation on lysines 68 and 122 (SOD2K68Ac and SOD2K122Ac) by Western blot with increasing levels of SOD2 expression in MCF7 cells (Fig. 3 A–C). Using a model of malignant transformation, we also noted an increase in SOD2K68Ac as cells transitioned from nontransformed MCF10A to transformed cells (43). Indeed, the induced activation of oncogenic v-Src increased SOD2 protein, SOD2K68Ac levels, and HIF2α (Fig. 3D). All 3 were clearly observable within 48 h of v-Src activation. Also, SOD2 constructs with Lys68 mutated to mimic acetylation (K68Q) or block it (K68R) (27, 44) were used to test if acetylation was required for HIF2α stabilization. Expression of comparable levels of the acetyl-mimetic (SOD2K68Q), wild-type, and acetyl-resistant (SOD2K68R) showed that only SOD2K68Q was able to induce higher HIF2α, Oct4, and Sox2 in MCF7 cells. In contrast, the acetyl-resistant mutant, SOD2K68R, did not affect Oct4 or HIF2α protein levels (Fig. 3E, quantification in SI Appendix, Fig. S5A), although it slightly increased Sox2. In addition, the expression of SOD2K68Q increased the population of SORE6+ cells in MCF7 cells while SOD2K68R did not (SI Appendix, Fig. S5B). The link between SOD2 acetylation and HIF2α stabilization was further confirmed in a mouse model of aggressive mammary tumorigenesis (MMTV.PyVT). MMTV.PyVT tumors are highly aggressive and metastasize to the lung in 80 to 90% of the tumor-bearing female mice (45). As shown in SI Appendix, Fig. S5C PyVT tumors had increased levels of SOD2K68Ac and HIF2α despite comparable levels of total SOD2, indicating that SOD2K68Ac is required for HIF2α activation. Consistently, the RNA-sequencing comparison between SOD2K68Q and SOD2K68R showed that cells expressing SOD2K68Q have a transcriptomic signature more consistent with that of less differentiated cancer cells than those expressing SOD2K68R, as indicated by increased expression of members of the Wnt (WNT2) and Sox (Sox15) family of transcription factors directly involved in dedifferentiation (SI Appendix, Fig. S6). Data obtained from additional cancer cell lines, T47D, ZR75.1, MDA-MB231, and BT474 are consistent with the conclusion that high levels of acetylated SOD2K68Ac lead to the stabilization of HIF2α, and an increase in the percentage of cells with CSC characteristics in an array of different breast cancer cell types (SI Appendix, Fig. S4 and Figs. 2E and 3 F–I).
Fig. 3.
SOD2 acetylation at Lys68 promotes stemness. (A) Western blot analysis of lysines K68 and K122 acetylation analyzed by Western blot in MCF7neo, MCF76X and MCF710X cells. (B and C) Quantification of results shown in A was performed by first normalizing SOD2 total levels per β-actin to correct for differences in loading. Results shown in the figure represent Ac-SOD2 levels normalized per the SOD2/β-actin ratio. (D) Western blot analysis of levels of SOD2, SOD2K68Ac, and HIF2α in MCF10A-ER-vSrc cells transitioning to a cancer phenotype after activation of the oncogenic v-Src construct using hydroxy-tamoxifen. (E) Effect of expressing either the acetyl mimetic (SOD2K68Q) or acetyl-resistant (SOD2K68R) mutants on the expression of core stem cell/pluripotency factors (Sox2 and Oct4) as well as HIF2α stabilization. (F) HIF2α as well as SOD2K68Ac accumulate in aggressive cancer cell lines with high SOD2 expression at baseline. The figure is a representative of 3 independent experiments. Quantification of SOD2 (G), SOD2K68Ac (H), and HIF2α (I) normalized over GAPDH in F. Errors represent ± SD. *P < 0.05 and **P < 0.01.
SOD2 Deacetylation Reduces CSC Subpopulation in Breast Cancer Cell Lines.
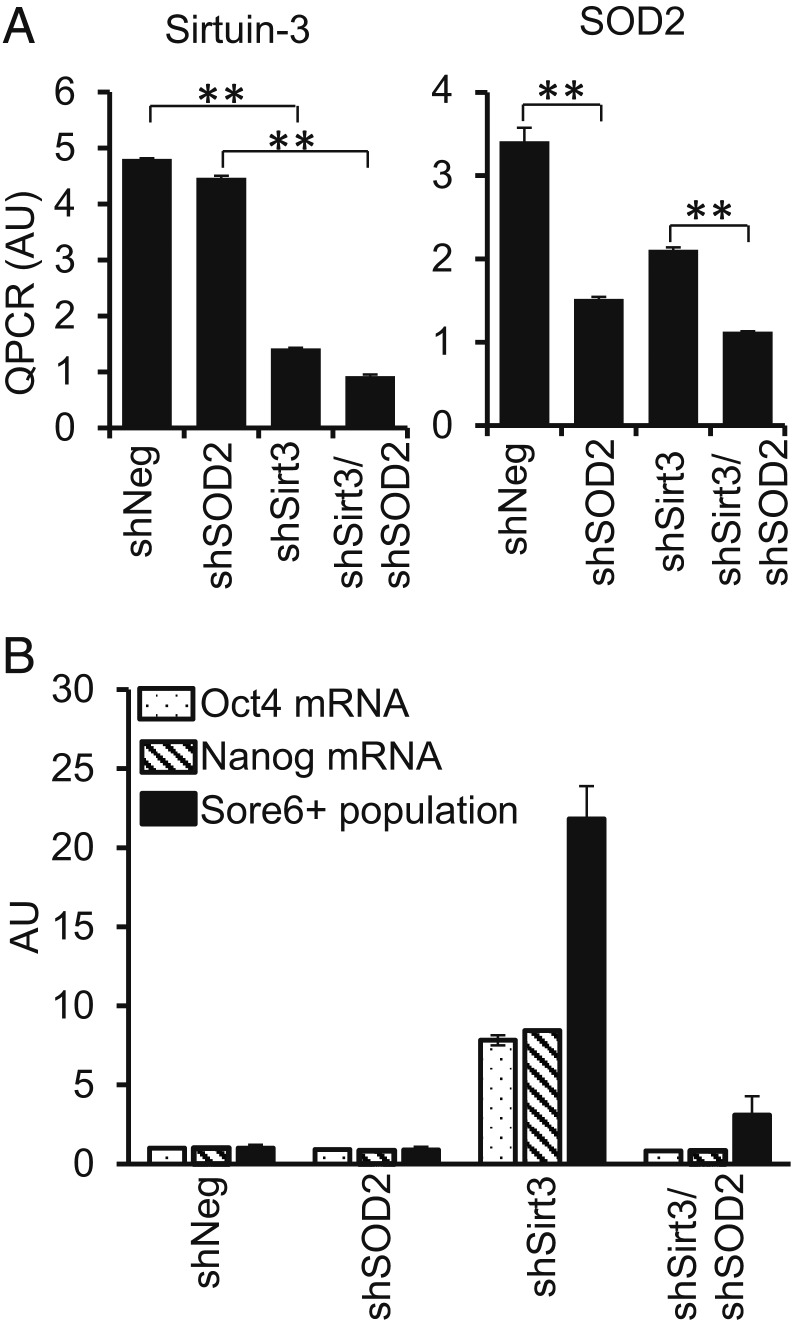
Sirtuin-3 (Sirt3) has been reported to be the major deacetylase of SOD2 in mitochondria (46), so we tested if silencing it would increase acetylated SOD2 and CSC numbers. Knockdown of Sirt3 increased levels of Oct4, Nanog, and SORE6+ cells in a manner that was blocked by simultaneous knockdown of SOD2 (Fig. 4). Silencing of Sirt3 was associated with an increase in the fraction of SOD2 that was acetylated and the expression of HIF2α (SI Appendix, Fig. S7 A and B) but, interestingly, led to a decrease in the total levels of SOD2, reinforcing the idea that SOD2K68Ac is required for HIF2α stabilization independently of the total SOD2 levels. In addition, silencing Sirt3 led to an increase in H2O2 level (SI Appendix, Fig. S7 C and D), consistent with previous observations (47). We also tried to reduce SOD2 acetylation, a process that involves both enzyme-catalyzed and catalysis-independent mechanisms (48), For this we silenced GCN5L1, a mitochondrial acetyl transferase (49) (SI Appendix, Fig. S7E). Knocking GCN5L1 down reduced SOD2K68Ac while conserving total SOD2 protein levels (SI Appendix, Fig. S7 F and G). The reduction in SOD2K68Ac by GCN5L1 knockdown paralleled a reduction in Oct4 and Nanog expression (SI Appendix, Fig. S7 H and I) as well as the CSC population measured with SORE6 reporter (SI Appendix, Fig. S7J). While CSC reprogramming is critically dependent on SOD2, these results suggest that it is not the level of SOD2 expression per se, but rather the fraction of the protein that is acetylated that affects “stemness” reprogramming.
Fig. 4.
Sirtuin-3 knockdown promotes stem cell gene expression as CSC in a manner dependent on SOD2. (A) qRT-PCR analysis of Sirtuin-3 or SOD2 mRNA after knockdown using short hairpin RNA (shRNA) in MCF7 cells. **P < 0.01. (B) qRT-PCR analysis of of Oct4 and Nanog mRNA levels as well as numbers of SORE6+ CSC (measure by flow cytometry) following Sirtuin-3, SOD2, or double Sirt3/SOD2 knockdown. The values are normalized against random control shRNA (shNeg). P < 0.01 for the comparison between shNeg and shSirt3 or between shSirt3 and shSirt3/shSOD2. Representative of 2 independent experiments with 2 biological replicates for mRNA qRT-PCR and 4 biological replicates each for SORE6 flow cytometry.
SOD2 Mediates HIF2α Accumulation and CSC Reprogramming through H2O2.
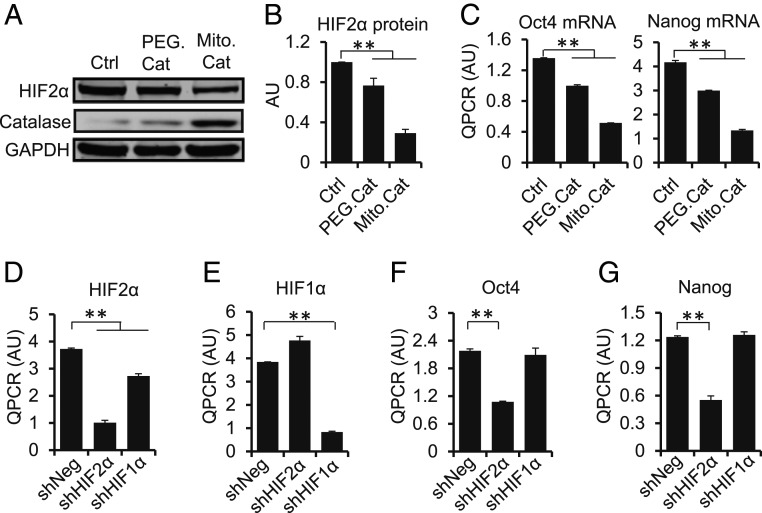
We next examined if mitochondria-generated H2O2 was involved in HIF2α stabilization. For this, we treated MCF710X cells with the H2O2-scavenging enzyme catalase, either using a cell-permeable pegylated polyethylene glycol (PEG)–catalase, or by expressing a mitochondrially targeted mutant catalase using an adenoviral vector. Both increased catalase activity in cells (SI Appendix, Fig. S8A) and significantly attenuated HIF2α accumulation (Fig. 5 A and B), as well as Oct4 and Nanog expression (Fig. 5C). These parameters paralleled a reduction in the capacity of the cells to invade Matrigel (SI Appendix, Fig. S8B). Results were further confirmed by treating MCF710X cells with either EUK134, a synthetic SOD2 and catalase mimetic, or EUK8, which only exhibits SOD2 activity. While EUK134 reduced colony formation in soft agar and the mRNA level of Oct4 and Nanog (SI Appendix, Fig. S8 C–F), EUK8 did not, indicating the need of catalase activity for effectiveness as a stem cell suppressor. Silencing HIF2α (but not HIF1α) in MCF710X recapitulated the effect of catalase in reducing the expression of Oct4 and Nanog (Fig. 5 E–G). We also overexpressed other H2O2-scavenging mitochondria-localized enzymes, such as Prx3 and Gpx4, but did not see an effect on Oct4 and Nanog (SI Appendix, Fig. S8 G–J). This is maybe due to reduced cellular levels of their substrates thioredoxin (23) and reduced glutathione (GSH) (SI Appendix, Fig. S8K) observed in MCF7 cells overexpressing SOD2. These findings further indicate that acetylated SOD2 activates stemness reprogramming via H2O2-dependent HIF2α stabilization.
Fig. 5.
Inhibition of mitochondrial H2O2 with catalase decreases stem cell marker expression. (A) Incubation of MCF710X with cell-permeable catalase (PEG-cat) or transfection with a mitochondrial-targeted catalase (Mito-Cat) construct decreases HIF2α accumulation. (B) Quantification of A using averages of 3 independent experiments. (C) qRT-PCR analysis of the effect of catalase on the mRNA expression level of 2 critical stem cell markers, Oct4 and Nanog. (D and E) The extent of silencing of HIF1α or HIF2α achieved in MCF710X cells as well as the impact of short hairpin RNA (shRNA) targeting one HIFα on the expression levels of the other. (F and G) qRT-PCR analysis of the effect of silencing either HIF2α or HIF1α on the levels of Oct4 and Nanog mRNA expression in MCF710X cells. Errors represent ± SD of 2 independent experiments composed by 3 biological replicates each. **P < 0.01.
Elevated SOD2 Expression Promotes Tumorigenesis and the Engraftment of Breast Cancer Cells In Vivo.
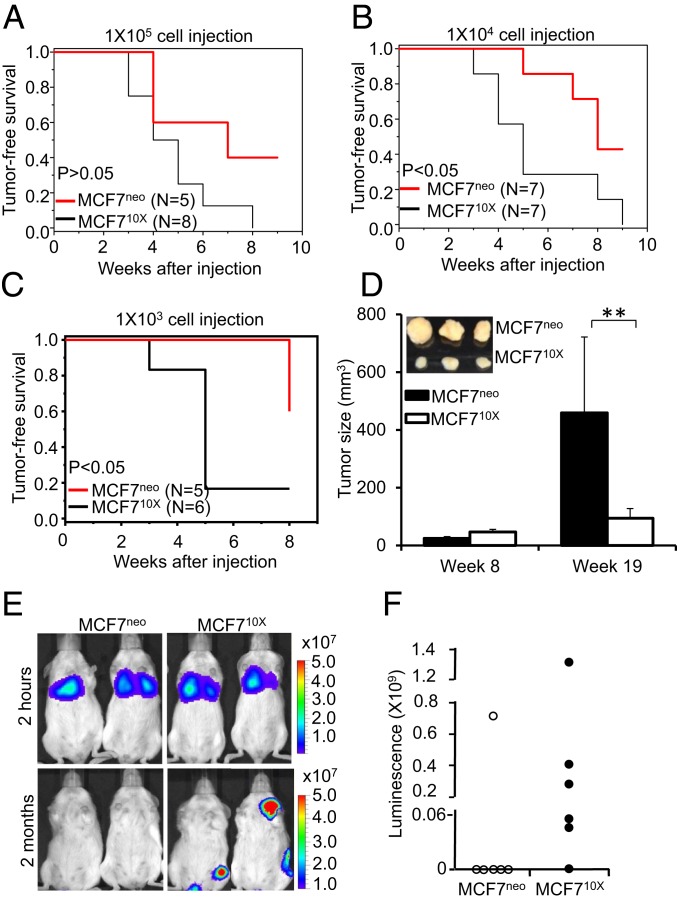
We assessed 2 different in vivo models to determine if SOD2 overexpression promotes tumor aggressiveness. We analyzed a xenograft implant model in the mammary fat pad to assess the capacity of SOD2-overexpressing cells to establish tumors and an intravenous (i.v.) injection model to assess metastatic potential. MCF710X cells established tumors when injected at a significantly lower density in NSG mice (Fig. 6 A–C), although interestingly SOD2 expression appeared to slow tumor growth once established, as reflected by reduced individual tumor sizes (Fig. 6D). Luciferase-expressing cells were used to demonstrate that i.v. introduced MCF710X cells were detectable after 2 mo at significantly higher rates (5 of 6 mice) than MCF7 controls (1 of 6 mice) despite similar burdens after cell administration (Fig. 6 E and F). These results are in agreement with previous reports that SOD2 suppresses cell proliferation (50), as evidenced by the smaller tumor volumes observed in Fig. 6D. Despite this change in growth rates, SOD2 overexpression supports significantly higher rates of tumor establishment, survival, and dissemination.
Fig. 6.
SOD2 promotes tumorigenicity, dissemination, and persistence of cancer cells in mice. Tumor formation assay in NSG mice after the s.c. implantation of 105 (A), 104 (B), or 103 (C) of MCF7neo and MCF710X cells indicates that MCF710X is more tumorigenic than control MCF7neo. (D) Tumors formed from s.c. xenografted MCF7neo or MCF710X cells (104) harvested at week 8 and week 19. (Inset) Tumor sizes at week 19. Errors represent ± SD. **P < 0.01. (E) Luciferin-assisted imaging of disseminated tumors formed from i.v. injected cells expressing luciferase. Measurements were performed 2 mo after initial tail-vein injection of either 3 × 10⁶ MCF7neo or MCF710X cells. Imaging at 2 h indicates that the load of cells accumulating in lungs immediately after injection was comparable in the case of MCF7neo- and MCF710X-injected mice. Representative images are shown. (F) Relative luminescence quantification of images shown in E at 2 mo.
Elevated SOD2 Expression and Acetylation Occur in Metastatic Tissue from Patients.
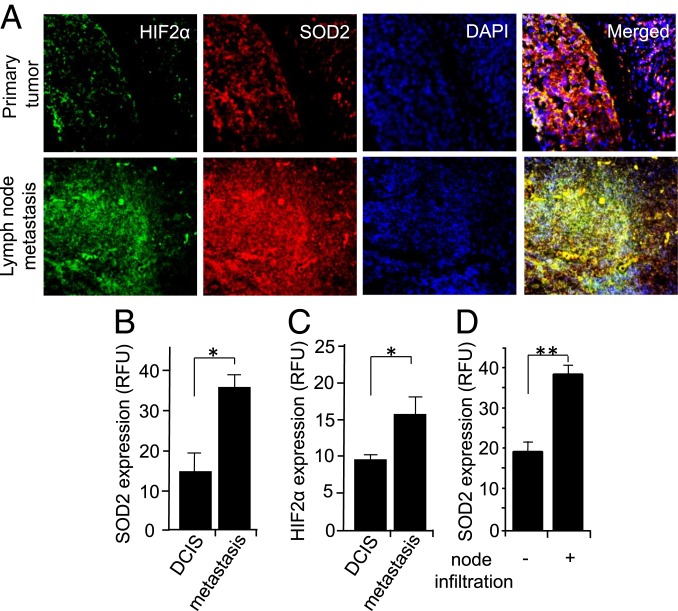
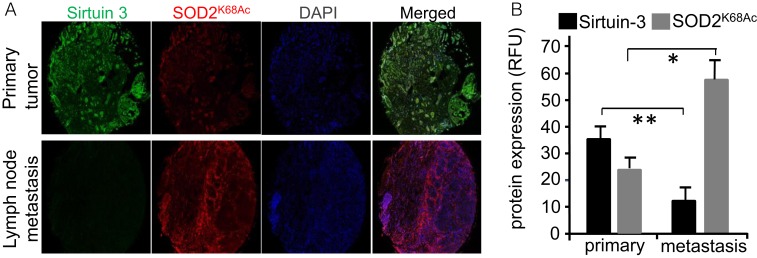
We next determined if our findings from animal and cell experiments corresponded to cancer in patient populations. We analyzed the expression of SOD2 and HIF2α using immunofluorescence and determined that both were significantly increased in lymph node metastatic lesions compared to primary tumors from the same patients (Fig. 7 A–C). We also noted larger numbers of cells coexpressing SOD2 and HIF2α (yellow cells in the “Merged” channel) in images of metastatic tissue (Fig. 7A, Lower) compared with primary tumors (Fig. 7A, Upper). In addition, SOD2 levels were higher in primary tumors from patients with positive lymph node infiltration as compared to those from patients whose lymph nodes were negative (Fig. 7D). A separate analysis found elevated SOD2 acetylation and reduced Sirtuin-3 expression in metastatic lesions compared to primary tumor tissue as well (Fig. 8). Combined, these data are consistent with a molecular signaling pathway promoting tumor aggressiveness, particularly metastasis, through elevated SOD2 expression, acetylation (SOD2K68Ac), and HIF2α stabilization in breast cancer.
Fig. 7.
SOD2 and HIF2α are enriched in metastasis compared to primary tumors from the same patients. (A) Micrographs of primary tumor and metastatic tumors stained for HIF2α (green) and SOD2 (red). (B and C) Quantification of A. (D) Analysis of SOD2 expression in the primary tumors of patients with and without breast cancer infiltration into lymph nodes. Errors represent ± SD. n = 9. *P < 0.05 and **P < 0.01. Representative images are shown.
Fig. 8.
SOD2K68Ac is increased in lymph node metastases compared to primary tumors in the same patient. (A) Representative immunofluorescence micrographs of Sirtuin-3 and SOD2K68Ac stained breast cancer tissue from the matched primary tumor and lymph node metastases from the same patients. Samples were analyzed using a Vectra automated imaging system. (B) Quantification of Sirtuin-3 and SOD2K68Ac from 10 different unselected breast cases with available lymph node metastatic tissue. Fluorescence intensities were determined by image analysis using ImageJ software. Errors represent ± SD. *P < 0.05 and **P < 0.01.
Discussion
Our studies using cell lines, in vivo xenograft models, and human tumor tissue from patients with metastatic lesions show that SOD2 expression in human breast cancer cells drastically changes the transcriptional programming and phenotype of transformed cells. Our results agree with previous studies supporting a role for SOD2 in tumor evolution toward more aggressive phenotypes (23, 24, 39, 51, 52). However, this idea of a metastasis-promoting function has been difficult to reconcile with the well-established concept that SOD2 suppresses the growth of malignant cells. Based on findings presented here, we propose that this apparent dichotomy can be explained, at least in part, by a gain of function of the acetylated SOD2 form associated with high-grade, aggressive tumors. The past few years have seen accumulating evidence that SOD2 is regulated by posttranslational modifications (PTM) (42, 46, 53) and displays noncanonical biochemical activities [i.e., peroxidase (54)] that may be conferred by these PTMs. Acetylation of lysine 68 has received attention as a major driver of SOD2 function as a dismutase of superoxide (42, 55). We hypothesize that the increase in SOD2K68Ac during tumor progression switches SOD2 from a suppressor of malignant transformation to a factor that promotes less-differentiated (thus more aggressive) tumor phenotypes via the activation of specific types of hypoxia-induced responses (i.e., HIF2). Accordingly, we found that the elevated SOD2 expression levels in both breast cancer cell lines and tumor tissues results in the accumulation of SOD2K68Ac. SOD2K68Ac occurred at baseline in highly tumorigenic cell lines with elevated SOD2 expression and higher levels were detected in metastatic lesions compared with tissue from primary tumors in the same patients. These results suggest that the acetylation of SOD2 promotes stemness. This idea is supported by our finding that silencing Sirt3 promotes the accumulation of SOD2K68Ac and triggers stemness reprogramming, although it is noted thatSirt3 silencing led to reduced SOD2 expression levels which could have contributed to affect stemness reprogramming. Because of this, additional experiments with silencing GCN5L1 acetyl transferase were performed. Silencing GCN5L1 dampened SOD2K68Ac and reduced the expression of stem cell genes (i.e., Oct4 and Nanog) as well as the number of breast CSC. As shown before, cells that accumulate SOD2 and its acetylated form SOD2K68Ac are more invasive and better at resisting anoikis (25, 40, 56), consistent with a stem cell phenotype. Taken together with data shown here, SOD2 overexpression leading to the accumulation SOD2K68Ac appears to promote transitions to less-differentiated cellular phenotypes that are associated with dissemination or metastatic recurrence in breast cancer.
In agreement with this idea, we found that acetylation at lysine 68 of SOD2 and catalase-sensitive H2O2 were both required for HIF2α stabilization, a well-established predictor of breast cancer metastasis (57). This is consistent with a model where SOD2K68Ac contributes to the increase in mitochondria-generated H2O2, whether directly or indirectly, leading to HIF2α stabilization, which is itself reported to promote the expression of stem cell-associated genes like Oct4, Sox2, and Nanog (14, 58). We found that silencing HIF2α or quenching H2O2 using a mitochondrially targeted catalase (or EUK134) led to significant reductions in the expression of stemness factors and the number of SORE6+ CSC. We also observed HIF2α and SOD2 in metastatic lesions were expressed at higher levels and more frequently coexpressed compared to primary tumor sites. We propose that this SOD2/HIF2α axis is a likely mechanism and possible signature for tumor cells with high metastatic potential.
It is noteworthy that other HIF-driven pathways to stemness have been reported. For example, the Wicha group showed that HIF1α promotes stemness in breast cancer cells that display an ALDEFLUOR+ phenotype and originate from epithelial lineages, while CD44+/CD24− CSC tend to originate from mesenchymal backgrounds (59). They also reported in a more recent study that mesenchymal and epithelium-like CSC rely on distinct metabolic and oxidative stress pathways for survival and proliferation regulated by AMPK/ROS and HIF1α (60). In an earlier study, our group reported that the overexpression of SOD2, which we now know results in the accumulation of SOD2K68Ac, promotes glycolysis and the activation of AMPK in breast cancer cells (23). Taken together, our previous and current studies as well as these findings from the Wicha group suggest that SOD2 and its acetylated form, SOD2K68Ac, may function as a metabolism-sensitive switch in mitochondria critical for the determination the type of hypoxia-induced response (HIF1- or HIF2-dependent) that is triggered during cancer evolution. In our observations, SOD2-overexpressing cells display CD44+/CD24− (Fig. 2D and SI Appendix, Fig. S4), suggesting that the SOD2/HIF2α pathway could promote “stemness” of cells dedifferentiating from a mesenchymal background, an idea that is supported by our findings of activated EMT gene transcription (SI Appendix, Fig. S1A). In addition, it has been shown that SOD2 suppresses HIF1α stabilization induced by hypoxia (33), further supporting the proposition that SOD2K68Ac may act as a switch to activate HIF2-driven hypoxic signaling.
Reinforcing these conclusions a recently published study (27) presented strong evidence indicating that acetylated SOD2 loses dismutase activity but gains peroxidase activity that could amplify oxidative damage to mitochondria and the generation of ROS (54). Zhu et al. (27) also showed that SOD2K68Ac endows breast cancer cells with the ability to resist tamoxifen via increasing H2O2. Resistance to chemotherapy is a well-established characteristic of CSC. Taken together with the studies presented here, findings to date indicate that SOD2K68Ac may be a key factor affecting treatment responses and outcomes in breast cancer because of its involvement in somatic cell reprogramming to CSC-like phenotypes.
Methods
Animal Studies.
All mouse experimentation was conducted in accordance with standard operating procedures approved by the Animal Care Facility of the University of Illinois at Chicago, the Medical College of Wisconsin, and the National Institute of Environmental Health Sciences. NOD-Scid IL2Rgammanull (NSG) mice and FVB/MMTV-PyVT mice were acquired from The Jackson Laboratory. For subcutaneous (s.c.) xenograft, 25 μL cells were mixed with 75 μL Matrigel matrix (Corning Life Sciences) and injected into the inguinal mammary fat pad of the female NSG mice at 6 to 8 wk of age. The diameters of tumor were measured with a digital caliper, and the tumor volume in cubic millimeters was calculated using the formula (length × width2/2). For tail-vein injection, 3 million MCF7neo and MCF710X cells transduced with lentiviral vector expressing luciferase (61) were resuspended in 200 μL PBS and injected into female NSG mice at 6 to 8 wk of age. Imaging of grafted tumors was performed using an IVIS in vivo imager (PerkinElmer) after i.p. injection of RediJect D-Luciferin Bioluminescent Substrate (PerkinElmer) within 2 h and after 2 mo after injection.
Cell Culture.
MCF-7 cells stably expressing SOD2 under β-actin promoter from pHβApr-1 vector (MCF76X, MCF710X) or control cells with empty vector (MCF7neo) were a gift from Larry Oberley, Iowa City, IA. The MCF10A-ER-vSrc cell line was a generous gift from Kevin Struhl, Harvard University, Cambridge, MA. Transformation was induced with 4-HO-tamoxifen (1 µM).
Invasion Assay, the Anchorage-Independent Growth Assay, and Soft Agar Colony Assay.
For invasion assay (62), Matrigel (BD Bioscience) was mixed with the culture medium (1:8) and 100 µL of the mixture was laid over the membrane insert (Corning) placed on top of a 12-well companion plate (Corning). The Matrigel mix was left undisturbed overnight in a CO2 incubator. Then, 5,000 cells in 700 µL medium were added on top of the insert and additional 500 µL of medium with 20% fetal bovine serum (FBS) was added into the companion well below the inserts. After 16 h of culturing, the supernatant and Matrigel in the insert were removed. The invading cells on the membrane were stained with hematoxylin/eosin and counted under microscope. Anchorage-independent growth was performed by resuspending 1,000 cells in media mixed with Matrigel (5% vol/vol). The cell suspension was then placed in low-adherence plates and cultured over a period of 21 d. Colonies were counted using a Celigo Cell Cytometer by Nexcelom Bioscience. Soft agar colony formation assay followed previously published protocols (63). Briefly, 5,000 cells in 0.3% noble agar were laid on top of 0.5% noble agar in a 6-well plate. After 21 d of culture with addition of 200 µL medium on top of the agar every other day, colonies bigger than 70 µm diameter were counted under a microscope.
SORE6 Reporter Assay and CD44/CD24 Marker Analysis.
CD44 and CD24 were analyzed by staining of paraformaldehyde-fixed cells using APC-conjugated mouse anti-human CD44 antibodies (560890; BD Pharmingen) and PE-conjugated mouse anti-human CD24 (560991; BD Pharmingen) used according to instructions provided by the manufacturer. Cells were analyzed using a flow cytometer instrument LSRII equipped with FlowJo software. SORE6 reporter was used to detect CSC by transducing cells with lentiviral vector expressing GFP or mCherry expressed under the SORE6 promoter according to previously published protocols (41).
H2O2 Measurement and Catalase Activity Assay.
Amplex Red Hydrogen Preroxide/Peroxidase/Assay kit (Invitrogen) was used to measure H2O2 level released by cells in the cell culture medium without FBS according to protocols published by the manufacturer. Mitochondrial H2O2 level was measured with MitoB by sample processing reported previously (64) and analyzed according to the published protocol (65) in the Redox and Bioenergetics Shared Resource in the Medical College of Wisconsin. Catalase activity assay was performed using the same kit to quantify catalase activity using a standard catalase activity curve.
Vector Preparation and Cell Transduction.
Adenoviral vector expressing mitochondria-targeted catalase (mt-catalase) was a generous gift from J. Andres Melendez, The State University of New York, Albany. Cells were seeded onto 6-well dishes and allowed to grow overnight to ∼75% confluence and incubated with mt-catalase (1 × 10⁷ viral particles) in Opti-Mem (Life Technologies) for 3 d. For silencing SOD2, HIF1α, or HIF2α, the corresponding lentiviral vectors were produced using pGIPZ shRNA plasmids (Dharmacon) (61), titered by GFP flow cytometry, and used to transduce cells with a multiplicity of infection of 2 for 2 to 3 d. Stem cell reporter SORE6 prolentiviral plasmids (SORE6-mCMV-dsCopGFP-Puro and SORE6-mCMV-dsmCherry-Puro) and the control plasmids (mCMV-dsCopGFP-Puro and mCMV-dsmCherry-Puro) were packaged and used as in ref. 41. Lenti-SOD2 plasmid was used for site-directed mutagenesis, that is, K68 to arginine or glutamine (27). Lentiviral vectors expressing Prx3 and Gpx4 were from Origene.
qRT-PCR.
Total RNA was isolated using the RNeasy Mini Kit (Qiagen). Random complementary DNA (cDNA) was synthesized using High Capacity cDNA Reverse Transcription kit (Applied Biosystem). Quantitative PCR was performed on an Applied Biosystems Quantstudio 6 Flex Real-Time PCR System using Fast SYBR Green Master Mix (Applied Biosystems). Quantification of the amplification product was carried out using as ΔΔCt using glyceraldehyde-3-phosphate dehydrogenase (GAPDH) as endogenous controls for normalization. The primer sequences are included in SI Appendix, Table S1.
Western Blot Analysis.
Western blot was performed on cell lysates to identify changes in protein expression. Briefly, cell lysates in RIPA buffer containing protease inhibitor mixture (Sigma-Aldrich) was separated on sodium dodecyl sulfate polyacrylamide gel electrophoresis gel and transferred to nitrocellulose membranes. After incubation with primary antibodies and IRdye secondary antibodies (LI-COR), the membrane was imaged on imaging station Odyssey FC (LI-COR). The primary antibodies were anti-SOD2 (ab13533; Abcam), anti-SOD2K68Ac (ab137037; Abcam), anti-HIF1α (79233; Cell Signaling), anti-Oct4 (ab181557; Abcam), anti-Sox2 (ab97959; Abcam), anti-KLF4 (ab129473; Abcam), anti-HIF2α (NB100-122; Novus Biologicals), and GAPDH (sc25778; Santa Cruz Biotechnology).
Fluorescent Immunohistochemistry.
Tissue microarrays TMA-Br1503d and TMA-Br10010c were purchased from US Biomax. Following rehydration, antigen retrieval was performed using 20 mM sodium citrate in a decloaking chamber. Antibodies were used at the following dilutions (SOD2, 1:100; HIF2α, 1:100; Sirtuin-3, 1:100; and SOD2K68Ac 1:50; Abcam) overnight at 4 °C.
Statistical Analysis.
Statistical analysis was conducted using GraphPad InStat (GraphPad). One-way ANOVA with post hoc t test were used for determining significance between groups. Pearson’s correlation coefficient was used to determine the significance of correlation between SOD2 and HIF2α fluorescence. Significance for differences in cell or patient samples was verified using z-test.
Supplementary Material
Acknowledgments
We thank Drs. Kristine Ansenberger-Fricano, Micaela Vargas, and Kraig Thierault for preliminary studies done in the early phases of this project and Ms. Kelly Dille and Mr. Ram Patel for technical assistance. We acknowledge funding from US Department of Defense awards 67263-RT-REP and 911NF-07-R-0003-04 to M.G.B. and 5RO1HL125356, 7RO1AI131267, 1RO1CA216882, and 1R01ES028149 to M.G.B. D. Gius is supported by National Cancer Institute grants 2R01CA152601, 1R01CA152799, 1R01CA168292, and 1R01CA214025, the Avon Foundation for Breast Cancer Research, the Lynn Sage Cancer Research Foundation, the Zell Family Foundation, and the Chicago Biomedical Consortium, as well the Searle Funds at The Chicago Community Trust. We also acknowledge the contributions of the anonymous reviewers for their thorough review of this study and suggestions that much improved this study.
Footnotes
The authors declare no competing interest.
This article is a PNAS Direct Submission.
See Commentary on page 23376.
This article contains supporting information online at www.pnas.org/lookup/suppl/doi:10.1073/pnas.1902308116/-/DCSupplemental.
References
- 1.Friedmann-Morvinski D., Verma I. M., Dedifferentiation and reprogramming: Origins of cancer stem cells. EMBO Rep. 15, 244–253 (2014). [DOI] [PMC free article] [PubMed] [Google Scholar]
- 2.Korkaya H., Liu S., Wicha M. S., Breast cancer stem cells, cytokine networks, and the tumor microenvironment. J. Clin. Invest. 121, 3804–3809 (2011). [DOI] [PMC free article] [PubMed] [Google Scholar]
- 3.Duru N., et al. , HER2-associated radioresistance of breast cancer stem cells isolated from HER2-negative breast cancer cells. Clin. Cancer Res. 18, 6634–6647 (2012). [DOI] [PMC free article] [PubMed] [Google Scholar]
- 4.Cao Z., et al. , Molecular checkpoint decisions made by subverted vascular niche transform indolent tumor cells into chemoresistant cancer stem cells. Cancer Cell 31, 110–126 (2017). [DOI] [PMC free article] [PubMed] [Google Scholar]
- 5.Shafee N., et al. , Cancer stem cells contribute to cisplatin resistance in Brca1/p53-mediated mouse mammary tumors. Cancer Res. 68, 3243–3250 (2008). [DOI] [PMC free article] [PubMed] [Google Scholar]
- 6.Mateo F., et al. , Stem cell-like transcriptional reprogramming mediates metastatic resistance to mTOR inhibition. Oncogene 36, 2737–2749 (2017). [DOI] [PMC free article] [PubMed] [Google Scholar]
- 7.Guo W., et al. , Slug and Sox9 cooperatively determine the mammary stem cell state. Cell 148, 1015–1028 (2012). [DOI] [PMC free article] [PubMed] [Google Scholar]
- 8.Lawson D. A., et al. , Single-cell analysis reveals a stem-cell program in human metastatic breast cancer cells. Nature 526, 131–135 (2015). [DOI] [PMC free article] [PubMed] [Google Scholar]
- 9.Keith B., Simon M. C., Hypoxia-inducible factors, stem cells, and cancer. Cell 129, 465–472 (2007). [DOI] [PMC free article] [PubMed] [Google Scholar]
- 10.Keith B., Johnson R. S., Simon M. C., HIF1α and HIF2α: Sibling rivalry in hypoxic tumour growth and progression. Nat. Rev. Cancer 12, 9–22 (2011). [DOI] [PMC free article] [PubMed] [Google Scholar]
- 11.Conley S. J., et al. , CRLX101, an investigational camptothecin-containing nanoparticle-drug conjugate, targets cancer stem cells and impedes resistance to antiangiogenic therapy in mouse models of breast cancer. Breast Cancer Res. Treat. 150, 559–567 (2015). [DOI] [PubMed] [Google Scholar]
- 12.Lan J., et al. , Hypoxia-inducible factor 1-dependent expression of adenosine receptor 2B promotes breast cancer stem cell enrichment. Proc. Natl. Acad. Sci. U.S.A. 115, E9640–E9648 (2018). [DOI] [PMC free article] [PubMed] [Google Scholar]
- 13.Kitajima S., et al. , Hypoxia-inducible factor-2 alpha up-regulates CD70 under hypoxia and enhances anchorage-independent growth and aggressiveness in cancer cells. Oncotarget 9, 19123–19135 (2018). [DOI] [PMC free article] [PubMed] [Google Scholar]
- 14.Lee S. B., et al. , An ID2-dependent mechanism for VHL inactivation in cancer. Nature 529, 172–177 (2016). [DOI] [PMC free article] [PubMed] [Google Scholar]
- 15.Mazumdar J., Dondeti V., Simon M. C., Hypoxia-inducible factors in stem cells and cancer. J. Cell Mol. Med. 13, 4319–4328 (2009). [DOI] [PMC free article] [PubMed] [Google Scholar]
- 16.Kondo K., Kim W. Y., Lechpammer M., Kaelin W. G. Jr, Inhibition of HIF2alpha is sufficient to suppress pVHL-defective tumor growth. PLoS Biol. 1, E83 (2003). [DOI] [PMC free article] [PubMed] [Google Scholar]
- 17.Li Z., et al. , Hypoxia-inducible factors regulate tumorigenic capacity of glioma stem cells. Cancer Cell 15, 501–513 (2009). [DOI] [PMC free article] [PubMed] [Google Scholar]
- 18.Pietras A., et al. , HIF-2alpha maintains an undifferentiated state in neural crest-like human neuroblastoma tumor-initiating cells. Proc. Natl. Acad. Sci. U.S.A. 106, 16805–16810 (2009). [DOI] [PMC free article] [PubMed] [Google Scholar]
- 19.Bertout J. A., Patel S. A., Simon M. C., The impact of O2 availability on human cancer. Nat. Rev. Cancer 8, 967–975 (2008). [DOI] [PMC free article] [PubMed] [Google Scholar]
- 20.Chiou S. H., et al. , Coexpression of Oct4 and Nanog enhances malignancy in lung adenocarcinoma by inducing cancer stem cell-like properties and epithelial-mesenchymal transdifferentiation. Cancer Res. 70, 10433–10444 (2010). [DOI] [PubMed] [Google Scholar]
- 21.Kim H. S., et al. , SIRT3 is a mitochondria-localized tumor suppressor required for maintenance of mitochondrial integrity and metabolism during stress. Cancer Cell 17, 41–52 (2010). [DOI] [PMC free article] [PubMed] [Google Scholar]
- 22.Chen Y., et al. , Tumour suppressor SIRT3 deacetylates and activates manganese superoxide dismutase to scavenge ROS. EMBO Rep. 12, 534–541 (2011). [DOI] [PMC free article] [PubMed] [Google Scholar]
- 23.Hart P. C., et al. , MnSOD upregulation sustains the Warburg effect via mitochondrial ROS and AMPK-dependent signalling in cancer. Nat. Commun. 6, 6053 (2015). [DOI] [PMC free article] [PubMed] [Google Scholar]
- 24.Dhar S. K., Tangpong J., Chaiswing L., Oberley T. D., St Clair D. K., Manganese superoxide dismutase is a p53-regulated gene that switches cancers between early and advanced stages. Cancer Res. 71, 6684–6695 (2011). [DOI] [PMC free article] [PubMed] [Google Scholar]
- 25.Hemachandra L. P., et al. , Mitochondrial superoxide dismutase has a protumorigenic role in ovarian clear cell carcinoma. Cancer Res. 75, 4973–4984 (2015). [DOI] [PMC free article] [PubMed] [Google Scholar]
- 26.Wang W., et al. , Hexokinase 2 enhances the metastatic potential of tongue squamous cell carcinoma via the SOD2-H2O2 pathway. Oncotarget 8, 3344–3354 (2017). [DOI] [PMC free article] [PubMed] [Google Scholar]
- 27.Zhu Y., et al. , Lysine 68 acetylation directs MnSOD as a tetrameric detoxification complex versus a monomeric tumor promoter. Nat. Commun. 10, 2399 (2019). [DOI] [PMC free article] [PubMed] [Google Scholar]
- 28.Zhang H. J., et al. , Activation of matrix metalloproteinase-2 by overexpression of manganese superoxide dismutase in human breast cancer MCF-7 cells involves reactive oxygen species. J. Biol. Chem. 277, 20919–20926 (2002). [DOI] [PubMed] [Google Scholar]
- 29.Schieber M. S., Chandel N. S., ROS links glucose metabolism to breast cancer stem cell and EMT phenotype. Cancer Cell 23, 265–267 (2013). [DOI] [PubMed] [Google Scholar]
- 30.Iovanna J. L., Marks D. L., Fernandez-Zapico M. E., Urrutia R., Mechanistic insights into self-reinforcing processes driving abnormal histogenesis during the development of pancreatic cancer. Am. J. Pathol. 182, 1078–1086 (2013). [DOI] [PMC free article] [PubMed] [Google Scholar]
- 31.Semenza G. L., Hypoxia-inducible factors: Mediators of cancer progression and targets for cancer therapy. Trends Pharmacol. Sci. 33, 207–214 (2012). [DOI] [PMC free article] [PubMed] [Google Scholar]
- 32.Wang M., et al. , Manganese superoxide dismutase suppresses hypoxic induction of hypoxia-inducible factor-1alpha and vascular endothelial growth factor. Oncogene 24, 8154–8166 (2005). [DOI] [PubMed] [Google Scholar]
- 33.Kaewpila S., Venkataraman S., Buettner G. R., Oberley L. W., Manganese superoxide dismutase modulates hypoxia-inducible factor-1 alpha induction via superoxide. Cancer Res. 68, 2781–2788 (2008). [DOI] [PMC free article] [PubMed] [Google Scholar]
- 34.Petruzzelli R., Christensen D. R., Parry K. L., Sanchez-Elsner T., Houghton F. D., HIF-2α regulates NANOG expression in human embryonic stem cells following hypoxia and reoxygenation through the interaction with an Oct-Sox cis regulatory element. PLoS One 9, e108309 (2014). [DOI] [PMC free article] [PubMed] [Google Scholar]
- 35.Kuo Y. C., et al. , IGF-1R promotes symmetric self-renewal and migration of alkaline Phosphatase+ germ stem cells through HIF-2α-OCT4/CXCR4 loop under Hypoxia. Stem Cell Reports 10, 524–537 (2018). [DOI] [PMC free article] [PubMed] [Google Scholar]
- 36.Takahashi K., Yamanaka S., Induction of pluripotent stem cells from mouse embryonic and adult fibroblast cultures by defined factors. Cell 126, 663–676 (2006). [DOI] [PubMed] [Google Scholar]
- 37.Chang C. J., et al. , p53 regulates epithelial-mesenchymal transition and stem cell properties through modulating miRNAs. Nat. Cell Biol. 13, 317–323 (2011). [DOI] [PMC free article] [PubMed] [Google Scholar]
- 38.Quiros-Gonzalez I., Sainz R. M., Hevia D., Mayo J. C., MnSOD drives neuroendocrine differentiation, androgen independence, and cell survival in prostate cancer cells. Free Radic. Biol. Med. 50, 525–536 (2011). [DOI] [PubMed] [Google Scholar]
- 39.Kamarajugadda S., et al. , Manganese superoxide dismutase promotes anoikis resistance and tumor metastasis. Cell Death Dis. 4, e504 (2013). [DOI] [PMC free article] [PubMed] [Google Scholar]
- 40.Connor K. M., et al. , Manganese superoxide dismutase enhances the invasive and migratory activity of tumor cells. Cancer Res. 67, 10260–10267 (2007). [DOI] [PubMed] [Google Scholar]
- 41.Tang B., et al. , A flexible reporter system for direct observation and isolation of cancer stem cells. Stem Cell Reports 4, 155–169 (2015). [DOI] [PMC free article] [PubMed] [Google Scholar]
- 42.Zou X., Santa-Maria C. A., O’Brien J., Gius D., Zhu Y., Manganese superoxide dismutase acetylation and dysregulation, due to loss of SIRT3 activity, promote a luminal B-like breast carcinogenic-permissive phenotype. Antioxid. Redox Signal. 25, 326–336 (2016). [DOI] [PMC free article] [PubMed] [Google Scholar]
- 43.Hirsch H. A., Iliopoulos D., Tsichlis P. N., Struhl K., Metformin selectively targets cancer stem cells, and acts together with chemotherapy to block tumor growth and prolong remission. Cancer Res. 69, 7507–7511 (2009). [DOI] [PMC free article] [PubMed] [Google Scholar]
- 44.Schwer B., Bunkenborg J., Verdin R. O., Andersen J. S., Verdin E., Reversible lysine acetylation controls the activity of the mitochondrial enzyme acetyl-CoA synthetase 2. Proc. Natl. Acad. Sci. U.S.A. 103, 10224–10229 (2006). [DOI] [PMC free article] [PubMed] [Google Scholar]
- 45.Guy C. T., Cardiff R. D., Muller W. J., Induction of mammary tumors by expression of polyomavirus middle T oncogene: A transgenic mouse model for metastatic disease. Mol. Cell. Biol. 12, 954–961 (1992). [DOI] [PMC free article] [PubMed] [Google Scholar]
- 46.Tao R., et al. , Sirt3-mediated deacetylation of evolutionarily conserved lysine 122 regulates MnSOD activity in response to stress. Mol. Cell 40, 893–904 (2010). [DOI] [PMC free article] [PubMed] [Google Scholar]
- 47.Torrens-Mas M., Hernández-López R., Oliver J., Roca P., Sastre-Serra J., Sirtuin 3 silencing improves oxaliplatin efficacy through acetylation of MnSOD in colon cancer. J. Cell. Physiol. 233, 6067–6076 (2018). [DOI] [PubMed] [Google Scholar]
- 48.Dikalov S. I., Dikalova A. E., Crosstalk between mitochondrial hyperacetylation and oxidative stress in vascular dysfunction and hypertension. Antioxid. Redox Signal. 31, 710–721 (2019). [DOI] [PMC free article] [PubMed] [Google Scholar]
- 49.Scott I., Webster B. R., Li J. H., Sack M. N., Identification of a molecular component of the mitochondrial acetyltransferase programme: A novel role for GCN5L1. Biochem. J. 443, 655–661 (2012). [DOI] [PMC free article] [PubMed] [Google Scholar]
- 50.Weydert C. J., et al. , Overexpression of manganese or copper-zinc superoxide dismutase inhibits breast cancer growth. Free Radic. Biol. Med. 41, 226–237 (2006). [DOI] [PubMed] [Google Scholar]
- 51.Kim Y. S., Gupta Vallur P., Phaëton R., Mythreye K., Hempel N., Insights into the dichotomous regulation of SOD2 in cancer. Antioxidants (Basel) 6, E86 (2017). [DOI] [PMC free article] [PubMed] [Google Scholar]
- 52.Liu Z., et al. , Manganese superoxide dismutase induces migration and invasion of tongue squamous cell carcinoma via H2O2-dependent Snail signaling. Free Radic. Biol. Med. 53, 44–50 (2012). [DOI] [PMC free article] [PubMed] [Google Scholar]
- 53.Candas D., et al. , CyclinB1/Cdk1 phosphorylates mitochondrial antioxidant MnSOD in cell adaptive response to radiation stress. J. Mol. Cell Biol. 5, 166–175 (2013). [DOI] [PMC free article] [PubMed] [Google Scholar]
- 54.Ansenberger-Fricano K., et al. , The peroxidase activity of mitochondrial superoxide dismutase. Free Radic. Biol. Med. 54, 116–124 (2013). [DOI] [PMC free article] [PubMed] [Google Scholar]
- 55.Lu J., et al. , Novel mechanisms for superoxide-scavenging activity of human manganese superoxide dismutase determined by the K68 key acetylation site. Free Radic. Biol. Med. 85, 114–126 (2015). [DOI] [PubMed] [Google Scholar]
- 56.Ye H., et al. , Proteomic based identification of manganese superoxide dismutase 2 (SOD2) as a metastasis marker for oral squamous cell carcinoma. Cancer Genomics Proteomics 5, 85–94 (2008). [PMC free article] [PubMed] [Google Scholar]
- 57.Helczynska K., et al. , Hypoxia-inducible factor-2alpha correlates to distant recurrence and poor outcome in invasive breast cancer. Cancer Res. 68, 9212–9220 (2008). [DOI] [PubMed] [Google Scholar]
- 58.Covello K. L., et al. , HIF-2alpha regulates oct-4: Effects of hypoxia on stem cell function, embryonic development, and tumor growth. Genes Dev. 20, 557–570 (2006). [DOI] [PMC free article] [PubMed] [Google Scholar]
- 59.Liu S., et al. , Breast cancer stem cells transition between epithelial and mesenchymal states reflective of their normal counterparts. Stem Cell Reports 2, 78–91 (2013). [DOI] [PMC free article] [PubMed] [Google Scholar]
- 60.Luo M., et al. , Targeting breast cancer stem cell state equilibrium through modulation of redox signaling. Cell Metab. 28, 69–86.e6 (2018). [DOI] [PMC free article] [PubMed] [Google Scholar]
- 61.He C., et al. , Lentiviral protein delivery of meganucleases in human cells mediates gene targeting and alleviates toxicity. Gene Ther. 21, 759–766 (2014). [DOI] [PubMed] [Google Scholar]
- 62.Albini A., Tumor and endothelial cell invasion of basement membranes. The matrigel chemoinvasion assay as a tool for dissecting molecular mechanisms. Pathol. Oncol. Res. 4, 230–241 (1998). [DOI] [PubMed] [Google Scholar]
- 63.Borowicz S., et al. , The soft agar colony formation assay. J. Vis. Exp., e51998 (2014). [DOI] [PMC free article] [PubMed] [Google Scholar]
- 64.Zielonka J., et al. , Mitigation of NADPH oxidase 2 activity as a strategy to inhibit peroxynitrite formation. J. Biol. Chem. 291, 7029–7044 (2016). [DOI] [PMC free article] [PubMed] [Google Scholar]
- 65.Cochemé H. M., et al. , Using the mitochondria-targeted ratiometric mass spectrometry probe MitoB to measure H2O2 in living Drosophila. Nat. Protoc. 7, 946–958 (2012). [DOI] [PubMed] [Google Scholar]
Associated Data
This section collects any data citations, data availability statements, or supplementary materials included in this article.


