Abstract
Background:
Chronic lesion activity driven by smoldering inflammation is a pathological hallmark of progressive forms of multiple sclerosis (MS).
Objective:
To develop a method for automatic detection of slowly expanding/evolving lesions (SELs) on conventional brain magnetic resonance imaging (MRI) and characterize such SELs in primary progressive MS (PPMS) and relapsing MS (RMS) populations.
Methods:
We defined SELs as contiguous regions of existing T2 lesions showing local expansion assessed by the Jacobian determinant of the deformation between reference and follow-up scans. SEL candidates were assigned a heuristic score based on concentricity and constancy of change in T2- and T1-weighted MRIs. SELs were examined in 1334 RMS patients and 555 PPMS patients.
Results:
Compared with RMS patients, PPMS patients had higher numbers of SELs (p = 0.002) and higher T2 volumes of SELs (p < 0.001). SELs were devoid of gadolinium enhancement. Compared with areas of T2 lesions not classified as SEL, SELs had significantly lower T1 intensity at baseline and larger decrease in T1 intensity over time.
Conclusion:
We suggest that SELs reflect chronic tissue loss in the absence of ongoing acute inflammation. SELs may represent a conventional brain MRI correlate of chronic active MS lesions and a candidate biomarker for smoldering inflammation in MS.
Keywords: Chronic active lesions, progressive multiple sclerosis, relapsing multiple sclerosis, slowly expanding/evolving lesions, smoldering plaques
Introduction
Conventional brain magnetic resonance imaging (MRI) provides reliable markers of acute inflammatory activity but has a low sensitivity and specificity for those tissue changes that characterize the (chronic) progressive phase of multiple sclerosis (MS). Identifying new or substantially enlarging T2 lesions, as done in clinical trials, is a marker for acute focal inflammation in MS, but does not capture the subtler chronic evolution of persistent T2 lesions. One of the neuropathological hallmarks of chronic inflammation in MS has been described as chronic active lesions or smoldering plaques. While acute MS plaques predominate in early relapsing MS (RMS) patients and are the likely substrate of clinical attacks, pathologically defined smoldering plaques are more prominent in progressive MS patients (12%–28% of plaques)1,2 and may expand as a result of sustained inflammatory processes driven by a rim of iron-laden microglia/macrophages.1–5 Chronic inflammation sheltered behind a partially or non-disrupted blood–brain barrier (BBB) is increasingly considered a signature of progressive MS.5
Histopathologically, smoldering lesions are characterized by an inactive center with no or few macrophages, surrounded by a rim of activated microglia/macrophages which contribute to chronic axonal damage and demyelination, and are thought to slowly evolve over the long term.2,6
The largest analysis of histopathological lesion phenotypes in MS (2476 white matter plaques from 120 patients) showed that smoldering plaques were mainly seen in patients with disease duration beyond 10 years, and peaked at approximately 20 years of disease duration and in patients of 50 years of age.2,7
There is no consensus about the reliable in vivo detection of chronic active or smoldering lesions. The identification of paramagnetic rims on high-resolution T2* and phase MRI using 7T or even 3T appears to be a promising avenue.8 We developed a method to identify and quantify change over time in chronic active lesions characterized by constant enlargement using only conventional T1-weighted and T2-weighted MRI data. The OPERA I, OPERA II, and ORATORIO phase III clinical trial data sets of patients with relapsing and primary progressive forms of MS were used to develop an algorithm based on longitudinal changes in conventional MRIs for detection of areas of chronic evolution in existing T2 lesions. Within these slowly expanding/evolving lesions (SELs), we investigated T1 gadolinium (Gd) enhancement and temporal evolution of T1-weighted signals. Throughout this manuscript, the use of the term “chronic active” lesions is to be considered independent of the underlying pathological lesion classification as defined by Kuhlmann et al.9 and is solely based on MRI properties of SELs.
Materials and methods
Trial design and patients
SELs were determined in the pooled population of the two identical phase III, multicenter, randomized, double-blind, double-dummy, parallel-group OPERA I and OPERA II trials (OPERA I/NCT01247324 and OPERA II/NCT01412333), and in the phase III, randomized, placebo-controlled, double-blind, multicenter ORATORIO trial (NCT01194570). Study details have been reported previously.10,11 Methods for brain MRI acquisition are described in Supplementary Material.
The OPERA I, OPERA II, and ORATORIO trial populations were pooled (N = 2388) to assess T1-weighted Gd enhancement in SELs, non-SELs, and new focal T2 lesions. T1-weighted signal intensity in SELs and the prevalence of SELs were assessed in the pooled population of OPERA I and OPERA II (RMS population) and in ORATORIO (primary progressive MS (PPMS) population). Algorithm development and SEL identification were performed blinded to treatment and clinical outcome, but not to study membership. The T1-weighted signal was normalized using least-trimmed squares over time for a given patient, followed by tissue-based normalization, where 0 and 1 values represent median T1 signal intensities of normal-appearing gray matter and normal-appearing white matter, respectively.
Identification of SELs
Prior to identification of SELs, T2 lesions were identified in baseline scans using a semi-automated method, where a fully automated segmentation12 was subsequently manually reviewed and corrected by trained MRI readers. SELs were then identified as a fraction of pre-existing T2 lesions undergoing positive local volume change consistent with gradual and constant radial expansion. These regions could correspond to discrete T2 lesions or to regions within a confluent lesion mass. SELs were detected at a follow-up timepoint with respect to a reference timepoint; any intermediate scans between reference and follow-up were also considered. Identification of SELs was done as a two-stage process. First, Jacobian analysis was used to identify SEL candidates, corresponding to contiguous regions of a T2 lesion undergoing local expansion, and second, individual SEL candidates were heuristically scored, to favor those undergoing concentric and constant change, consistent with gradual inside-out radial expansion.
Jacobian analysis
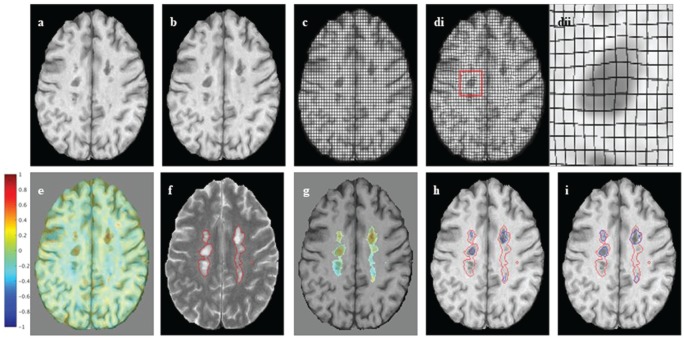
Jacobian analysis is based on computing the Jacobian determinant of the non-linear deformation field between a reference and follow-up scan and can be used to detect and quantify subtle change on a per-voxel basis. It has been used previously in applications such as measuring growth or shrinkage of brain structures, or regions of interest (ROIs).13–15 Here, it is applied to quantifying subtle and gradual change in pre-existing T2 lesions. The Jacobian analysis pipeline used is based on that of Nakamura et al.14 and is summarized as follows (Figure 1(a)–(e)):
Figure 1.
Jacobian analysis and SEL candidates: (a), (b) An axial slice of linearly co-registered reference and follow-up T1-weighted scans. (c) The reference scan with a regular grid overlaid. (di) The non-linearly deformed image in (c) is shown to match the follow-up scan, and (dii) an enlarged lesion area of the deformation field. (e) The Jacobian determinant is shown as a heat map, where blue represents local contraction and red local expansion. The Jacobian determinant represents the local percent volume change at each voxel, after application of the non-linear deformation that warps (a) to match (b). (f) An axial slice of a reference T2-weighted scan with overlaid T2 lesion segmentation. (g) The Jacobian determinant within reference T2 lesions. (h) Initial SEL candidate boundaries based on JE1. (i) Refined SEL candidate boundaries based on JE2.
JE: Jacobian Expansion; SEL: slowly expanding/evolving lesion.
Resampling of images to 1-mm isotropic space.
Linear (affine) registration between a reference and follow-up timepoint for global alignment of a scan in a halfway (unbiased) space.
Non-linear registration (step size = 0.7; Gaussian sigma = 2) between linearly aligned timepoints to generate a deformation field which describes the local displacement at each voxel that best aligns the two images,16 where the registration is performed using the T1-weighted and T2-weighted images simultaneously.
Computation of the Jacobian of the deformation field, corresponding to the three-dimensional (3D) spatial derivative of the deformation field at each voxel.
Computation of the determinant of the Jacobian, providing a single scalar value describing the magnitude of local volume change at each voxel as a percent.
Resampling of Jacobian determinant maps to original image resolution of 1 mm × 1 mm × 3 mm.
SEL candidates
SEL candidates were identified as contiguous regions within pre-existing T2 lesions that showed minimum positive local volume change, as determined by the Jacobian determinant (Supplementary Figure 1). Boundaries of individual SEL candidates were determined as follows:
Identify voxels within pre-existing T2 lesions that have minimum rate of expansion greater or equal to Jacobian Expansion (JE1).
Group voxels identified in (1), based on 3D-connected component analysis using 18 connectedness, to form initial boundaries of SEL candidates.
Dilate SEL candidates as determined in (2) by iteratively considering neighboring voxels that have minimum rate of local expansion, JE2, where JE2 < JE1, to generate final boundaries of SEL candidates.
Discard any SEL candidates that are less than 10 voxels in size (reliability criterion).
The identification of SEL candidates is done as a two-stage process to ensure that distinct expansions are considered as separate discrete entities, even if they happen to be spatially connected. A minimum SEL size of 10 voxels is considered because of the inherent smoothing in the computation of the non-linear deformation and resultant Jacobian, and because the concentricity feature computed for classification of individual SEL candidates cannot be reliably computed for ROIs less than 10 voxels. The process for identification of SEL candidates is shown graphically in Figure 1(f)–(i). For the experiments performed in this paper, JE1 was heuristically set to 12.5%/year and JE2 to 4%/year, based on visual assessment of lesion expansion on longitudinal MRI sequences and their corresponding Jacobian determinant maps. Percentage local volume increase as measured by the Jacobian is normalized to a rate per year, so the algorithm is more independent of the actual time between scans. Methods for SEL selection from a set of SEL candidates are described in Supplementary Material.
Figure 2.
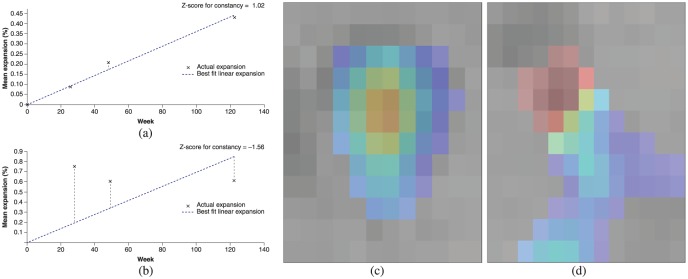
Constancy and concentricity of expansion: (a), (b) Plots of amount of expansion as a function of time, where the dotted line represents the linear best fit of expansion as a function of time and markers (X) represent the actual expansion as measured by the Jacobian determinant at each intermediate timepoint. The plots represent examples of lesions with a fairly constant expansion ((a), Z-score for constancy = 1.02) and a poorly constant expansion ((b), Z-score for constancy = −1.56). Other examples are shown with a fairly concentric pattern of expansion ((c), Z-score for concentricity = 5.33) and a poorly concentric pattern of expansion ((d), Z-score for concentricity = −0.812). Note that colors in (c) and (d) represent percent local expansion.
Lesion and SEL atlases
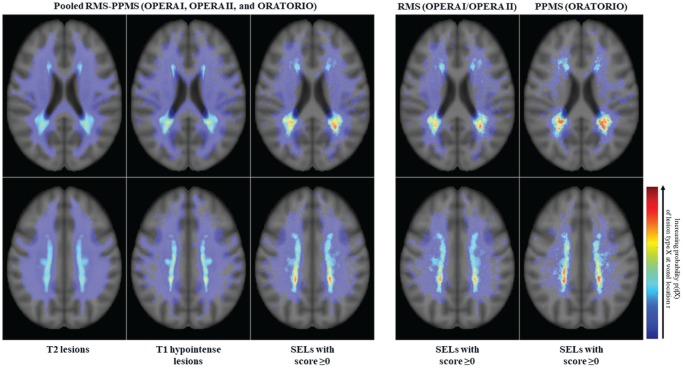
Atlases representing relative probabilities of anatomical location of various lesion subtypes were computed over all OPERA I, OPERA II, and ORATORIO study participants, for the following lesion subtypes: T2 hyperintense lesions (baseline only), T1 hypointense lesions (baseline only), and SELs (with a heuristic score ⩾ 0) detected from baseline to Week 96/120. Atlases were constructed by performing non-linear registration of each patient to ICBM (International Consortium for Brain Mapping) space and resampling the corresponding lesion/SEL masks into the common ICBM space. By combining the corresponding masks over all patients, the relative probability of each lesion subtype occurring at a given voxel location can be determined.
Statistical analysis
The statistical analysis of SEL data was exploratory and included all patients from OPERA I, OPERA II, and ORATORIO with no missing or non-evaluable scans (SEL analysis population). No imputation of missing data was performed, except for an analysis of the number of SELs, where for patients who were in the intent-to-treat population of the studies but not part of the SEL analysis population, the number of SELs was imputed as zero.
Statistical comparisons of continuous variables between RMS and PPMS patients were performed using the Van Elteren test,17 stratified for treatment group (ocrelizumab, comparator) and baseline T2 lesion volume category based on tertiles (⩽3.013 cm3, <3.013 to ⩽11.122 cm3, and >11.122 cm3).
Results
Baseline demographics and characteristics
The baseline disease and MRI characteristics for the SEL analysis populations from OPERA I, OPERA II, and ORATORIO phase III clinical trial data sets of patients with RMS and PPMS used for this study are presented in Table 1. Algorithm development was performed blinded to the treatment group assignment information. Results are presented for all SEL candidates and high-probability SELs (with a heuristic score ⩾ 0). Throughout this manuscript, we will consistently use as a semantic convention the term “all SEL candidates” for all detected SELs, irrespective of their heuristic SEL score value, and only refer to “SELs” for those high-probability SELs with a heuristic score ⩾ 0. In addition, SEL detection was restricted to patients with all four MRI assessments available: baseline, Week 24, Week 48, and Week 96 for OPERA I and OPERA II; and baseline, Week 24, Week 48, and Week 120 for ORATORIO.
Table 1.
Baseline demographics and characteristics for the OPERA I, OPERA II, and ORATORIO SEL analysis population.
| Baseline demographics and disease characteristics | OPERA I and OPERA II (pooled) (N = 1334)a | ORATORIO (N = 555)b |
|---|---|---|
| Age, mean (SD), years | 37.3 (9.2) | 44.9 (7.9) |
| Female, n (%) | 873 (65.4) | 276 (49.7) |
| Time since multiple sclerosis symptom onset, mean (SD), years | 6.5 (6.1) | 6.4 (3.7)c |
| Number of relapses in previous 12 months, mean (SD) | 1.3 (0.7)d | N/A |
| EDSS, mean (SD) | 2.7 (1.3) | 4.6 (1.2)e |
| MRI | ||
| Number of T1 Gd-enhancing lesions, mean (SD) | 1.7 (4.6)f | 1.0 (4.6)e |
| Proportion of patients with ⩾1 T1 Gd-enhancing lesion (%) | 39.6f | 25.3e |
| Brain T2 hyperintense lesion volume, median (range), cm3 | 5.4 (0–96.0)f | 6.9 (0–82.4)e |
| Normalized brain volume, mean (SD), cm3 | 1500.4 (87.9)g | 1462.4 (85.1)h |
SEL: slowly expanding/evolving lesion; SD: standard deviation; N/A: not applicable; EDSS: Expanded Disability Status Scale; MRI: magnetic resonance imaging; Gd: gadolinium; IFN: interferon; RMS: relapsing multiple sclerosis; PPMS: primary progressive multiple sclerosis.
Non-evaluable patients based on missing scan information for the analysis up to Week 48 (Week 96/120): OPERA ocrelizumab 125 (128); OPERA IFN β-1a 197 (199); ORATORIO ocrelizumab 104 (104); and ORATORIO placebo 73 (73). Patients with incomplete scan data were considered to have no SELs; results were similar when those patients were excluded from the analysis.
Data are presented for patients evaluable for SEL detection. Total RMS population N = 1656 (ocrelizumab N = 827, IFN β-1a N = 829).
Data are presented for patients evaluable for SEL detection. Total PPMS population (ocrelizumab N = 488, placebo N = 244).
n = 538.
n = 1333.
n = 554.
n = 1330.
n = 1324.
n = 550.
SEL prevalence in RMS versus PPMS
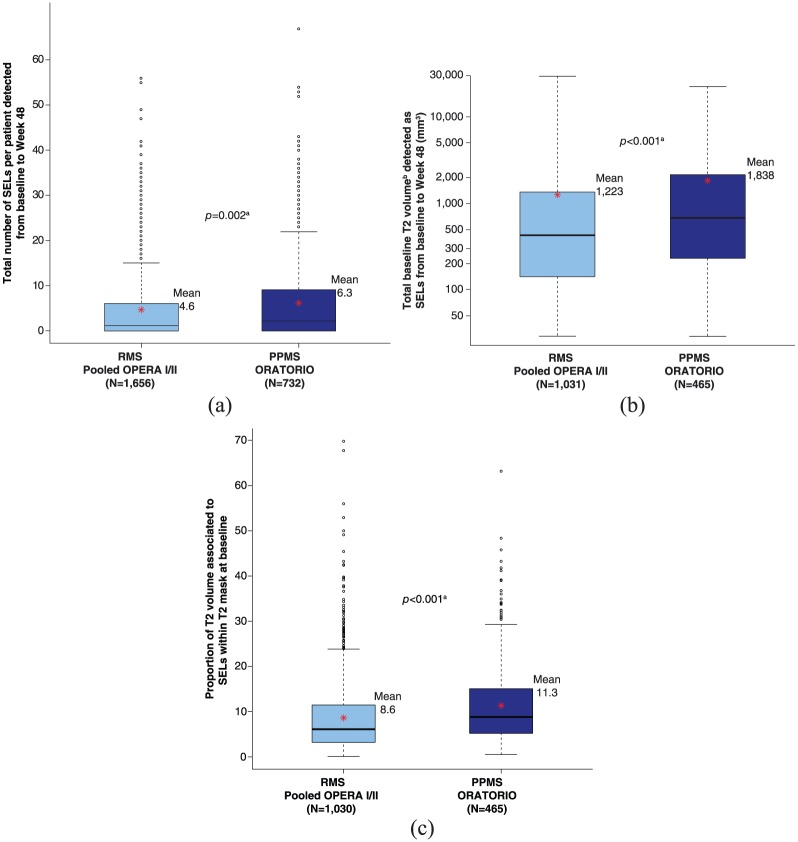
The proportion of patients with ⩾1 SEL was similar in PPMS (71.9%, ORATORIO, baseline to Week 120) and RMS patients (68.2%, pooled OPERA I and OPERA II, baseline to Week 96, respectively). Compared with RMS patients (pooled OPERA I and OPERA II), PPMS patients (ORATORIO) had a higher mean number of SELs (6.3 vs 4.6, p = 0.002) (Figure 3(a)), a higher mean T2 volume of SELs (baseline: 1838 vs 1223 mm3, p < 0.001) (Figure 3(b)), and a higher mean proportion of baseline total T2 lesion burden identified as SELs (11.3% vs 8.6%, p < 0.001) (Figure 3(c)). The frequency distribution of RMS versus PPMS patients with respect to SEL detection prevalence is detailed in Supplementary Figure 2. The latter analyses (Figure 3 and Supplementary Figure 2) were based on three timepoints (baseline, Week 24, and Week 48) to ensure consistent timepoints across all patients in both study populations. Similar differences in number of SELs, T2 volume of SELs, and proportion of baseline total T2 lesion burden identified as SELs were observed for all SEL candidates (Supplementary Figure 3).
Figure 3.
SEL prevalence in RMS and PPMS populations: (a) Total number of SELs per patient detected from baseline to Week 48. (b) Total baseline T2 volume detected as SELs from baseline to Week 48. (c) Proportion of T2 volume associated to SELs within T2 mask at baseline.
PPMS: primary progressive multiple sclerosis; RMS: relapsing multiple sclerosis; SEL: slowly expanding/evolving lesion.
For patients without any SELs or without any SEL candidates, the number of SELs is set to 0. Baseline T2 volume associated with SELs is defined as the sum of baseline T2 volume associated with each SEL. Red asterisks represent the mean values.
aVan Elteren test; stratified by treatment group (ocrelizumab, control), baseline T2 lesion volume category based on tertiles (⩽3.013 cm3, <3.013 to ⩽11.122 cm3, >11.122 cm3).
bLog-transformed.
Gd enhancement in SELs
The proportion of voxels within the baseline T2 limits of the ROIs that displayed Gd enhancement at any scheduled MRI visit (baseline to Week 96 for OPERA I and OPERA II, and baseline to Week 120 for ORATORIO) are presented for the pooled OPERA I, OPERA II, and ORATORIO study populations (N = 2388). The percentage of voxels showing Gd enhancement was higher in areas of pre-existing T2 lesion at baseline not classified as SEL (non-SEL) (1.5%, p < 0.001) and in new focal T2 lesions (8.9%, p < 0.001), compared with regions identified as SELs (0.3%) (Figure 4). Similar differences were observed for all SEL candidates (Supplementary Figure 4). These results were consistent in both the individual RMS and PPMS populations (data not shown).
Figure 4.
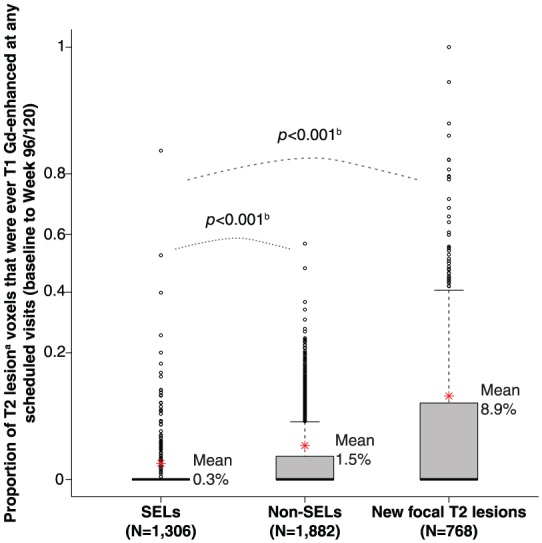
T1-weighted Gd enhancement in SELs.
Gd: gadolinium; PPMS: primary progressive multiple sclerosis; RMS: relapsing multiple sclerosis; SEL: slowly expanding/evolving lesion.
Box plot representation, where y-axis scale is based on arcsine transformation. Red asterisks represent the mean values. Consistent results were observed in both RMS and PPMS study populations, separately.
aVolume normalized average: sum (proportion of baseline T2 lesion voxels that is Gd-enhancing for each lesion*T2 volume)/sum of T2 volume. T2 volume for SEL, new T2 lesion at Week 24, and new T2 lesion at Week 48 are T2 volume at baseline, Week 24, and Week 48, respectively. SELs identified using scans from all scheduled visits.
bVan Elteren test; stratified by treatment group (ocrelizumab, control), baseline T2 lesion volume category based on tertiles (⩽3.013 cm3, <3.013 to ⩽11.122 cm3, >11.122 cm3).
T1-weighted signal intensity in SELs
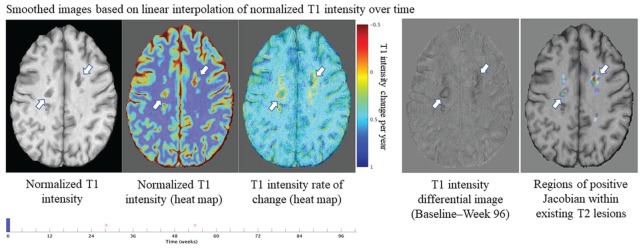
In the pooled OPERA trial population, compared with non-SEL, SELs had a lower normalized T1 intensity at baseline (0.282 vs 0.100, p < 0.001) (Figure 5). Similarly, in the ORATORIO trial population, SELs had a lower normalized T1 intensity at baseline compared with non-SEL (0.225 vs −0.002, p < 0.001) (Figure 5). Comparisons of absolute T1 intensity of SELs (from by-patient means) and non-SELs at each timepoint in RMS and PPMS populations were significant (p < 0.001; Figure 5). Comparison of the change from baseline to Week 96/120 showed a significantly larger decrease in normalized T1 intensity in SELs compared with non-SELs in both RMS and PPMS populations (p < 0.001 at all longitudinal timepoints; Figure 5). Similar results were observed using a T1-agnostic version of the algorithm, which was based on T2-weighted imaging information only (data not shown). It should be noted that there were differences between RMS and PPMS SELs and non-SELs with respect to absolute T1 intensity levels. A similar pattern of decrease over time in normalized T1 intensity from baseline to Week 96/120 was observed for all SEL candidates (Supplementary Figure 5). At the lesion level, we also observed that T1 intensity change at the edge of a SEL area results in a concentric inside-out pattern of the Jacobian expansion (Figure 6).
Figure 5.
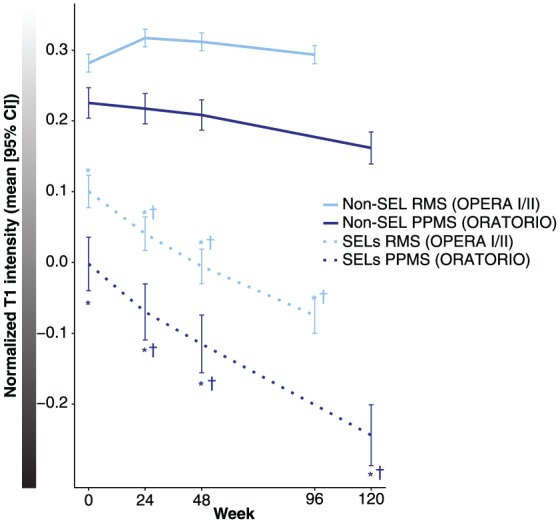
T1-weighted signal intensity in SELs.
CI: confidence interval; PPMS: primary progressive multiple sclerosis; RMS: relapsing multiple sclerosis; SEL: slowly expanding/evolving lesion.
Last visit is Week 96 for OPERA I and OPERA II, and Week 120 for ORATORIO.
aVan Elteren test; stratified by treatment group (ocrelizumab, control), baseline T2 lesion volume category based on tertiles (⩽3.013 cm3, <3.013 to ⩽11.122 cm3, >11.122 cm3).
*p < 0.001a for the comparison of absolute T1 intensity of SELs versus non-SELs at each timepoint in RMS and PPMS.
†p < 0.001a for the change in normalized T1 intensity from baseline to Week 24, Week 48, and Week 96/120 for SELs versus non-SELs in RMS and PPMS, respectively.
Figure 6.
Heat map representation of a specific example of the lesion-level spatial distribution of T1 intensity change over time and corresponding Jacobian Expansion in SELs.
MRI: magnetic resonance imaging; SEL: slowly expanding/evolving lesion.
The edge of SELs (with heuristic score ⩾ 0) are represented by white arrows. T1 intensity change at the lesion edge results in a concentric inside-out pattern in the Jacobian. Red font “x” labels represent the time of brain MRI scanning acquisitions. An animated version of Figure 6 will also be available in Supplementary Material.
Anatomical distribution of SELs
We performed a voxel-wise probabilistic analysis of SEL location versus overall T2 lesions and T1 hypointense lesions across the totality of OPERA I, OPERA II, and ORATORIO trial populations (Figure 7). These data demonstrated that the anatomical distribution of SELs is respecting the preferentially periventricular maximal probability of T1/T2 lesion occurrence across RMS and PPMS disease phenotypes, with a higher heat map density in patients with PPMS. It should be acknowledged that this is to be seen with the limitations of a qualitative descriptive analysis. We also observed a more posterior distribution pattern of SELs along the periventricular region.
Figure 7.
Probabilistic atlas of T2 hyperintense lesion, T1 hypointense lesion, and SEL spatial distributions.
PPMS: primary progressive multiple sclerosis; RMS: relapsing multiple sclerosis; SEL: slowly expanding/evolving lesion.
Each atlas represents the proportion of the lesion subtype occurring at a given anatomical location. Scales are consistent across all atlases.
Discussion
This study presents a novel technique to reliably detect and quantify chronically evolving MS lesions using serial conventional T1- and T2-weighted MRI. Compared with non-SELs, SELs were shown to evolve independently of T1 Gd enhancement, demonstrated a lower T1 intensity at baseline, and demonstrated a progressive decrease in T1 intensity over time, as a potential read-out for progressive accumulation of neural tissue damage, and especially axonal loss.18 The latter pattern was seen in the context of PPMS and RMS trial populations, but was nominally and statistically more pronounced in PPMS. The accumulation of T1 hypo-intensity or more profound “black hole” formation in SELs occurred independently of acute inflammation as usually defined based on contrast enhancement. Dynamic gadolinium contrast enhancement experiments would be needed to determine whether SELs might be associated with increased BBB permeability insufficient to produce T1 gadolinium-enhancing lesions as typically defined. Whether central nervous system tissue loss in SELs is related to chronic microglia/macrophage-mediated inflammatory processes and/or Wallerian neurodegeneration is to be determined, but the observed ubiquitous character of SELs may represent an argument for progressive brain tissue damage occurring in both RMS and PPMS along a phenotypic continuum of MS disease.
The constant decrease in T1 signal intensity of SELs is consistent with the expected T1-weighted MRI behavior of smoldering plaques, since the core of such lesions is typically characterized by severe accumulation of axonal damage3,19 and pathological and proton magnetic resonance spectroscopy studies demonstrate that the decrease in T1-weighted signal intensity within MS lesions reflects the magnitude of tissue destruction and axonal loss.20,21 The potential neuropathological correlates of SELs need to be further characterized. Quantitative susceptibility mapping (QSM) imaging22–25 could be used to assess the relation of SELs detected on MRI to the iron rim at the edge of chronic active lesions, as reported in pathological studies.26 However, only a fraction of smoldering lesions appear to have iron/zinc rims.27 Further elucidation of SEL characteristics might be derived from positron emission tomography studies using [11C]PK11195 or translocator protein radioligands, such as 11C-PBR28 or 18F-PBR111, for the detection of activated macrophages/microglia and astrocytes.28–30 To what extent neurotoxic reactive astrocytes of the A1-type induced by activated microglia31 may also be part of the underlying pathology within SELs remains to be elucidated.
Whether SELs may have potential as an MRI marker of chronic disease activity that could inform clinical prognosis in patients with MS also needs to be explored. Pathological studies have shown that slowly expanding demyelination, in amounts that appear to be comparable in PPMS and secondary progressive MS, is correlated with incomplete remyelination and may thus irreparably destroy normal and repaired myelin.4 Similarly, it was shown that the persistent 7T phase rim, which may reflect both smoldering inflammation and the presence of iron-laden microglia/macrophages, predicts poor outcome in new lesions in patients with MS.32 Although not a direct indication, these observations are consistent with the concept of chronic inflammation and demyelination within and at the edge of chronic active lesions as a pathological correlate of clinically progressive MS.33
The findings presented here should be considered in the context of certain study limitations. The quantitative differences in SEL prevalence between RMS and PPMS, with increased numbers and T2 lesion volume at baseline in PPMS versus RMS, could be mostly reflective of differences in age, gender distribution, comparator treatment, and lesion load between these patient populations. Furthermore, PPMS and RMS studies had different comparator treatment arms and 2:1 versus 1:1 randomization ratios, respectively. The sensitivity of SEL detection may benefit from isotropic 3D acquisitions, is contingent upon the duration and number of time intervals between MRI scans, and limited by the minimal reliability threshold of 10 voxels for identifying SELs; hence, not all SEL candidates might have been identified. In addition, determination of thresholds for SEL boundaries in the SEL algorithm was decided heuristically; using a different set of expansion rates may have generated different absolute numbers. Furthermore, the SEL quantification algorithm currently does not accommodate potential contraction at the lesion center over time,2 which is known to be occurring especially in the long term34 and underscores that the primary pathological process in chronically evolving lesions, even those described by pathologists as “slowly expanding,” is likely to be tissue loss. From an anatomical perspective, it is established that chronic accumulation of lesions and neurodegeneration in the MS brain does not affect all brain regions equally.35 Whether spatial distribution, morphological pattern, and severity features of SELs might be influenced by venous density, proximity to cerebrospinal fluid compartment and/or quality of arterial blood supply would warrant dedicated investigations.
In summary, our algorithm for the detection of SELs on conventional T1- and T2-weighted brain MRI provides a novel marker for chronically evolving MS lesion pathology, which could be of specific interest to advance the understanding of the determinants of clinically apparent progressive disease course. No definitive correlation between SELs and smoldering plaques can be drawn without further investigations using other imaging techniques and pathological analysis.2
Supplemental Material
Supplemental material, MSJ814117_supplementary_figure_2 for Slowly expanding/evolving lesions as a magnetic resonance imaging marker of chronic active multiple sclerosis lesions by Colm Elliott, Jerry S Wolinsky, Stephen L Hauser, Ludwig Kappos, Frederik Barkhof, Corrado Bernasconi, Wei Wei, Shibeshih Belachew and Douglas L Arnold in Multiple Sclerosis Journal
Supplemental Material
Supplemental material, MSJ814117_supplementary_figure_3 for Slowly expanding/evolving lesions as a magnetic resonance imaging marker of chronic active multiple sclerosis lesions by Colm Elliott, Jerry S Wolinsky, Stephen L Hauser, Ludwig Kappos, Frederik Barkhof, Corrado Bernasconi, Wei Wei, Shibeshih Belachew and Douglas L Arnold in Multiple Sclerosis Journal
Supplemental Material
Supplemental material, MSJ814117_supplementary_figure_4 for Slowly expanding/evolving lesions as a magnetic resonance imaging marker of chronic active multiple sclerosis lesions by Colm Elliott, Jerry S Wolinsky, Stephen L Hauser, Ludwig Kappos, Frederik Barkhof, Corrado Bernasconi, Wei Wei, Shibeshih Belachew and Douglas L Arnold in Multiple Sclerosis Journal
Supplemental Material
Supplemental material, MSJ814117_supplementary_figure_5 for Slowly expanding/evolving lesions as a magnetic resonance imaging marker of chronic active multiple sclerosis lesions by Colm Elliott, Jerry S Wolinsky, Stephen L Hauser, Ludwig Kappos, Frederik Barkhof, Corrado Bernasconi, Wei Wei, Shibeshih Belachew and Douglas L Arnold in Multiple Sclerosis Journal
Acknowledgments
The authors thank all patients, their families, and the investigators who participated in the OPERA I, OPERA II, and ORATORIO trials; and NeuroRx Research (Montreal, QC, Canada) for the evaluation of MRI scans. Writing and editorial assistance for this manuscript was provided by Heather Latimer of Articulate Science, UK. Qualified researchers may request access to individual patient-level data through the clinical study data request platform (www.clinicalstudydatarequest.com). Further details on Roche’s criteria for eligible studies are available here (https://clinicalstudydatarequest.com/Study-Sponsors/Study-Sponsors-Roche.aspx). For further details on Roche’s Global Policy on the Sharing of Clinical Information and how to request access to related clinical study documents, visit https://www.roche.com/research_and_development/who_we_are_how_we_work/clinical_trials/our_commitment_to_data_sharing.htm.
Footnotes
Declaration of Conflicting Interests: The author(s) declared the following potential conflicts of interest with respect to the research, authorship, and/or publication of this article: C.E. is an employee of NeuroRx Research and has served on an advisory board for F. Hoffmann-La Roche Ltd. J.S.W. has served on advisory boards, data monitoring or steering committees, and has consulting agreements from the following entities: AbbVie, Actelion, Alkermes, Bayer HealthCare Pharmaceuticals, Biogen, BioNEST, Celgene, Clene Nanomedicine, EMD Serono, Forward Pharma A/S, GeNeuro SA, MedDay Pharmaceuticals, Novartis, Otsuka, PTC Therapeutics, Roche Genentech, Sanofi Genzyme, Strategic Consultants International, Takeda, and Teva Pharmaceuticals; royalties are received for out-licensed monoclonal antibodies through UTHealth from Millipore Corporation. S.L.H. serves on the board of trustees for Neurona and on scientific advisory boards for Annexon, Bionure, and Symbiotix, and has received travel reimbursement and writing assistance from F. Hoffmann-La Roche Ltd for CD20-related meetings and presentations. L.K.’s institution, the University Hospital Basel, has received research support and payments that were used exclusively for research support for L.K.’s activities as principal investigator and member or chair of planning and steering committees or advisory boards for trials sponsored by Actelion, Addex, Almirall, Bayer HealthCare Pharmaceuticals, CSL Behring, F. Hoffmann-La Roche Ltd and Genentech, Inc., GeNeuro SA, Genzyme, Merck Serono, Mitsubishi Pharma, Novartis, Octapharma, Ono Pharmaceutical, Pfizer, Receptos, Sanofi, Santhera, Siemens, Teva, UCB, and XenoPort; has received license fees for Neurostatus products; and has received research grants from the European Union, Gianni Rubatto Foundation, Novartis Research Foundation, Roche Research Foundation, Swiss Multiple Sclerosis Society, and Swiss National Research Foundation. F.B. is an editorial board member for the publications Brain, European Radiology, Multiple Sclerosis Journal, Neurology, and Radiology; has received consultancy fees from Bayer Schering, Biogen, F. Hoffmann-La Roche Ltd, Genzyme, Janssen Research, Merck Serono, Novartis, Synthon, and Teva; has received grants from the Dutch MS Society (EU-FP7/Horizon 2020); has received payments for developing educational presentations, including service on speaker bureaus, for Biogen and IXICO; and was supported by the NIHR UCLH Biomedical Research Centre. C.B. is a contractor for F. Hoffmann-La Roche Ltd. W.W. is an employee and shareholder of F. Hoffmann-La Roche Ltd. S.B. is an employee and shareholder of F. Hoffmann-La Roche Ltd. D.L.A. has received personal fees for consulting from Acorda, Biogen, F. Hoffmann-La Roche Ltd, MedImmune, Mitsubishi, Novartis, Receptos, and Sanofi-Aventis; grants from Biogen and Novartis; and an equity interest in NeuroRx Research.
Funding: The author(s) disclosed receipt of the following financial support for the research, authorship, and/or publication of this article: F. Hoffmann-La Roche Ltd, Basel, Switzerland, provided financial support for the study and publication of this manuscript. F.B. was supported by the NIHR UCLH Biomedical Research Centre.
Supplemental material: Supplemental material for this article is available online.
Trial registration: ClinicalTrials.gov identifiers: OPERA I/NCT01247324 (https://clinicaltrials.gov/ct2/show/NCT01247324), OPERA II/NCT01412333 (https://clinicaltrials.gov/ct2/show/NCT01412333), and ORATORIO/NCT01194570 (https://clinicaltrials.gov/ct2/show/NCT01194570).
ORCID iD: Jerry S Wolinsky  https://orcid.org/0000-0002-8197-2762
Contributor Information
Colm Elliott, NeuroRx Research, Montreal, QC, Canada.
Jerry S Wolinsky, Department of Neurology, McGovern Medical School, The University of Texas Health Science Center at Houston (UTHealth), Houston, TX, USA.
Stephen L Hauser, Department of Neurology, University of California–San Francisco, San Francisco, CA, USA.
Ludwig Kappos, Neurologic Clinic and Policlinic, Departments of Medicine, Clinical Research, Biomedicine and Biomedical Engineering, University Hospital Basel, University of Basel, Basel, Switzerland.
Frederik Barkhof, Department of Radiology and Nuclear Medicine, VU University Medical Center, Amsterdam, The Netherlands/Institutes of Biomedical Engineering and Neurology, University College London (UCL), London, UK.
Corrado Bernasconi, F. Hoffmann-La Roche Ltd, Basel, Switzerland.
Wei Wei, F. Hoffmann-La Roche Ltd, Basel, Switzerland.
Shibeshih Belachew, F. Hoffmann-La Roche Ltd, Basel, Switzerland.
Douglas L Arnold, NeuroRx Research, Montreal, QC, Canada/Department of Neurology and Neurosurgery, McGill University, Montreal, QC, Canada.
References
- 1. Kutzelnigg A, Lucchinetti CF, Stadelmann C, et al. Cortical demyelination and diffuse white matter injury in multiple sclerosis. Brain 2005; 128: 2705–2712. [DOI] [PubMed] [Google Scholar]
- 2. Frischer JM, Weigand SD, Guo Y, et al. Clinical and pathological insights into the dynamic nature of the white matter multiple sclerosis plaque. Ann Neurol 2015; 78: 710–721. [DOI] [PMC free article] [PubMed] [Google Scholar]
- 3. Frischer JM, Bramow S, Dal-Bianco A, et al. The relation between inflammation and neurodegeneration in multiple sclerosis brains. Brain 2009; 132: 1175–1189. [DOI] [PMC free article] [PubMed] [Google Scholar]
- 4. Bramow S, Frischer JM, Lassmann H, et al. Demyelination versus remyelination in progressive multiple sclerosis. Brain 2010; 133: 2983–2998. [DOI] [PubMed] [Google Scholar]
- 5. Correale J, Gaitán MI, Ysrraelit MC, et al. Progressive multiple sclerosis: From pathogenic mechanisms to treatment. Brain 2017; 140: 527–546. [DOI] [PubMed] [Google Scholar]
- 6. Dal-Bianco A, Grabner G, Kronnerwetter C, et al. Slow expansion of multiple sclerosis iron rim lesions: Pathology and 7 T magnetic resonance imaging. Acta Neuropathol 2017; 133: 25–42. [DOI] [PMC free article] [PubMed] [Google Scholar]
- 7. Luchetti S, Fransen NL, Van Eden CG, et al. Progressive multiple sclerosis patients show substantial lesion activity that correlates with clinical disease severity and sex: A retrospective autopsy cohort analysis. Acta Neuropathol 2018; 135: 511–528. [DOI] [PMC free article] [PubMed] [Google Scholar]
- 8. Absinta M, Sati P, Fechner A, et al. Identification of chronic active multiple sclerosis lesions on 3T MRI. AJNR Am J Neuroradiol 2018; 39: 1233–1238. [DOI] [PMC free article] [PubMed] [Google Scholar]
- 9. Kuhlmann T, Ludwin S, Prat A, et al. An updated histological classification system for multiple sclerosis lesions. Acta Neuropathol 2017; 133: 13–24. [DOI] [PubMed] [Google Scholar]
- 10. Hauser SL, Bar-Or A, Comi G, et al. Ocrelizumab versus interferon beta-1a in relapsing multiple sclerosis. N Engl J Med 2017; 376: 221–234. [DOI] [PubMed] [Google Scholar]
- 11. Montalban X, Hauser SL, Kappos L, et al. Ocrelizumab versus placebo in primary progressive multiple sclerosis. N Engl J Med 2017; 376: 209–220. [DOI] [PubMed] [Google Scholar]
- 12. Francis SJ. Automatic lesion identification in MRI of multiple sclerosis patients. MSc Thesis. Division of Neuroscience, McGill University, Montreal, QC, Canada, 2004. [Google Scholar]
- 13. Crum WR, Scahill RI, Fox NC. Automated hippocampal segmentation by regional fluid registration of serial MRI: Validation and application in Alzheimer’s disease. Neuroimage 2001; 13: 847–855. [DOI] [PubMed] [Google Scholar]
- 14. Nakamura K, Guizard N, Fonov VS, et al. Jacobian integration method increases the statistical power to measure gray matter atrophy in multiple sclerosis. Neuroimage Clin 2013; 4: 10–17. [DOI] [PMC free article] [PubMed] [Google Scholar]
- 15. Dwyer MG, Silva D, Bergsland N, et al. Neurological software tool for reliable atrophy measurement (NeuroSTREAM) of the lateral ventricles on clinical-quality T2-FLAIR MRI scans in multiple sclerosis. Neuroimage Clin 2017; 15: 769–779. [DOI] [PMC free article] [PubMed] [Google Scholar]
- 16. Avants BB, Epstein CL, Grossman M, et al. Symmetric diffeomorphic image registration with cross-correlation: Evaluating automated labeling of elderly and neurodegenerative brain. Med Image Anal 2008; 12: 26–41. [DOI] [PMC free article] [PubMed] [Google Scholar]
- 17. Van Elteren PH. On the combination of independent two-sample tests of Wilcoxon. Bull Int Statist Inst 1960; 37: 351–361. [Google Scholar]
- 18. Van Walderveen MA, Kamphorst W, Scheltens P, et al. Histopathologic correlate of hypointense lesions on T1-weighted spin-echo MRI in multiple sclerosis. Neurology 1998; 50: 1282–1288. [DOI] [PubMed] [Google Scholar]
- 19. Kornek B, Storch MK, Weissert R, et al. Multiple sclerosis and chronic autoimmune encephalomyelitis: A comparative quantitative study of axonal injury in active, inactive, and remyelinated lesions. Am J Pathol 2000; 157: 267–276. [DOI] [PMC free article] [PubMed] [Google Scholar]
- 20. Van Waesberghe JH, Kamphorst W, De Groot CJ, et al. Axonal loss in multiple sclerosis lesions: Magnetic resonance imaging insights into substrates of disability. Ann Neurol 1999; 46: 747–754. [DOI] [PubMed] [Google Scholar]
- 21. Van Walderveen MA, Barkhof F, Pouwels PJ, et al. Neuronal damage in T1-hypointense multiple sclerosis lesions demonstrated in vivo using proton magnetic resonance spectroscopy. Ann Neurol 1999; 46: 79–87. [DOI] [PubMed] [Google Scholar]
- 22. Yao Y, Nguyen TD, Pandya S, et al. Combining quantitative susceptibility mapping with automatic zero reference (QSM0) and myelin water fraction imaging to quantify iron-related myelin damage in chronic active MS lesions. AJNR Am J Neuroradiol 2018; 39: 303–310. [DOI] [PMC free article] [PubMed] [Google Scholar]
- 23. Wisnieff C, Ramanan S, Olesik J, et al. Quantitative susceptibility mapping (QSM) of white matter multiple sclerosis lesions: Interpreting positive susceptibility and the presence of iron. Magn Reson Med 2015; 74: 564–570. [DOI] [PMC free article] [PubMed] [Google Scholar]
- 24. Chen W, Gauthier SA, Gupta A, et al. Quantitative susceptibility mapping of multiple sclerosis lesions at various ages. Radiology 2014; 271: 183–192. [DOI] [PMC free article] [PubMed] [Google Scholar]
- 25. Deh K, Ponath GD, Molvi Z, et al. Magnetic susceptibility increases as diamagnetic molecules breakdown: Myelin digestion during multiple sclerosis lesion formation contributes to increase on QSM. J Magn Reson Imaging 2018; 48: 1281–1287. [DOI] [PMC free article] [PubMed] [Google Scholar]
- 26. Haacke EM, Makki M, Ge Y, et al. Characterizing iron deposition in multiple sclerosis lesions using susceptibility weighted imaging. J Magn Reson Imaging 2009; 29: 537–544. [DOI] [PMC free article] [PubMed] [Google Scholar]
- 27. Popescu BF, Frischer JM, Webb SM, et al. Pathogenic implications of distinct patterns of iron and zinc in chronic MS lesions. Acta Neuropathol 2017; 134: 45–64. [DOI] [PMC free article] [PubMed] [Google Scholar]
- 28. Datta G, Colasanti A, Rabiner EA, et al. Neuroinflammation and its relationship to changes in brain volume and white matter lesions in multiple sclerosis. Brain 2017; 140: 2927–2938. [DOI] [PubMed] [Google Scholar]
- 29. Kaunzner UW, Kang Y, Monohan E, et al. Reduction of PK11195 uptake observed in multiple sclerosis lesions after natalizumab initiation. Mult Scler Relat Disord 2017; 15: 27–33. [DOI] [PubMed] [Google Scholar]
- 30. Sucksdorff M, Rissanen E, Tuisku J, et al. Evaluation of the effect of fingolimod treatment on microglial activation using serial PET imaging in multiple sclerosis. J Nucl Med 2017; 58: 1646–1651. [DOI] [PubMed] [Google Scholar]
- 31. Liddelow SA, Guttenplan KA, Clarke LE, et al. Neurotoxic reactive astrocytes are induced by activated microglia. Nature 2017; 541: 481–487. [DOI] [PMC free article] [PubMed] [Google Scholar]
- 32. Absinta M, Sati P, Schindler M, et al. Persistent 7-tesla phase rim predicts poor outcome in new multiple sclerosis patient lesions. J Clin Invest 2016; 126: 2597–2609. [DOI] [PMC free article] [PubMed] [Google Scholar]
- 33. Prineas JW, Kwon EE, Cho ES, et al. Immunopathology of secondary-progressive multiple sclerosis. Ann Neurol 2001; 50: 646–657. [DOI] [PubMed] [Google Scholar]
- 34. Sethi V, Nair G, Absinta M, et al. Slowly eroding lesions in multiple sclerosis. Mult Scler 2017; 23: 464–472. [DOI] [PMC free article] [PubMed] [Google Scholar]
- 35. Haider L, Zrzavy T, Hametner S, et al. The topograpy of demyelination and neurodegeneration in the multiple sclerosis brain. Brain 2016; 139: 807–815. [DOI] [PMC free article] [PubMed] [Google Scholar]
Associated Data
This section collects any data citations, data availability statements, or supplementary materials included in this article.
Supplementary Materials
Supplemental material, MSJ814117_supplementary_figure_2 for Slowly expanding/evolving lesions as a magnetic resonance imaging marker of chronic active multiple sclerosis lesions by Colm Elliott, Jerry S Wolinsky, Stephen L Hauser, Ludwig Kappos, Frederik Barkhof, Corrado Bernasconi, Wei Wei, Shibeshih Belachew and Douglas L Arnold in Multiple Sclerosis Journal
Supplemental material, MSJ814117_supplementary_figure_3 for Slowly expanding/evolving lesions as a magnetic resonance imaging marker of chronic active multiple sclerosis lesions by Colm Elliott, Jerry S Wolinsky, Stephen L Hauser, Ludwig Kappos, Frederik Barkhof, Corrado Bernasconi, Wei Wei, Shibeshih Belachew and Douglas L Arnold in Multiple Sclerosis Journal
Supplemental material, MSJ814117_supplementary_figure_4 for Slowly expanding/evolving lesions as a magnetic resonance imaging marker of chronic active multiple sclerosis lesions by Colm Elliott, Jerry S Wolinsky, Stephen L Hauser, Ludwig Kappos, Frederik Barkhof, Corrado Bernasconi, Wei Wei, Shibeshih Belachew and Douglas L Arnold in Multiple Sclerosis Journal
Supplemental material, MSJ814117_supplementary_figure_5 for Slowly expanding/evolving lesions as a magnetic resonance imaging marker of chronic active multiple sclerosis lesions by Colm Elliott, Jerry S Wolinsky, Stephen L Hauser, Ludwig Kappos, Frederik Barkhof, Corrado Bernasconi, Wei Wei, Shibeshih Belachew and Douglas L Arnold in Multiple Sclerosis Journal


