

Summary
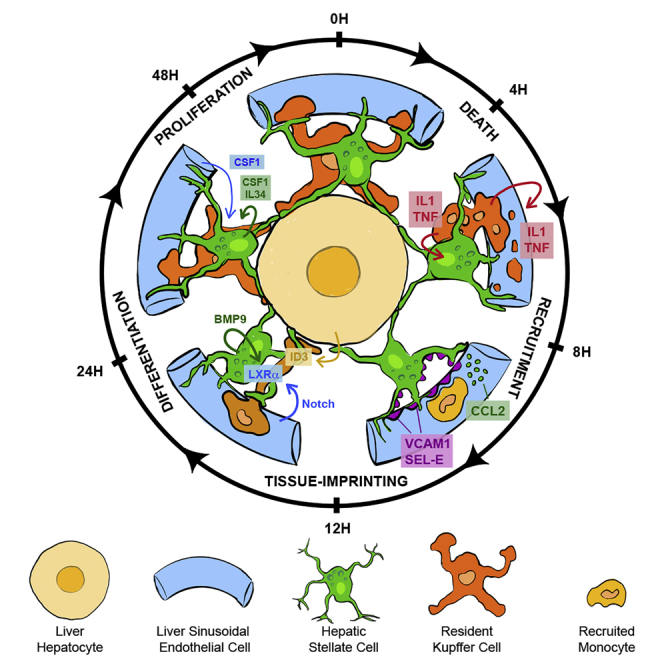
Macrophages are strongly adapted to their tissue of residence. Yet, little is known about the cell-cell interactions that imprint the tissue-specific identities of macrophages in their respective niches. Using conditional depletion of liver Kupffer cells, we traced the developmental stages of monocytes differentiating into Kupffer cells and mapped the cellular interactions imprinting the Kupffer cell identity. Kupffer cell loss induced tumor necrosis factor (TNF)- and interleukin-1 (IL-1) receptor-dependent activation of stellate cells and endothelial cells, resulting in the transient production of chemokines and adhesion molecules orchestrating monocyte engraftment. Engrafted circulating monocytes transmigrated into the perisinusoidal space and acquired the liver-associated transcription factors inhibitor of DNA 3 (ID3) and liver X receptor-α (LXR-α). Coordinated interactions with hepatocytes induced ID3 expression, whereas endothelial cells and stellate cells induced LXR-α via a synergistic NOTCH-BMP pathway. This study shows that the Kupffer cell niche is composed of stellate cells, hepatocytes, and endothelial cells that together imprint the liver-specific macrophage identity.
Keywords: liver, Kupffer cell, LXRa, Nr1h3, Id3, stellate cell, endothelial cell, niche, macrophage, fibroblast, Notch, Bmp9, monocyte
Graphical Abstract
Highlights
-
•
Kupffer cells interact with stellate cells and hepatocytes in the space of Disse
-
•
TNF released by dying Kupffer cells activates stellate cells and endothelial cells
-
•
Stellate cells and endothelial cells orchestrate monocyte recruitment and adhesion
-
•
Endothelial and stellate cells induce LXR-α in monocytes via the NOTCH-BMP pathway
Bonnardel and colleagues tracked monocytes differentiating into Kupffer cells and mapped the cellular interactions imprinting their identity. Monocytes transmigrated into the perisinusoidal space. Interactions with endothelial and stellate cells induced LXR-α via the NOTCH-BMP pathway. Hepatocytes induced ID3. Thus, stellate cells, hepatocytes, and endothelial cells compose the Kupffer cell niche.
Introduction
Macrophages were first identified in the late 19th century by Elie Metchnikoff because of their participation in host defense through phagocytosis (Metchnikoff, 1892). It is now clear that macrophages also perform unique tissue-specific functions that are not related to host defense but essential for tissue homeostasis, such as electrical conduction in the heart, synaptic pruning in the brain, or alveolar surfactant clearance in the lung (Hulsmans et al., 2017, Paolicelli et al., 2011, Trapnell et al., 2003, van de Laar et al., 2016). These functions are thought to be performed by tissue-specific gene modules controlled by specific transcription factors imprinted by their microenvironment (Lavin et al., 2014, Okabe and Medzhitov, 2016, T’Jonck et al., 2018). Little is known about the cell-cell interactions underlying the tissue-specific imprinting of macrophages.
We have recently shown that depletion of liver-resident macrophages, known as Kupffer cells (KCs), induces their repopulation by bone marrow (BM) monocytes yielding monocyte-derived KCs that are genetically and functionally nearly identical to their embryonic counterparts (Scott et al., 2016). Furthermore, recent studies have highlighted the central role of the transcription factors LXR-α and ID3 in the control of the KC-specific identity given that genetic deletion of Id3 or Nr1h3 (encoding LXR-α) induces the loss of KC identity and compromises KC survival (Mass et al., 2016, Scott et al., 2018). However, the cellular and molecular interactions imprinting the expression of LXR-α and ID3 in KCs are unknown.
In this study, we utilized a KC-specific depletion model to decipher the signals driving monocyte recruitment, engraftment, and acquisition of the KC-associated transcription factors and identify the differential contributions of stellate cells, endothelial cells, and hepatocytes to the KC niche.
Results
Depleted KCs Are Exclusively Replaced by Monocyte-Derived KCs
Clec4F is a lectin specifically expressed by Kupffer cells (KCs) (Scott et al., 2016). Using Clec4fDTR/+ mice, we had previously shown that Ly6Chi monocytes can act as KC precursors (Scott et al., 2016). We crossed these mice to Ccr2GFP/+ mice to temporarily fate-map the green fluorescent protein (GFP)-expressing monocytes differentiating into monocyte-derived KCs (mo-KCs) and evaluate their relative contribution to the mo-KC pool (Satpathy et al., 2013, Serbina and Pamer, 2006). Diphtheria toxin (DT) injection induced a rapid disappearance of KCs without affecting liver capsule macrophages and a strong recruitment of Ly6Chi monocytes in the liver (12 h DT) that gradually lost Ly6C and acquired both F4/80 and Clec4F (Figures 1A and S1A–S1C; Video S1). At day 2 after KC loss, F4/80+ mo-KCs uniformly expressed GFP as highly as Ly6Chi monocytes, and from day 3 the GFP was gradually decreased, consistent with the downregulation of Ccr2 (Figures 1A, 2B, and S1C). We also observed a rapid increase of the mo-KC population between day 2 and day 6 after KC depletion (Figure 1C). Transcriptome analysis of mo-KCs at day 3 compared with days 1 and 7 showed that the top 30 of upregulated genes were related to cell cycle, indicating that mo-KCs were undergoing proliferation (Figure 1D). We next evaluated their proliferation rate by measuring 5-Ethyl-2′-deoxyuridine (EdU) incorporation and KI-67 staining. Mo-KCs showed a proliferation phase with a peak 3 days after depletion (Figures 1E, 1F, and S1C). This proliferation phase was dependent on colony-stimulating factor 1 (CSF1) receptor (CSF1R) signaling as injection of PLX3397 (an inhibitor of CSF1R) blocked mo-KC proliferation (Figure 1G) (Yan et al., 2017).
Figure 1.

Replenishment of KC Pool by Ly6Chi Monocytes
(A and B) Expression of GFP, Ly6C, and F4/80 of monocytes (green gate), em-KCs (black gate), and mo-KCs (red gate) after DT injection in (A) Clec4fDTR/+-Ccr2GFP/+ mice or (B) Clec4fDTR/+-Ccr2GFP/GFP mice. Flow-cytometry plots are pre-gated on live CD45+CD11b+Lyve-1−SiglecF−Ly6G− single cells. Data are representative of 2–3 experiments.
(C) Proportion of Ly6Chi monocytes (green lines), em-KCs (black lines), and mo-KCs (red lines) in the liver of Clec4fDTR/+-Ccr2GFP/+ mice (solid lines) or Clec4fDTR/+-Ccr2GFP/GFP mice (dashed lines) as a percentage of live CD45+ cells after DT injection. Pooled data are from 2–3 experiments; n = 5 (0,5d), 6 (PBS, 1d; 1,5d; 2d; 5d; 6d), and 8 mice (3d; 4d).
(D) Heatmap showing the top 30 of upregulated genes in mo-KCs 3 days compared with 1 and 7 days after DT injection.
(E) Expression of Ki-67 and EdU incorporation by em-KCs and mo-KCs in (top) Clec4fDTR/+-Ccr2GFP/+ mice or (bottom) in Clec4fDTR/+-Ccr2GFP/GFP mice after DT injection. Flow-cytometry plots are pre-gated as in (A). Data are representative of 2–3 experiments.
(F) Percentage of EdU+ cells in indicated populations during the differentiation kinetic of mo-KCs in Clec4fDTR/+-Ccr2GFP/+ mice (solid line) or Clec4fDTR/+-Ccr2GFP/GFP (dash line). Pooled data are from 2–3 experiments; n = 5 (0,5d), 6 (PBS, 1d, 1,5d, 2d, 5d, 6d), and 8 mice (3d, 4d). Two-way ANOVA with Tukey post-test. ∗p < 0.05, ∗∗∗p < 0.001, ∗∗∗∗p < 0.0001.
(G) Percentage of EdU+ mo-KCs 3 days after DT injection in liver of mice treated with PLX3397 (α-CSF1R) or vehicle. Pooled data are from 2 experiments, n = 7. Mann-Whitney t test. ∗∗∗p < 0.001.
Related to Figure S1.
Figure 2.

Recruited Monocytes Engraft in the Liver and Acquire KC-Specific Identity within 24 h after KC Depletion
(A) F4/80 and Clec4F expression during embryogenesis. Gates indicate the different sorted populations used for the micro-array.
(B–D) Heatmap showing expression by the indicated cell populations of (B) monocyte- and macrophage-related genes, (C) KC-associated transcription factors compared with other tissue-resident macrophages, and (D) KC-cores genes.
(E) Shown in the top row is an in vivo two-photon microscopy analysis of livers from Clec4fDTR/Cre-Ccr2GFP/+-Rosa26TdT/+ mice injected with PBS (left, corresponding to Video S2) or with DT for 10 h (middle, corresponding to Video S3) or 24 h (right, corresponding to Video S4) is illustrated. Shown in the middle row is automated tracking of GFP+ monocytes in the liver during 1 h. On the bottom are the average speed and confinement index (maximum displacement/path length) of individual monocyte tracks of the above conditions. Pooled data from 2–3 experiments. Scale bar, 20μm.
(F) On top is the maximal intensity projection (MIP) of Clec4fDTR/+-Ccr2GFP/+ mouse liver sections stained for GFP (monocytes), MHCII, and DAPI in PBS control or 24 h after DT injection. MHCII− monocytes (asterisks) are round and MHCII+ monocytes (arrowheads) are elongated. Scale bar, 50μm. On the bottom is a quantification of monocyte size 24 h after PBS or DT injection (left graph) or, depending on their MHCII expression, 24 h after DT injection (right graph). Pooled data from 2 experiments, n = 4. Student’s t test. ∗∗∗∗p < 0.0001. Dots represent individual monocytes.
(G) CD11c and MHC-II expression during mo-KC differentiation. Flow-cytometry plots are pre-gated as in Figure 1A and further gated on Ly6ChiF4/80− cells (Mono PBS; 0,5d and 1d) or F4/80+ cells (2d to em-KC PBS). Data are representative of 2–3 experiments.
(H) Relative expression of KC-associated transcription factor mRNA in indicated populations and conditions. Pooled data from 3 experiments, n = 13. One way ANOVA with Bonferroni post-test. ∗∗p < 0.01, ∗∗∗p < 0.001, ∗∗∗∗p < 0.0001.
3D reconstruction of Clec4fDTR/+ mouse liver sections stained for Clec4F (blue), F4/80 (cyan), Sirpα (green), and MHCII (red) in PBS control mice or 16 h after DT injection. The video showed that capsule liver macrophages (SirpαhiMHCII+F4/80lowClec4F−) were not depleted after DT injection, contrary to KCs (SirpαlowMHCIIlowF4/80hiClec4Fhi). Data are representative of 2 experiments. Scale bar, 50 μm.
We further investigated the replenishment of the KC population in mice lacking Ccr2, which have a reduced pool of circulating Ly6Chi monocytes (Serbina and Pamer, 2006). Consequently, 2 days after DT injection Ccr2−/− mice had 4 times less mo-KCs than their heterozygous counterparts (Figures 1A–1C). Note that the remaining mo-KCs were GFPhi confirming that they were still exclusively derived from the few circulating Ly6Chi monocytes (Figure 1B). Nonetheless, at day 6 these mice showed a restored mo-KC population because of a more intense and prolonged proliferation phase than their heterozygous counterparts (Figures 1E and 1F).
Altogether, these results indicate that the replenishment of the KC pool involves a transient recruitment of monocytes within 12 h after KC depletion, followed by their differentiation into F4/80+ mo-KCs within 48 h and their subsequent CSF1R-dependent proliferation until the population reaches the steady-state KC density by day 6 after depletion. This engraftment and proliferation phase occurred over the whole liver parenchyma and was not restricted to a particular hepatic zone (Figure S1C). The diminished recruitment of monocytes observed in the Ccr2−/− mice does not lead to the recruitment of other precursors but is compensated by increased proliferation of the engrafted monocytes.
Acquisition of the KC Identity Begins within Hours after Liver Engraftment
To better understand the signals inducing the engraftment and differentiation of monocytes into KCs, we first set out to precisely define the time frame of these events. We performed a transcriptome analysis on bone marrow (BM) monocytes and mo-KCs 1, 3, 7, 15, and 30 days after KC depletion. Monocytes engrafted within 24 h already lost classical monocyte genes and upregulated general macrophage genes (Figure 2B). We next investigated the expression of KC-associated transcription factors, defined through the comparison of KCs with multiple tissue-resident macrophages obtained from the Immgen Consortium (Gautier et al., 2012, Heng et al., 2008). This revealed that KC-associated transcription factors were already highly expressed in monocytes 24 h after DT injection (Figure 2C). Expression of the KC-core genes (Scott et al., 2018) rapidly increased in the following days (Figure 2D). However, this differentiation process could be influenced by the DTR model and might not reflect the KC development occurring during the embryogenesis. Transcriptome analysis comparison of developing embryonic-derived liver macrophages and developing mo-KCs showed similar acquisition kinetics of KC-associated transcription factors and KC-core genes during both embryogenesis and the DT repopulation model (Figures 2A, 2C, and 2D).
We next sought to investigate the precise time of engraftment of monocytes by intravital two-photon imaging. We crossed Clec4fDTR/+-Ccr2GFP/+ mice with Clec4fCre/+-Rosa26TdT/+ mice to simultaneously visualize GFPhi monocytes and TdThi KCs in live imaging during KC depletion. At steady-state, monocytes were circulating in blood sinusoids with an average speed of 8 μm/min and a confinement index of 0.61 (Figure 2E; Video S2). KC depletion induced a rapid change of monocyte behavior with a decrease of both the average speed and the confinement index (Figure 2; Video S3). Twenty-four hours after KC loss, many monocytes were arrested and had adopted an elongated shape with big processes, resembling KC morphology (Figure 2E; Video S4). Size increase was confirmed by confocal analysis (Figure 2F). However, both two-photon and confocal microscopy showed that a fraction of monocytes remained round and did not arrest in the liver (Figures 2E and 2F). We data-mined our transcriptome data of monocytes developing into KCs and searched by genes coding for surface markers that would rapidly be upregulated by mo-KCs. We found that both Itgax (coding for CD11c) and major histocompatibility complex II (MHCII)-related genes (Cd74, H2-DMa, H2-Aa, and H2-Ab1) were expressed in monocytes recruited to the liver 24 h after DT injection (Figure 2B). We therefore analyzed the expression of CD11c and MHCII during mo-KC differentiation. At steady-state, monocytes were CD11c−MHCII− whereas KCs were CD11cloMHCIIhi (Figure 2G). Twenty-four hours after depletion, a proportion of monocytes were CD11chiMHCIIhi whereas the residual cells remained CD11cloMHCIIlo, confirming the concomitant presence of two monocyte populations in the liver at that time (Figure 2G). In accordance with the transcriptome profile, MHCII remained stable over time on mo-KCs whereas CD11c was gradually downregulated from day 3 onward to reach the steady-state KC expression at 6 day (Figures 2A and 2G). Confocal microscopy revealed that MHCIIhi monocytes were corresponding to the elongated engrafted population whereas MHCII− monocytes were smaller circulating monocytes with a round shape (Figure 2F). Furthermore, qRT-PCR revealed that 24 h after depletion the engrafted CD11chiMHCIIhi monocytes had upregulated KC-associated transcription factors, whereas CD11c−MHCII− monocytes had not (Figure 2H).
Intravital two-photon imaging of a Clec4fDTR/CRE-Ccr2GFP/+-Rosa26TdT/+ mice with KCsTdT/+ (red) and monocytesGFP/+ (green). Mice were injected with PBS. Data are representative of 2 experiments.
Intravital two-photon imaging of a Clec4fDTR/CRE-Ccr2GFP/+-Rosa26TdT/+ mice with KCsTdT/+ (red) and monocytesGFP/+ (green). Mice were injected with DT and imaged 10 h to 16 h after DT. Data are representative of 3 experiments.
Intravital two-photon imaging of a Clec4fDTR/CRE-Ccr2GFP/+-Rosa26TdT/+ mice with KCsTdT/+ (red) and monocytesGFP/+ (green). Mice were injected with DT and imaged 24 h to 28 h after DT. Data are representative of 2 experiments.
Altogether, these results show that only a fraction of the monocytes recruited upon KC death will engraft in the liver and acquire a CD11cHiMHCIIHi profile, display an elongated morphology and express the KC-associated transcription factors.
Engrafted Monocytes and KCs Are in Close Interaction with Hepatic Stellate Cells and Hepatocytes in the Space of Disse
The intravital microscopy revealed that the monocytes that had arrested in one specific spot (Figure 3A, panels 1–6) began to extend processes (Figure 3A, panels 7–11). Confocal microscopy showed that these processes extended across the endothelial vessel wall to reach the liver parenchyma (Figure 3B, panel 1). To identify the cellular target of these processes, we switched to correlative light-electron microscopy (CLEM), a method that allows to overlay fluorescence microscopy data with high resolution electron microscopy (EM) (Figure 3B, panel 2; Figure S2A) (Begemann and Galic, 2016). This revealed that engrafted monocytes extended their processes through the endothelial blood vessel to interact with a droplet-containing cell located in the space of Disse (Figure 3B, panels 3 and 4; Video S5). On the basis of morphology, these cells were identified as hepatic stellate cells (HSCs), pericytes known to store the hepatic retinol in cytoplasmic lipid droplet (Friedman, 2008). Desmin staining on liver slices confirmed that elongated monocytes were strongly interacting with HSCs through the extension of processes across the endothelial cell wall (Figures 3C, 3D, and S2B).
Figure 3.

Recruited Monocytes and Steady-State Kupffer Cells Are in Close Contact with Hepatic Stellate Cells in the Space of Disse
(A) Still images of a time-series performed by intravital two-photon imaging of liver from Clec4fDTR/Cre-Ccr2GFP/+-Rosa26TdT/+ mice showing engraftment of a monocyte and the extension of a dendrite 10–16 h after DT injection.
(B) In 1 is the MIP of Clec4fDTR/+-Ccr2GFP/+ mouse liver sections, with CD31 (blue) and GFP (red). In 2 is the overlay of confocal microscopy and EM, allowing the identification of the monocyte and to delimit the blood vessels. In 3 is 2D EM slice showing the monocyte (red) passing through the endothelium (blue) and interacting with a droplet-rich cell (green) located in between hepatocytes (yellow). Shown in 4, 3D reconstruction of the EM. Data are representative of 2 experiments. Scale bar, 5 μm.
(C) MIP of Clec4fDTR/+-Ccr2GFP/+ mouse liver sections stained for GFP (red), Desmin (green), CD31 (blue), and DAPI (gray) 24 h after DT injection, showing multiple HSC-monocyte interactions outside of blood vessels (arrows). Data are representative of 3 experiments. Scale bar, 10μm.
(D) 3D reconstruction of confocal microscopy from Clec4fDTR/+-Ccr2GFP/+ mouse liver sections stained for GFP (red), Desmin (green), CD31 (blue), and DAPI (gray) 24 h after DT injection. Scale bar, 5μm.
(E) MIP of PBS control Clec4fDTR /+ mouse liver sections stained for Clec4F (red), Desmin (green), CD31 (blue), and DAPI (gray). Data are representative of 5 experiments. Scale bar, 20μm.
(F) Shown in 1 is the MIP of Clec4fCre/+-Rosa26TdT/+ mouse liver sections with CD31 (blue) and TdTomato (red). In 2 is the overlay of confocal microscopy and EM allowing identification of the KC and delimiting of the blood vessels. In 3 is a 2D EM slice showing the KC (red) interacting with an HSC (green) outside of blood vessels (blue) and located in between hepatocytes (yellow). In 4 is the 3D reconstruction of the EM. Scale bar, 10μm.
Related to Figure S2.
CLEM 3D reconstruction showing a monocyte (red) interacting with an HSC (green) and hepatocytes (yellow) across the LSEC barrier (blue).
We next investigated whether steady-state KCs were also interacting with HSCs. Results showed a clear cell-cell interaction between KCs and HSCs with part of KC body inside blood vessels and part of their body inside the perisinusoidal space (Figures 3E and S2C). We also observed that KCs had multiple processes extending to several blood vessels. Because of the thinness of the perisinusoidal space, we decided to confirm these findings by EM. CLEM was performed and 3D reconstruction confirmed a strong KC-HSC interaction taking place in the space of Disse and demonstrated that KCs project their processes into multiple sinusoidal blood vessels (Figure 3E; Video S6).
CLEM 3D reconstruction showing a KC (red) interacting with an HSC (green) and multiple LSECs (blue).
Altogether, these results indicate that, contrary to the general assumption that KCs reside exclusively in the sinusoidal blood vessels, steady-state KCs and mo-KCs are always found with a substantial part of their body in the space of Disse where they strongly interact with HSCs. This puts KCs in continual cell-cell contact with three main cell types as potential candidates for the KC niche: liver sinusoidal endothelial cells (LSECs), HSCs, and hepatocytes.
HSCs and LSECs Are Involved in Monocyte Recruitment and Engraftment
We next sought to investigate which signals induce the rapid but transient engraftment of monocytes within hours after KC loss. Given that we had found that engrafted monocytes were closely interacting with HSCs, LSECs and hepatocytes, we isolated the 3 populations from PBS- and DT-injected mice 12 h and 36 h after injection and compared their transcriptomes (Figures S3A–S3D). Principal component analysis revealed that HSCs were strongly affected (515 differentially expressed [DE] genes) 12 h after DT, LSECs were moderately affected (216 DE genes), whereas hepatocytes were almost not affected (14 DE genes) by KC depletion (Figures 4A and S4A). Ingenuity pathway analysis performed on the DE genes indicated that HSCs and LSECs displayed strong signatures for granulocyte and agranulocyte adhesion and diapedesis (Figures 4B and S4B). HSCs showed a strong upregulation of genes involved in monocyte (Ccl2, Ccl7, Cxcl10, and Pf4) and neutrophil recruitment (Cxcl1, Cxcl5, and Pf4). Genes coding for adhesion molecules involved in the arrest and diapedesis of monocytes (Gerhardt and Ley, 2015) were strongly upregulated by both HSCs (Vcam1, Sele, and Icam1) and LSECs (Vcam1, Sele, Icam1, and Selp) (Figure 4B). We next sought to validate this at the protein level. Enzyme-linked immunosorbent assay (ELISA) performed on serum from PBS- or DT-injected mice confirmed a transient increase of CCL2 reaching a peak 8 h after DT injection (Figure 4C). Confocal microscopy detected a widely distributed pattern of CCL2 expression and identified HSCs as the main CCL2-producing cells 8 h after DT (Figures 4D, arrows, 4E, and S3E). We occasionally found a few CCL2-expressing LSECs (arrows) and monocytes (asterisks) (Figure 4D). We also confirmed the temporal nature of CCL2 expression because the chemokine was no longer detected 16 h after KC depletion (Figure 4E). KC depletion also induced a transient increase of Selectin-E and VCAM-1 on both HSCs and LSECs from 8 h to 16 h after DT injection, reaching a peak at 10 h after DT (Figures 4F and S3F).
Figure 4.

HSCs and LSECs Induce Monocyte Recruitment and Engraftment in the Liver after Kupffer Depletion
(A) Principal component analysis of HSCs, LSECs, and hepatocytes at steady state, 12 h or 36 h after DT injection.
(B) Heatmap of genes involved in granulocyte and agranulocyte adhesion and diapedesis upregulated by HSCs and/or LSECs after KC depletion according to ingenuity pathway analysis.
(C) Analysis by ELISA of CCL2 concentration in the serum of mice after DT injection. Control mice consist of a mix of C57BL/6 DT-injected and Clec4fDTR/+ PBS-injected mice (no differences observed). Pooled data are from 3 experiments. Control mice n = 5 (4h), 6 (10h, 12h, 16h), 9 (8h), and 10 mice (0h). KC-depleted mice n = 5 (0h); 11 (4h, 16h); 12 (12h); 15 (10h) and 16 mice (8h). Two-way ANOVA with Tukey post-test. ∗p < 0.05; ∗∗∗∗p < 0.0001.
(D) On the left is the MIP of Clec4fDTR/+-Ccr2GFP/+ mouse liver sections stained for CCL2 (white), Desmin (green), GFP (orange), F4/80 (red), and CD31 (blue) 8 h after DT injection. CCL2 was mainly co-localized with HSCs (arrows), although a small amount could be found in monocytes (arrowheads) or in LSECs (asterisks). Data are representative of 2 experiments. Scale bar, 20 μm.
(E) Quantification of CCL2+ cells at the indicated time points and normalized per mm2 of tissue. Dots represent individual pictures. Pooled data are from 2 experiments; n = 4. Two-way ANOVA with Tukey post-test. ∗∗∗∗p < 0.0001.
(F) Quantification of VCAM-1 and selectin E expression by HSCs, LSECs, and hepatocytes after DT injection. Given that VCAM-1 was already expressed on HSCs at steady state, data are represented as median fluorescence intensity (MFI) fold increase as compared with PBS control. PBS controls were included in each individual experiment. Selectin E was represented as percentage of positive cells in each cell population. Pooled data are from 2–4 experiments; n = 7 (4h), 8 (10h, 16h, 24h, 48h), 9 (12h), 15 (PBS) and 17 mice (8h). One-way ANOVA with Bonferroni post-test. ∗p < 0.05, ∗∗p < 0.01, ∗∗∗p < 0.001, ∗∗∗∗p < 0.0001.
Altogether, these results show that KC depletion transiently activates HSCs and LSECs. Activated HSCs produce monocyte-attracting chemokines, whereas both activated LSECs and activated HSCs upregulate receptors involved in adhesion and endothelial transmigration. Both chemokines and adhesion molecules are expressed for a restricted time period that coincides with the engraftment and transmigration of monocytes into the space of Disse observed by microscopy. This transient window probably explains why only a fraction of the recruited monocytes were able to engraft in the liver and why proliferation of these mo-KCs was subsequently required to completely repopulate the KC pool.
HSC and LSEC Activation Are Mediated by IL-1 and TNF Released Mainly by Dying KCs
We next set out to identify the signals driving the activation of HSCs and LSECs upon KC loss. To do so, we used NicheNet, an algorithm that infers ligand-receptor interactions inducing gene expression variations by combining transcriptome data of interacting cells with existing knowledge on signaling and gene regulatory networks (Browaeys and Saeys, 2019). We applied NicheNet to predict which ligand-receptor interactions could potentially induce the DE genes found in activated HSCs and LSECs (Figure 5A). The top 5 predicted ligands were tumor necrosis factor (TNF), interleukin-1α (IL-1α) and IL-1β, interferon gamma (IFN-γ), and the apolipoprotein E. HSCs strongly expressed all TNF receptors, IL-1 receptor 1, and IFN-γ receptors, whereas LSECs expressed Tnfrsf1a, Ltbr, IFN-γ receptors, Ldlr, and Il1r1 (Figure 5A). On the basis of predicted upstream ligand activity and receptor expression, we hypothesized that TNF and/or IL-1 were responsible for HSC and LSEC activation. We thus blocked them by injecting a cocktail of anti-TNF antibodies and Anakinra, a recombinant antagonist protein preventing the binding of both IL-1α and IL-1β to the IL-1 receptor (Cavalli and Dinarello, 2018). Confocal imaging and flow-cytometry analysis showed that CCL2 production by HSCs as well as Vascular cell adhesion molecule-1 (VCAM-1) and Selectin E upregulation by HSCs and LSECs were efficiently inhibited by the blocking cocktail (Figures 5B, 5C, and S5A). Consequently, anti-TNF and Anakinra treatment efficiently blocked the recruitment of monocytes to the liver, whereas injection of anti-TNF or Anakinra alone resulted in a partial block (Figures 5D and 5E). As Ly6Chi monocytes engrafting in the liver could be identified by their CD11chiMHCIIhi expression, we evaluated the effect of anti-TNF and Anakinra treatment on their presence and found a significant reduction of CD11chiMHCIIhi monocytes in the liver (Figures 5F and 5G). However, 6 days after KC loss, treated mice displayed the same proportion of KCs as isotype-injected or non-depleted mice (Figure S5B). We thus hypothesized that, as for Ccr2−/− mice (Figure 1F), the few engrafted monocytes proliferated more to compensate for the initial number reduction. EdU incorporation revealed that mo-KCs from treated mice exhibited a stronger and prolonged proliferation phase as compared with isotype-injected mice (Figure S5C).
Figure 5.

HSCs and LSECs Activation, Monocytes Recruitment, and Engraftment in the Liver Are Mediated by Both TNF and IL-1
(A) Schematic representation of the NicheNet analysis of upstream ligand-receptor pairs inducing the DE genes of LSECs and HSCs. Shown in (1) are potential upstream ligands based on HSCs and LSECs DE genes; in (2) (left) are potential receptors expressed by HSCs and LSECs associated with each potential ligands and (right) their expression in LSECs and HSCs; in (3) (top) are potential target genes of the top 3 of potential ligands and (bottom) their relative expression in PBS control or during KC depletion (12 h and 36 h).
(B) MIP of Clec4fDTR/+ mouse liver sections stained for CCL2 (white), Desmin (green), and F4/80 (red) 8 h after DT injection + isotype (top) or Anakinra + anti-TNF (bottom). Data are representative of 2 experiments. Scale bar, 50 μm.
(C) Quantification of VCAM-1 and selectin E expression by HSCs and LSECs 10 h after PBS or DT injection administrated together with either isotype control antibody or with anti-TNF + Anakinra. VCAM-1 is represented as MFI fold increase as compared with PBS control. PBS controls were included in each individual experiment. Selectin E is represented as percentage of positive cells in each cell population. Pooled data from 3 experiments. n = 12. Two-way ANOVA with Tukey post-test. ∗∗∗p < 0.001, ∗∗∗∗p < 0.0001.
(D) Ly6C and F4/80 expression in PBS-injected mice (PBS) or 24 h after (1) DT + isotype control, (2) DT + Anti-TNF, (3) DT + Anakinra, or (4) DT + anti-TNF + Anakinra. Flow-cytometry plots are pre-gated as in Figure 1A. Data are representative of 3 experiments.
(E) Number of Ly6Chi monocytes in the liver of Clec4fDTR/+ mice 24 h after PBS or DT injection together with different combinations of isotype, anti-TNF, and Anakinra. Pooled data are from 3 experiments; n = 10 (PBS, anti-TNF) and 11 (Isotype, Anakinra, Anti-TNF + Anakinra). One-way ANOVA with Bonferroni post-test. ∗p < 0.05, ∗∗p < 0.01, ∗∗∗p < 0.001, ∗∗∗∗p < 0.0001.
(F) CD11c and MHCII expression on Ly6Chi monocytes in PBS-injected mice (PBS) or 24 h after (1) DT + isotype control, (2) DT + Anti-TNF, (3) DT + Anakinra, or (4) DT + anti-TNF + Anakinra. Flow-cytometry plots are pre-gated as in Figure 1A. Data are representative of 3 experiments.
(G) Number of Ly6Chi monocyte subsets according to CD11c and MHCII expression in the liver of Clec4fDTR/+ mice 24 h after PBS or DT injection together with different combinations of isotype control, anti-TNF and Anakinra. Pooled data are from 3 experiments; n = 10 (PBS, anti-TNF) or 11 (Isotype; Anakinra; Anti-TNF + Anakinra). Two-way ANOVA with Tukey post-test. ∗p < 0.05, ∗∗p < 0.01, ∗∗∗p < 0.001, ∗∗∗∗p < 0.0001.
(H) Number of Ly6Chi monocytes in the liver of Clec4f+/DTR-Tnfflox/flox (n = 16) or Clec4fCre/DTR-Tnfflox/flox (n = 12) mice 24 h after DT injection. Pooled data are from 3 experiments. t test. ∗p < 0.05.
(I) Number of the different Ly6Chi monocyte subsets according to CD11c and MHCII expression in the liver of Clec4f+/DTR-Tnfflox/flox (n = 16) or Clec4fCre/DTR-Tnfflox/flox (n = 12) mice 24 h after DT injection. Pooled data are from 3 experiments. Two-way ANOVA with Tukey post-test. ∗∗∗∗p < 0.0001.
Related to Figure S5.
We next sought to identify the cellular source of TNF and IL-1. Genes coding for these cytokines were found to be expressed by KCs and upregulated by mo-KCs along their differentiation (Figure S5D). Depletion of KCs deficient for TNF showed a significant reduction in the number of engrafted CD11chiMHCIIhi monocytes 24 h after DT injection (Figures 5H and 5I). The drop in Clec4fCre/DTRTnffl/fl mice and anti-TNF-treated mice were comparable, suggesting that the dying KCs are the main source of TNF inducing the recruitment of monocytes. We next performed microscopy staining of IL-1α and IL-1β. At steady-state, IL-1α was not detected, whereas IL-1β appeared to be expressed by few platelets (asterisks; Figure S5E). Five hours after DT injection both IL-1α and IL-1β were detected in KCs (arrowheads; Figure S5E). IL-1β was also strongly expressed by many platelets and, consistent with our RNA sequencing (RNA-seq) data, IL-1α was found to be upregulated by LSECs (Figures S4C and S5E, asterisks).
Altogether, these results identify TNF and IL-1 as the main upstream signals leading to the temporary activation of HSCs and LSECs required for the recruitment and engraftment of monocytes in the KC niche. The KCs themselves appear to be one of the main sources of TNF and IL-1.
Bone Morphogenetic Proteins, Notch Signaling, and CSF1 Serve as Potential Upstream Signals of Monocyte Differentiation
We next set out to identify the signals imprinting the KC identity on the engrafted monocytes. NicheNet was used to predict the top five of the potential ligand-receptor pairs that could induce the transcriptome changes occurring between BM monocytes and mo-KCs 3 days after KC loss combined with the top 5 ligand-receptors pairs that can induce the expression of the top 20 KC-associated transcription factors (Figure 2C). Potential HSC-derived ligands included Csf1, a cytokine involved in monocyte-to-macrophage differentiation as well as macrophage chemotaxis, survival, and proliferation. Other HSC-derived ligands included five bone morphogenetic proteins (BMPs): Bmp4, Gdf2 (coding for BMP9), Gdf6, Bmp5, and Bmp10 (Figure 6A); BMP9 was the most highly expressed BMP by the HSCs. The top 10 LSEC potential ligands included BMPs (Bmp2, Bmp6, and Inhbb) and Notch-signaling pathways ligands (Dll1 and Dll4) (Figure 6A); BMP2 was the most highly expressed BMP by the LSECs. Finally, among the potential ligands of hepatocytes, one (Inhbc) belonged to the BMP family (Figure 6A). A circle plot was designed to show the principal target genes for the main predicted upstream signals and the expression of the receptors for the main ligands and the target genes of these ligand-receptor interactions were mapped on monocytes differentiating into KCs (Figures 6B and 6C). This underlined the important overlap between potential BMP-induced and potential DLL-Notch-induced target genes.
Figure 6.

CSF1 and BMP- and Notch-Signaling Pathway Serve as Potential Upstream Signals Inducing Monocyte-to-KC Differentiation
(A) Schematic representation of the NicheNet analysis of upstream ligand-receptor pairs inducing the KC-specific identity. In 1, are the potential upstream ligands from HSCs, LSECs, or hepatocytes based on KC-associated transcription factors and on DE genes found between mo-KC 3 days after KC depletion and BM monocytes; in 2 (top) are potential receptors expressed by monocytes associated with each potential ligands and (bottom) their expression in BM mono and mo-KC during KC repopulation.
(B) Circle plot showing links between (1) predicted ligands from HSCs (green), LSECs (blue), or hepatocytes (yellow) with (2) their associated receptors found on monocytes and (3) KC-associated transcription factors or DE genes (mo-KC 3d versus BM mono) potentially targeted by the ligand-receptors pairs.
(C) On the left are genes potentially targeted by CSF1, BMP molecules, and/or Notch-signaling pathway and on the right their relative expression in BM mono or mo-KCs during KC repopulation.
Altogether, NicheNet highlighted the following signals as potential upstream signals driving KC development: CSF1 from HSCs, DLL-Notch from LSECs, and BMPs from both HSCs and LSECs.
HSCs, LSECs, and Hepatocytes Differentially Contribute to KC Development
To better characterize the expression of CSF1 in the liver, we performed confocal imaging on steady-state liver tissue 8 h after depletion. In accordance with our transcriptomic data, at steady-state HSCs were identified as the main CSF1-expressing cells with only few CSF1-expressing LSECs, identifying HSCs as the main source of CSF1 within the steady-state KC niche (Figures 7A, S6A, and S6B). Nonetheless, depletion of KCs induced a transient upregulation of CSF1 production by both cell types, indicating that HSCs and LSECs may play a role during monocyte differentiation and proliferation (Figures S6A, S6B, and S6C and 1E–1G). IL-34 is another known ligand of CSF1R (Wang and Colonna, 2014). In contrast to Csf1, Il34 was exclusively expressed by HSCs and was only minimally increased upon activation (Figure S6A). IL-34 expression by HSCs was confirmed by confocal microscopy and correlated with the location of KCs (Figure 7A). Conversely, KCs showed expression of 3 different platelet-derived growth factor (PDGF) molecules, a major growth factor family involved in the survival and proliferation of stromal cells, indicating a potential reciprocal loop between HSCs and KCs (Figure S6C) (Andrae et al., 2008, Heldin and Westermark, 1999, Zhou et al., 2018).
Figure 7.

HSCs, LSECs and Hepatocytes Imprint the KC Identity
(A) MIP of Clec4fDTR/+ mouse liver sections stained for (left) CSF1 (red), Desmin (green), CD31 (blue), and DAPI (gray) or (right) IL-34 (gray), Desmin (green), F4/80 (red), and CD31 (blue). At steady state, CSF1 is mainly produced by HSCs (arrows) with a small contribution of LSECs (arrowheads), whereas IL-34 is exclusively produced by HSCs. Data are representative of 2 experiments. Scale bars, 20 μm (left) and 50 μm (right).
(B) Relative expression of KC-associated transcription factor mRNA in BM monocytes cultured 12 h alone or together with either HSCs, LSECs, or hepatocytes. Pooled data are from 2 experiments; n = 6. One way ANOVA with Bonferroni post-test. ∗p < 0.05, ∗∗p < 0.01, ∗∗∗p < 0.001, ∗∗∗∗p < 0.0001.
(C and D) Relative expression of KC-associated transcription factor mRNA (Nr1h3, Spic) or KC-core genes (Cd5l, Cdh5, Cd38, Cd207, Clec4f) in BM monocytes cultured during (C) 12 h or (D) 6 days on a feeder layer of OP9-DL4 or OP9-GFP with or without recombinant BMP2 or BMP9. Pooled data are from 3 experiments; n = 12 per group. Two-way ANOVA with Tukey post-test. ∗p < 0.05, ∗∗p < 0.01, ∗∗∗p < 0.001, ∗∗∗∗p < 0.0001.
(E) Representative histograms of CD38 or CD207 expression by BM monocytes cultured 6 days on a feeder layer of OP9-DL4 or control OP9-GFP with or without recombinant BMP2 or BMP9. Data are representative of 3 experiments.
(F) Fold change of relative expression of Nr1h3 and Spic in Cd11chi MHCIIhi monocytes 24 h after DT injection from mice pretreated 24 h before DT injection with either isotype antibodies or a combination of anti-DLL1 and DLL4 antibodies. Pooled data are from 3 experiments; n = 12. t test ∗p < 0.05, ∗∗p < 0.01.
To narrow down the list of potential ligand-receptor interactions inducing the expression of the main KC-associated transcription factors, we performed 12 h co-culture experiments of BM monocytes with HSCs, LSECs, or hepatocytes. Nr1h3, Rxra, and Spic were induced upon co-culture with LSECs, whereas Id3 was induced upon co-culture with hepatocytes (Figure 7B). Given that we have recently shown that LXR-α controls 30% of the liver-specific identity of KCs and is essential for KC survival (Scott et al., 2018), we decided to focus on the induction of LXR-α expression by LSECs. NicheNet analysis had predicted DLL-Notch as the predominant LSEC-monocyte interaction (Figure 6A). We decided to proceed with DLL4 because it was the highest expressed DLL on LSECs. Given that NicheNet predicted an important overlap between DLL-Notch target genes and BMP target genes in mo-KCs, we also took BMP2 and BMP9 along because these are the main BMP molecules expressed by LSECs and HSCs, respectively.
BM monocytes were cultured on a feeder layer of DLL4-expressing OP9 cells (OP9-DL4) or control GFP-expressing OP9 cells (OP9-GFP), in presence or absence of BMP2 or BMP9. Expression of Nr1h3 and Spic were induced by DLL4 stimulation in monocytes within 12 h but failed to induce the expression of KC-core genes (Clec4f, Cd207, Cd5l, and Cdh5) except for the LXR-α-dependent KC gene Cd38 (Figures 7C and S7A) (Scott et al., 2018). Addition of BMP2 or BMP9 did not significantly alter the expression of any of the tested genes. We next examined the effect of prolonged DLL4 and BMPs stimulation by extending the co-culture for 6 days. Although addition of BMP2 to the culture had no effect on the genes tested, BMP9 increased the expression of Nr1h3- and of Nr1h3-dependent genes (Cd5l and Cdh5) as well as the KC-specific gene Clec4f (mRNA only) and the KC-core markers CD207 and CD38 (mRNA and protein) (Figures 7D, 7E, S7C, and S7D). Conversely, BMP9 did not increase the Spic or Rxra expression (Figure S7B). Altogether these data indicate that Notch signaling is needed to render monocytes responsive to BMP imprinting and that BMP and Notch signaling act in synergy to induce high Nr1h3 expression and imprint part of the KC identity. Given that we had identified the DLL-Notch pathway as the essential trigger to induce part of the LXR-α-controlled KC-module in monocytes, we performed an in vivo blockade of Notch signaling by injecting anti-DLL1 and anti-DLL4 concomitantly with the DT. Twenty-four hours after DT injection, CD11chiMHCIIhi monocytes showed significantly decreased expression of both Nr1h3 and Spic, confirming the relevance of Notch signaling in the acquisition of KC-associated transcription factors in vivo (Figures 7F and S7E).
Altogether these data identify the LSEC-derived DLL-Notch signal as a strong inducer of LXRα, SPIC, and the KC identity, which is further amplified by BMP signaling. The main source of BMP signal could be the BMP9 produced by HSCs.
Discussion
Under homeostatic conditions, monocytes circulate in the liver sinusoids but do not contribute to the adult KC pool (Hoeffel et al., 2015, Schulz et al., 2012, Scott et al., 2016, Yona et al., 2013). However, depletion of KCs induces a rapid recruitment of BM monocytes that engraft in the liver in one single wave, acquire the KC-specific genetic program, and gain the capacity to self-maintain in the liver without any subsequent contribution of BM monocytes (Scott et al., 2016). KC death therefore seems to temporarily allow the engraftment and differentiation of monocytes into KCs, but the precise cellular and molecular events governing this process were unknown. Here, we used a broad set of microscopy techniques to track monocytes developing into KCs and identified the main cells interacting with monocytes during that process. Next, we performed transcriptomic profiling of these cells and utilized NicheNet to prioritize the potential molecular signals driving the repopulation of the KC niche and proceeded to experimentally test the strongest predictions.
We show that contrary to the general assumption, KC are not strictly located inside the blood vessels but always extend an important fraction of their cell body into the perisinusoidal space of Disse where they closely interact with HSCs and hepatocytes. The position of KCs in the space of Disse is functionally important. KCs have been shown to deliver iron they acquire from dying red blood cells to hepatocytes (Theurl et al., 2016). Their position with part of their cell body on each side of the endothelium provides a probable explanation for the efficient uptake of aged red blood cells in the blood vessel and the efficient transfer of iron to hepatocytes. Anecdotally, Karl Wilhelm von Kupffer originally mixed-up KCs and HSCs. He first described stellar-shaped cells on the basis of gold chloride incorporation, which stains the retinol inside the HSCs. Later, he injected India ink or sheep red blood cells and identified phagocytic stellar-shaped cells, now known to be the KCs, and thought that both cells were one same cell that he called “Sternzellen.” Seeing the co-localization of these cells and their strong cell-cell interactions in the space of Disse it is now easy to understand where the confusion came from (Von Kupffer, 1876, Wake, 2004).
The Medzhitov group recently proposed that fibroblasts and macrophages form a stable two-cell circuit in which the population density is controlled through exchange of growth factors. In these cultures, CSF1 is provided by fibroblasts and binds CSF1R on macrophages that in return produce PDGF, essential for fibroblast survival (Zhou et al., 2018). We found that under homeostatic conditions HSCs are the main cellular source of CSF1 and IL-34, the two primary macrophage growth factors. Furthermore, Pdgfc is gradually expressed during mo-KCs development. The HSC-KC interaction might thus represent the in vivo equivalent of the in vitro cell-cell circuit described by Zhou and colleagues. They also found that in vitro cultures starting at a 1:10 macrophage-fibroblast ratio triggered macrophage proliferation until a stable cell-cell ratio around 1:1 was obtained (Zhou et al., 2018). Here, we showed that monocyte engraftment was followed by a proliferation phase until the steady-state KC density was recovered. Lowering the starting mo-KC population by diminishing the number of available precursors (Ccr2−/− mice) or dampening the engraftment of monocytes (anti-TNF + Anakinra treatment) resulted in a prolonged proliferation phase but in the end yielded the same KC population density, thus fitting with a stable HSC-KC circuit that, on the basis of our microscopy, would also stabilize around a 1:1 ratio.
The engraftment of monocytes in the liver after KC depletion is transient in nature. This short window of opportunity for engraftment in the liver is explained by the transient TNF and IL-1-dependent activation of HSCs and LSECs that induces the brief expression of monocyte-attracting chemokines and adhesion molecules. We have recently hypothesized that macrophage precursors might compete for a restricted number of niches per organ and proposed niche accessibility and niche availability as the predominant factors determining the outcome of this competition (Guilliams and Scott, 2017). Here, we generated maximal niche availability by complete depletion of the KC population. Nonetheless, only a fraction of the recruited monocytes engrafted in the liver and did so only in the first few hours after KC depletion. We feel this illustrates the importance of niche accessibility given that in this KC repopulation model the niche only temporarily “opens” when the molecules specialized in the recruitment, arrest, and transmigration of monocytes across the endothelial barrier are expressed.
Finally, we set out to unravel the signals driving the acquisition of the KC-specific identity by monocytes. It was previously shown that ID3 and LXR-α control an important part of the KC-specific identity (Mass et al., 2016, Scott et al., 2018). We showed that these transcription factors are acquired by engrafted monocytes within 24 h after KC depletion. We report that the LSECs are the main niche cell inducing LXR-α expression in monocytes and demonstrate that DLL4-induced Notch activation lead to the rapid expression of LXR-α in monocytes as well as part of the KC identity. Importantly, in vivo blocking of Notch signaling dampened the expression of the transcription factors Nr1h3 and Spic in recruited monocytes, confirming the role of Notch signaling in the acquisition of KC identity in vivo. Remarkably, it has recently been reported that DLL4 expression on LSECs is zonated, being highly expressed in the periportal region and lowly expressed around the central vein, therefore correlating with the location of KCs (Halpern et al., 2018). NicheNet also highlighted an important overlap between predicted BMP- and Notch-target genes. We found that Notch signaling is needed to render the monocytes responsive to BMP activity, because BMPs alone did not induce the expression of any of the KC-associated genes, whereas the combination between Notch and BMP9 signaling synergized to induce high expression of Nr1h3 and Nr1h3-dependent KC genes. However, HSCs and LSECs express many BMPs, so the in vivo relevance of the different BMPs in the imprinting of the KC identity remains to be determined. Finally, we showed that Id3 expression is strongly induced in monocytes cultured with hepatocytes. The underlying molecular pathway driving ID3 expression by the hepatocytes still has to be determined, but the transmigration of the monocytes inside the perisinusoidal space of Disse might be crucial to bring the monocytes in close contact with hepatocytes and receive the signals imprinting ID3.
Altogether this study sheds light on the cell-cell interactions governing the engraftment and tissue-specific imprinting of monocytes differentiating into resident macrophages and emphasizes the differential roles of fibroblasts, endothelial cells, and parenchymal cells in this process. The localization of an important part of the KC body inside the space of Disse ensures the continuous close contact of KCs with these three cells. Death of KCs, in part through the release of TNF and IL-1, induces the activation of HSCs and LSECs, temporarily opening the KC niche for monocyte colonization and allowing their engraftment and transmigration into the space of Disse. Interaction with hepatocytes induces ID3, whereas interaction with LSECs induces LXR-α via the DLL4-Notch pathway. Moreover, we found that the HSC-associated BMP9 can synergize with Notch signaling to amplify the LXR-α-controlled KC-module. Although this remains to be determined, we believe these mechanisms will also play a role in monocyte engraftment during liver injury or infections. Finally, we hope this study will represent a blueprint for the study of cell-cell interactions in other macrophage niches across tissues and species.
STAR★Methods
Key Resources Table
| REAGENT or RESOURCE | SOURCE | IDENTIFIER |
|---|---|---|
| Antibodies | ||
| Anti-armenian hamster monoclonal IgG isotype control (Armenian hamster, clone PIP), unconjugated | Bio X Cell | Cat#BE0260; RRID: AB_2687739 |
| Anti-armenian hamster Polyclonal antibody (Goat), AF647 conjugated | Jackson ImmunoResearch | Cat#127-605-160; RRID: AB_2339001 |
| Anti-chicken IgY Polyclonal antibody (Goat), AF680 conjugated | Abcam | Cat#ab175779 |
| Anti-goat Polyclonal antibody (Donkey), AF488 conjugated | Thermo Fisher | Cat#A-11055; RRID: AB_142672 |
| Anti-goat Polyclonal antibody (Donkey), AF555 conjugated | Thermo Fisher | Cat#A-21432; RRID: AB_141788 |
| Anti-goat Polyclonal antibody (Donkey), AF647 conjugated | Thermo Fisher | Cat#A-21447; RRID: AB_141844 |
| Anti-mouse CCL2 Monoclonal antibody (Armenian hamster, clone 2 h5), unconjugated | Biolegend | Cat#505902; RRID: AB_315408 |
| Anti-mouse CD11b Monoclonal antibody (Rat, clone M1/70), BV605 conjugated | Biolegend | Cat#101237; RRID: AB_11126744 |
| Anti-mouse CD11b Monoclonal antibody (Rat, clone M1/70), PE-Cy7 conjugated | BD Biosciences | Cat#552850; RRID: AB_394491 |
| Anti-mouse CD11c Monoclonal antibody (Armenian hamster, clone N418), PE-eFluor 610 conjugated | Thermo Fisher | Cat#61-0114-82; RRID: AB_2574530 |
| Anti-mouse CD31 Monoclonal antibody (Rat, clone 390), FITC conjugated | Thermo Fisher | Cat#11-0311-82; RRID: AB_465012 |
| Anti-mouse CD31 Monoclonal antibody (Rat, clone MEC 13.3), unconjugated | BD Biosciences | Cat#550274; RRID: AB_393571 |
| Anti-mouse CD38 Monoclonal antibody (Rat, clone 90), Alexa Fluor 700 conjugated | Thermo Fisher | Cat#56-0381-82; RRID: AB_657740 |
| Anti-mouse CD41 Monoclonal Antibody (Rat, clone MWReg30), Unconjugated | BD Biosciences | Cat#553847; RRID: AB_395084 |
| Anti-mouse CD45 Monoclonal antibody (Rat, clone 30-F11), AF700 conjugated | Thermo Fisher | Cat#56-0451-82; RRID: AB_891454 |
| Anti-mouse CD45 Monoclonal antibody (Rat, clone 30-F11), BV510 conjugated | Biolegend | Cat#103138; RRID: AB_2563061 |
| Anti-mouse CD45 Monoclonal antibody (Rat, clone 30-F11), PE-Cy7 conjugated | Thermo Fisher | Cat#25-0451; RRID: AB_469625 |
| Anti-mouse CD54 (ICAM-1) Monoclonal antibody (Rat, clone YN1/1.7.4), AF488 conjugated | Biolegend | Cat#116111; RRID: AB_493494 |
| Anti-mouse CD61 Monoclonal antibody (Hamster, clone 2C9.G2), PE conjugated | Biolegend | Cat#104308; RRID: AB_313085 |
| Anti-mouse CD62E (Selectin E) Monoclonal antibody (Rat, clone 10E9.6), PE conjugated | BD Biosciences | Cat#553751; RRID: AB_395031 |
| Anti-mouse CD64 Monoclonal antibody (Mouse, clone X54-5/7.1) BV711 conjugated | Biolegend | Cat#139311; RRID: AB_2563846 |
| Anti-mouse CD106 (VCAM-1) Monoclonal Antibody (Rat, clone 429), AF647 conjugated | Biolegend | Cat#105712; RRID: AB_493429 |
| Anti-mouse CD115 (c-fms) Monoclonal antibody (Rat, clone AFS98), PerCP-eFluor 710 conjugated | Thermo Fisher | Cat#46-1152-82; RRID: AB_10597740 |
| Anti-mouse CD140b (PDGFRb) Monoclonal antibody (Rat, clone APB5) Biotin conjugated | Thermo Fisher | Cat#13-1402-82; RRID: AB_466609 |
| Anti-mouse CD146 Monoclonal antibody (Rat, clone ME-9F1), APC conjugated | Biolegend | Cat#134712; RRID: AB_2563088 |
| Anti-mouse CD172a (Sirpα) Monoclonal antibody (Rat, clone P84), unconjugated | BD Biosciences | Cat#552371; RRID: AB_394371 |
| Anti-mouse CD207 Monoclonal antibody (Rat, clone 929F3.01), Alexa Fluor 647 conjugated | IMGENEX | Cat#DDX0362A647; RRID: AB_1148741 |
| Anti-mouse Clec4F Polyclonal antibody (Goat), unconjugated | R&D Systems | Cat#AF2784; RRID: AB_2081339 |
| Anti-mouse Desmin Polyclonal antibody (Goat), unconjugated | R&D Systems | Cat#AF384; RRID: AB_2092419 |
| Anti-mouse Desmin Polyclonal antibody (Rabbit), unconjugated | Abcam | Cat#ab15200; RRID: AB_301744 |
| Anti-mouse DLL1 Monoclonal antibody (Armenian hamster, clone HMD1-5), unconjugated | Bio X Cell | Cat#BE0155; RRID: AB_10950546 |
| Anti-mouse DLL4 Monoclonal antibody (Armenian hamster, clone HMD4-2), unconjugated | Bio X Cell | Cat#BE0127; RRID: AB_10950366 |
| Anti-mouse F4/80 Monoclonal antibody (Rat, clone BM8), AF594 conjugated | Biolegend | Cat#123140; RRID: AB_2563241 |
| Anti-mouse F4/80 Monoclonal antibody (Rat, clone BM8), BV785 conjugated | Biolegend | Cat#123141; RRID: AB_2563667 |
| Anti-mouse F4/80 Monoclonal antibody (Rat, clone BM8), biotin conjugated | eBioscience | Cat#13-4801-85; RRID: AB_466657 |
| Anti-mouse GFP Polyclonal antibody (Chicken), unconjugated | Aves Labs | Cat#GFP-1010; RRID: AB_2307313 |
| Anti-mouse I-A/I-E (MHCII) Monoclonal antibody (Rat, clone M5/114.15.2), Alexa Fluor 700 conjugated | Thermo Fisher | Cat#56-5321-82; RRID: AB_494009 |
| Anti-mouse I-A/I-E (MHCII) Monoclonal antibody (Rat, clone M5/114.15.2), Biotin conjugated | BioLegend | Cat#107604; RRID: AB_313319 |
| Anti-mouse I-A/I-E (MHCII) Monoclonal antibody (Rat, clone M5/114.15.2), FITC conjugated | Thermo Fisher | Cat#11-5321-85; RRID: AB_465233 |
| Anti-mouse I-A/I-E (MHCII) Monoclonal antibody (Rat, clone M5/114.15.2), unconjugated | Biolegend | Cat#107602; RRID: AB_313317 |
| Anti-mouse IL-1 alpha Polyclonal antibody (Rabbit), unconjugated | Abcam | Cat#ab9724; RRID: AB_308766 |
| Anti-mouse IL-1 beta Polyclonal antibody (Goat), unconjugated | R&D Systems | Cat#AF-401-NA; RRID: AB_416684 |
| Anti-mouse IL-34 Polyclonal antibody (Sheep), unconjugated | R&D Systems | Cat#AF5195; RRID: AB_2124393 |
| Anti-mouse Ki-67 Monoclonal antibody (Mouse, clone B56), PerCP-Cy5.5 conjugated | BD Biosciences | Cat#561284; RRID: AB_10611574 |
| Anti-mouse Ki-67 Monoclonal antibody (Rat, clone TEC-3), unconjugated | Agilent | Cat#M7249; RRID: AB_2250503 |
| Anti-mouse Ly6C Monoclonal antibody (Rat, clone HK1.4), eF450 conjugated | Thermo Fisher | Cat#48-5932-82; RRID: AB_10805519 |
| Anti-mouse Ly6C Monoclonal antibody (Rat, clone HK1.4), PE conjugated | BD Biosciences | Cat#560592; RRID: AB_1727556 |
| Anti-mouse Ly6G Monoclonal antibody (Rat, clone 1A8), AF700 conjugated | BD Biosciences | Cat#561236; RRID: AB_10611860 |
| Anti-mouse Ly6G Monoclonal antibody (Rat, clone 1A8), PE conjugated | BD Biosciences | Cat#551461; RRID: AB_394208 |
| Anti-mouse Lyve-1 Polyclonal antibody (Goat), unconjugated | R&D Systems | Cat#AF2125; RRID: AB_2297188 |
| Anti-mouse Lyve-1 Monoclonal antibody (Rat, clone ALY7), Biotin conjugated | Thermo Fisher | Cat#13-0443-82; RRID: AB_1724157 |
| Anti-mouse Lyve-1 Monoclonal antibody (Rat, clone ALY7), eFluor660 conjugated | Thermo Fisher | Cat#50-0443-82; RRID: AB_10597449 |
| Anti-mouse M-CSF Polyclonal antibody (Goat), unconjugated | R&D Systems | Cat#AF416; RRID: AB_355351 |
| Anti-mouse Siglec F Monoclonal antibody (Rat, clone E50-2440) BUV395 conjugated | BD Biosciences | Cat#740280; RRID: AB_2740019 |
| Anti-mouse Siglec F Monoclonal antibody (Rat, clone E50-2440) PE conjugated | BD Biosciences | Cat#552126; RRID: AB_394341 |
| Anti-mouse Tim-4 Monoclonal antibody (Rat, clone RMT4-54), PerCP-Cy5.5 Conjugated | Thermo Fisher | Cat#46-5866-82; RRID: AB_2573781 |
| Anti-mouse TNFα Monoclonal antibody (Rat, clone XT3.11), unconjugated | Bio X Cell | Cat#BE0058; RRID: AB_1107764 |
| Anti-rabbit Polyclonal antibody (Donkey), AF488 conjugated | Jackson ImmunoResearch | Cat#711-546-152; RRID: AB_2340619 |
| Anti-rabbit Polyclonal antibody (Donkey), AF647 conjugated | Thermo Fisher | Cat#A-21244; RRID: AB_2535812 |
| Anti-rat Polyclonal antibody (Donkey), AF488 conjugated | Thermo Fisher | Cat#A-21208; RRID: AB_2535794 |
| Anti-rat Polyclonal antibody (Donkey), Cy3 conjugated | Jackson ImmunoResearch | Cat#712-166-153; RRID: AB_2340669 |
| Anti-sheep Polyclonal antibody (Donkey), AF647 conjugated | Thermo Fisher | Cat#A-21448; RRID: AB_2535865 |
| Chemicals, Peptides, and Recombinant Proteins | ||
| Anakinra | gift from Mo Lamkanfi | N/A |
| Antigenfix | Diapath | Cat#P0014 |
| 2-mercaptoethanol | Sigma | Cat#3148 |
| BSA | Sigma-Aldrich | Cat#A8806 |
| Cacodylate (Sodium)buffer 0,2M pH7.4 | EMS | Cat#11652 |
| Calcium chloride | Sigma-Aldrich | Cat#449709 |
| Collagenase A | Sigma-Aldrich | Cat#11088793001 |
| Corn oil | Sigma-Aldrich | Cat#C8267 |
| Corning Collagen I, Bovine | Corning | Cat#354231 |
| D-(+)-Glucose | Sigma-Aldrich | Cat#D9434 |
| DAPI | Thermo Fisher | Cat#D3571 |
| Diphtheria toxin | Sigma-Aldrich | Cat#D0564 |
| DMEM/F12 | ThermoFisher | Cat#11320074 |
| Dnase I | Sigma-Aldrich | Cat#04 536 282 001 |
| Donkey serum | Abcam | Cat#ab7475 |
| DPBS | Lonza | Cat#BE15-512D |
| EDTA | Westburg | Cat#51234 |
| EGTA | Sigma-Aldrich | Cat#E3889 |
| FC block (clone 2.4G2) | Bioceros | N/A |
| Fetal Bovine Serum (South America), Gamma Irradiated | Bodinco | S181G |
| Gentamicin | GIBCO | Cat#15710-049 |
| GlutaMAX | Life Technologies | Cat#35050-038 |
| Glutamine | Lonza | Cat#BE17-605F |
| Gluteraldehyde 25% | Sigma-Aldrich | Cat#G5882 |
| Goat serum | Sigma-Aldrich | Cat#G9023 |
| HEPES | Sigma-Aldrich | Cat#H3375 |
| L-Aspartic Acid | Sigma-Aldrich | Cat#A8949 |
| Lead (II) Nitrate | Sigma-Aldrich | Cat#07905CJ |
| M-CSF | VIB Protein Service Facility | N/A |
| MEM alpha | GIBCO | Cat#22571-020 |
| Osmium Tetroxide 4% | EMS | Cat#19150 |
| Paraformaldehyde 10% | EMS | Cat#15712 |
| Penicillin-streptomycin | GIBCO | Cat#15140-122 |
| PLX3397 | Achemblock | Cat#H-8970 |
| Phenol Red | Sigma-Aldrich | Cat#P3532 |
| Potassium chloride | Sigma-Aldrich | Cat#P9541 |
| Potassium Ferricyanide | EMS | Cat#20150 |
| ProLong Diamond | Thermo Fisher | Cat#P36970 |
| Rat serum | Sigma-Aldrich | Cat#R9759 |
| Recombinant Human/Mouse/Rat BMP-2 Protein | RnD Systems | Cat#355-BM-010 |
| Recombinant Human/Mouse/Rat BMP-9 Protein | RnD Systems | Cat#5566-BP-010 |
| RPMI | Thermo Fisher | Cat#21875-059 |
| Saponin | Sigma-Aldrich | Cat#4521 |
| Sodium bicarbonate | Sigma-Aldrich | Cat#792519 |
| Sodium chloride | Sigma-Aldrich | Cat#746398 |
| Sodium Dihydrogen Phosphate Monohydrate | Sigma-Aldrich | Cat#000000001063461000 |
| Sodium phosphate dibasic dihydrate | Sigma-Aldrich | Cat#71643 |
| Streptavidin, BV605 conjugated | BD Biosciences | Cat#563260 |
| Streptavidin, PE-CF594 conjugated | BD Biosciences | Cat#562284 |
| Thiocarbohydrazide | EMS | Cat#21900 |
| Tissue-Tek O.C.T | Sakura Finetek | Cat#4583 |
| Trypsin-EDTA (0,25%), phenol red | GIBCO | Cat#25200072 |
| Uranyl Acetate Replacement | EMS | Cat#22405 |
| Critical Commercial Assays | ||
| ALLin HS Red Taq Mastermix 2x | highQu | Cat#HQ.HSM0350 |
| Click-iT Plus EdU Alexa Fluor 647 | Thermo Fisher | Cat#C10634 |
| Live/Dead eFluor 780 | Thermo Fisher | Cat#65-0865-18 |
| MCP-1/CCL2 Mouse Uncoated ELISA Kit | Thermo Fisher | Cat#88-7391-88 |
| RNEasy Plus Micro Kit | QIAGEN | Cat#74034 |
| Sensifast cDNA synthesis kit | Bioline | Cat#BIO-65054 |
| SensiFAST sybr no-ROX mix | Bioline | Cat#BIO-98020 |
| Deposited Data | ||
| Murine RNA-sequencing data | This paper | GEO: GSE135790 |
| Murine Micro-array data | This paper | GEO: GSE135790 |
| Experimental Models: Cell Lines | ||
| OP9-DL4 | Gift from Tom Taghon | Van de Walle et al., 2011 |
| OP9-GFP | Gift from Tom Taghon | Van de Walle et al., 2011 |
| Experimental Models: Organisms/Strains | ||
| Mouse: C57BL/6j SPF | Janvier Labs | N/A |
| Mouse: B6(C)-Ccr2 tm1.1Cln/J | The Jackson Laboratory | JAX: 027619 |
| Mouse: B6;129S6-Gt(ROSA)26Sortm9(CAG-tdTomato)Hze/J | JAX: 007905 | |
| Mouse: Clec4f-cre | CIPHE, Marseille, France | |
| Mouse:B6-Clec4fhDTR/YFP-CIPHE | CIPHE, Marseille, France | |
| Mouse: Tnf tm1.1Sned | Grivennikov et al., 2005 | |
| Oligonucleotides | ||
| Nr1 h3 qPCR FWD: | N/A | CAAGGGAGCACGCTATGTCTG |
| Nr1 h3 qPCR REV: | N/A | GGACACCGAAGTGGCTTGAG |
| Rxra qPCR FWD: | N/A | GATATCAAGCCGCCACTAGG |
| Rxra qPCR REV: | N/A | TTGCAGCCCTCACAACTGTA |
| Id3 qPCR FWD: | N/A | CTGTCGGAACGTAGCCTGG |
| Id3 qPCR REV: | N/A | GTGGTTCATGTCGTCCAAGAG |
| Spic qPCR FWD: | N/A | AAACATTTCAAGACGCCATTGAC |
| Spic qPCR REV: | N/A | CTCTGACGTGAGGATAAGGGT |
| B2m qPCR FWD: | N/A | CGGCCTGTATGCTATCCAGAA |
| B2m qPCR REV: | N/A | GGCGGGTGGAACTGTGTTA |
| Cd5l qPCR FWD: | N/A | GAGGACACATGGATGGAATGT |
| Cd5l qPCR REV: | N/A | ACCCTTGTGTAGCACCTCCA |
| Actb qPCR FWD: | N/A | GCTTCTAGGCGGACTGTTACTGA |
| Actb qPCR REV: | N/A | GCCATGCCAATGTTGTCTCTTAT |
| Clec4f qPCR FWD: | N/A | GAGGCCGAGCTGAACAGAG |
| Clec4f qPCR REV: | N/A | TGTGAAGCCACCACAAAAAGAG |
| Cd207 qPCR FWD: | N/A | CCGAAGCGCACTTCACAGT |
| Cd207 qPCR REV: | N/A | GCAGATACAGAGAGGTTTCCTCA |
| Cd38 qPCR FWD: | N/A | TCTCTAGGAAAGCCCAGATCG |
| Cd38 qPCR REV: | N/A | GTCCACACCAGGAGTGAGC |
| Cdh5 qPCR FWD: | N/A | CACTGCTTTGGGAGCCTTC |
| Cdh5 qPCR REV: | N/A | GGGGCAGCGATTCATTTTTCT |
| Software and Algorithms | ||
| FlowJo v11 | FlowJo | https://www.flowjo.com |
| GraphPad Prism 7 | GraphPad Software | https://www.graphpad.com/ |
| Icy | N/A | http://icy.bioimageanalysis.org/ |
| ImageJ v1.51j | NIH | https://imagej.nih.gov/ij |
| Imaris v7.6.4 | Bitplane: Imaris | www.bitplane.com |
| Ingenuity Pathway Analysis | QIAGEN Bioinformatics | https://www.qiagenbioinformatics.com/products/ingenuity-pathway-analysis/ |
| Inkscape | N/A | https://inkscape.org |
| Kdenlive | N/A | https://kdenlive.org/en/ |
| Microscopy Image Browser | N/A | http://mib.helsinki.fi/ |
| NicheNet | N/A | https://zenodo.org/record/1484138 |
Lead Contact and Materials Availability
Further information and requests for resources and reagents should be directed to, and will fulfilled by, the Lead Contact, Martin Guilliams (martin.guilliams@irc.ugent.be).
Experimental Model and Subject Details
In Vivo Animal Studies
The following mouse models were used; Clec4fDTR (Scott et al., 2016), Clec4fCRE (Scott et al., 2018), Rosa26TdT/+ (Madisen et al., 2010), CCR2GFP/+ (Satpathy et al., 2013), TNFflox/flox (Grivennikov et al., 2005). All mice were used on a C57BL/6 background and a mix of male and female mice were used for each experiment. Mice were used between 6 and 10 weeks of age. All mice were bred and maintained at the VIB (Ghent University) under specific pathogen free conditions. All animals were randomly allocated to experimental groups and littermate controls were used in all experiments. All experiments were performed in accordance with the ethical committee of the Faculty of Science of the VIB (EC2016-052; EC2017-096).
Methods Details
Isolation of liver leukocytes
Livers were isolated from PBS-perfused mice, chopped finely and subjected to GentleMACS dissociation and incubated for 20 min with 1 mg/mL Collagenase A (Sigma) and 10U/mL DNase (Roche) in a shaking water bath at 37°C. Following a second round of GentleMACS dissociation, single cell suspensions were filtered over a 100 μm filter.
Isolation of HSCs, LSECs and Hepatocytes
Hepatocytes, LSECs and HSCs isolation procedure was adapted from Mederacke et al. (Mederacke et al., 2015). After retrograde cannulation, livers were first perfused with a EGTA-containing solution for 1–2 min following by a perfusion with 0,2 mg/mL collagenase A-containing solution for 5 min (6 mL/min). Livers were minced and incubated 20 min with 0,4 mg/mL Collagenase A and 10U/mL DNase in a water bath at 37°C. All the subsequent procedures were at 4°C. After filtration with a 100 μm mesh filter, the cell suspensions were centrifuged at 400 g for 7 min and re-suspended in 2 mL of red blood lysis buffer for 2 min to remove any red blood cells left. Suspensions were washed in PBS and further filtered on a 40 μm mesh filter and centrifuged twice for 1 min at 50 g resulting in an hepatocytes-enriched fraction (pellet) and a leukocytes/LSECs/HSCs-enriched fraction (supernatant). Both fractions were further centrifuged at 400 g for 7 min before to proceeding to FACS staining.
Isolation of BM monocytes
Bone-marrow was isolated from the tibia and femur of mice by flushing the bones with RPMI 1640 (GIBCO). Red blood cells were lysed and single cell suspensions were stained with fluorescently labeled antibodies. BM monocytes were sorted based on CD45, Ly6C, CD115, and CD11b expression.
Flow Cytometry
Cells (0.5–5x10⁶) were pre-incubated with 2.4G2 antibody (Bioceros) to block Fc receptors, stained with appropriate antibodies at 4°C in the dark for 30 min and permeabilized for KI-67 and EDU staining according to the manufacturer’s protocol (Click-iT Plus EdU, Thermo Fisher). Cell viability was assessed using Fixable Viability dye eFluor780 (Thermo Fisher) and the cell suspensions were analyzed with a Fortessa or a FACSymphony (BD Biosciences) and FlowJo software (TreeStar). Retinol fluorescence was visualized using a 405–407 nm laser for excitation and a 450/50 nm band-pass filter for detection. KCs/HSCs/LSECs/hepatocytes were sorted using an ARIA II or ARIA III (BD, Biosciences) with a purity ≥ 90% (not shown). The full list of antibodies used can be found in the Key Resources Table.
Liver cells and monocytes co-culture
HSCs, LSECs, hepatocytes and BM monocytes from CCR2GFP/+ mice were sorted in RPMI 1640 supplemented with 10% FCS (Bodinco) using an ARIA II or ARIA III. Cells were then resuspended in DMEM/F12 (GIBCO) supplemented with 10% FCS, 30 ng/mL CSF1 (VIB Protein Service Facility), 2 mM Glutamine (Lonza), 100 U/mL penicillin (GIBCO) and 100 μg/mL streptomycin (GIBCO). 1x10⁵ monocytes were seeded in bovine collagen type I-coated (Corning) round bottom 96-well plates either alone or at a 1:1 ratio with HSCs, LSECs or hepatocytes in a final volume of 200 μl culture medium and incubated for 12 h (37°C, 5% CO2). After incubation, cells were harvested with 0,25% Trypsin-EDTA (GIBCO) and GFP+ cells were sorted in RLT plus (QIAGEN) containing 1% β-mercaptoethanol (Sigma) with the FACSAria III and stored at −80°C.
OP9 cells and monocytes co-culture
OP9-GFP and OP9-DL4 were cultured in MEMα (GIBCO) supplemented with 20% FCS, 1x GlutaMAX (GIBCO) and 0,056 mg/mL Gentamicin ( = cMEMα). Two days prior to the coculture, 2x10³ or 2,5x10⁴ OP9-GFP cells and OP9-DL4 cells were seeded in separate wells of a 96-well U-bottom plates or 12-well plates respectively to generate a feeder layer. BM monocytes from C57BL/6 mice were sorted in RPMI 1640 supplemented with 10% FCS (Bodinco) using an ARIA III. Cells were then resuspended in MEMα (GIBCO) supplemented with 20% FCS, 1x GlutaMAX and 0,056 mg/mL Gentamicin. For 12 h coculture experiments, 1x10⁵ monocytes were seeded on an OP9-GFP or OP9-DL4 feeder layer in a 96-well plate in the presence of 30 ng/mL CSF1 alone or together with either BMP2 (50 ng/mL) or BMP9 (50 ng/mL) (RnD Systems). For 6 day coculture experiments, 2x10⁵ monocytes were seeded on an OP9-GFP or OP9-DL4 feeder layer in a 12-well plate in the presence of 30 ng/mL CSF1 together with either BMP2 (50 ng/mL) or BMP9 (50 ng/mL) (RnD Systems). After 3 days, half of the medium was refreshed with cMEMα containing 30 ng/mL CSF1 alone or together with either BMP2 (50 ng/mL) or BMP9 (50 ng/mL). Cells were harvested with pre warmed PBS-0.04% EDTA. For 12 h cocultures, Ly6Chi monocytes were sorted in RLT containing 1% β-mercaptoethanol with the FACSAria III and stored at −80°C. For 6 days cocultured, total cells were analyzed and CD45+GFP− cells were sorted in RLT containing 1% β-mercaptoethanol with the FACSAria III and stored at −80°C.
Confocal microscopy
Immediately after mice sacrifice, inferior vena cava were cannulated and livers were perfused (4 mL/min) with Antigenfix (Diapath) for 5 min at room temperature. After excision, 2-3 mm slices of livers were further fixed by immersion in Antigenfix for 1 h at 4°C, washed in PBS, infused overnight in 30% sucrose and frozen in Tissue-Tek OCT compound (Sakura Finetek). 20 μm-thick slices were cut on cryostat (Microm HM 560, Thermo Scientific). Slices were rehydrated in PBS for 5 min, permeabilized with 0,5% saponin and unspecific binding sites were blocked for 30 min with 2% bovine serum albumin, 1% fetal calf serum and 1% donkey or goat serum. Liver sections from anti-TNF/Anakinra-treated mice or isotype control-treated mice were first incubated with the Fab fragment of donkey anti-rat IgG (Jackson immunoresearch) to prevent the detection of rat anti-TNF or rat isotype with anti-rat secondary antibodies. Tissue sections were then labeled overnight at 4°C with primary antibodies followed by incubation for 1 h at room temperature with secondary antibodies and DAPI. Slides were mounted in ProLong Diamond, imaged with a Zeiss LSM 780 confocal microscope (Carl Zeiss) and analyzed using ImageJ v1.51 and iMaris v7.6.4 software.
Correlative light-electron microscopy
CLEM was performed using a workflow as described by Urwyler et al., (2015). In brief, mice were intravenously injected with 20 μg of CD31-conjugated antibody to stain sinusoid blood vessels. After 5 min, mice were sacrificed and inferior vena cava were cannulated and livers were perfused (4 mL/min) with Antigenfix (Diapath) for 5 min at room temperature. After excision, 2-3 mm slices of livers were further fixed by immersion in Antigenfix for 1 h at 4°C, washed in PBS and sliced making use of Leica Vibratome VT1200S. Slices were first used for Near Infra-Red Branding to indicate a region of interest (ROI), making use of a Zeiss LSM780 with a MaiTai laser (Bishop et al., 2011). Next, high resolution confocal stacks were obtained with a Zeiss LSM880 FastAiry. The sample was then processed for volume EM by fixation with Karnovsky buffer and en bloc heavy metal staining as described by Steeland et al., (Steeland et al., 2018). The sample was mounted onto an aluminum pin and trimmed for imaging with a Zeiss Merlin with 3View2 (Gatan). Overlays of confocal and volume EM datasets was performed based on blood vessel staining, using the ec-CLEM plugin of ICY in order to identify Kupffer cells or monocytes (Paul-Gilloteaux et al., 2017). The EM datasets were segmented in MIB (Belevich et al., 2016) and 3D rendering was done in iMaris.
Intravital microscopy
Mice were anesthetized with a 50 μL intraperitoneal injection of a ketamine/xylazine cocktail (3.3 mg ketamine, 0.3 mg xylazine). The surgical area was then cleared by trimming the hairs. For imaging, mice were held in a custom-built stabilization device and further anesthetized with isoflurane. The liver was surgically exposed in the imaging chamber at 36°C and continuously superfused with 36°C PBS. Imaging was performed on a LSM710 confocal microscope (Carl Zeiss) equipped with MaiTai Deep-See multiphoton laser (Spectra-Physics) and excitation wavelength at 920 nm. Images were analyzed with ImarisTrack (Bitplane) to quantify cell speeds over time.
Microarray
2,5 × 10⁴ cells of each population shown in Figure 2D were sorted into 500 μl RLT buffer (QIAGEN). RNA was isolated using the RNeasy micro kit (QIAGEN) and sent to the Nucleomics facility, VIB Leuven, Belgium where the microarrays were performed using the GeneChip Mouse Gene 1.0 ST arrays (Affymetrix). Samples were subsequently analyzed using R/Bioconductor. All samples passed quality control, and the Robust Multi-array Average (RMA) procedure was used to normalize data within arrays (probeset summarization, background correction and log2-transformation) and between arrays (quantile normalization). Only probesets that mapped uniquely to one gene were kept, and for each gene, the probeset with the highest expression was kept. For the heatmaps, the relative expression values were calculated by calculating the mean expression per gene and subtracting this mean value from each log2 normalized value of that gene.
Bulk RNA Sequencing
2,5 × 10⁴ HSCs, LSECs or hepatocytes were FACS-purified into 500 μl of RLT plus buffer (QIAGEN) and β-mercaptoethanol. RNA was isolated using a RNeasy Plus micro kit (QIAGEN) and sent to the VIB Nucleomics facility, where the RNA sequencing was performed using a NextSeq sequencer (Illumina). The pre-processing of the RNA sequencing data was done by Trimmomatic. The adapters were cut and reads were trimmed when the quality dropped below 20. Reads with a length < 35 were discarded. All samples passed quality control based on the results of FastQC. Reads were mapped to the mouse reference genome via Tophat2 and counted via HTSeqCount. The bulk RNA-seq data was divided in 2 experiments: the HSC and LSEC versus hepatocytes. Experiments were normalized separately using the default limma (voom) procedure. For the HSC-LSEC data 1 replicate was removed: LSEC_36 h_4, due to strange clustering behavior. For the hepatocyte data specifically we did an extra batch correction using the sva R package (ComBat), where replicates 1 and 2 form the first batch and replicates 3 and 4 form the 2nd batch. For visualization (PCA and heatmaps), we merged the normalized values of both experiments. Principal component analysis plot was created using the 25% of genes with the most variable expression. Genes that were present in the HSC-LSEC-normalized expression table, but not in the hepatocyte normalized expression table were assigned the minimal log2 value for the hepatocytes samples. The same for the genes present in the hepatocyte-normalized expression table, but absent in the HSC-LSEC normalized expression table. The DE genes were calculated on the separate normalized expression tables and defined based a logFC cutoff > 1 or < −1 and adj.P value < 0.05. For the heatmaps we transformed the normalized expression table as ‘log2(2ˆexpTable + 1)’ and did an extra transformation by putting these values on a 0-1 scale. For the heatmap Figure S4A we combined all DE genes for each cell type (HSC, LSEC and hepatocyte) and kept the DE genes with a logFC > 1.5 or < −1.5. We first looked for the overlapping DE genes between the cell types and then took the top 50 DE genes unique for each cell type.
NicheNet analysis
NicheNet is a method that predicts which ligands produced by one cell regulate the expression of which target genes in another cell. Ligand-target links are inferred by combining bulk or single-cell expression data of interacting cells with existing knowledge on signaling and gene regulatory networks.
A first question NicheNet can address, is predicting which ligands produced by a sender cell are the most active in affecting gene expression in the receiver cell (i.e., ligand activity analysis). For this, NicheNet assesses how well these ligands predict the observed changes in gene expression and ranks them according to this. After ligand prioritization, NicheNet infers active ligand-target links by looking for genes that are affected in the receiver cell and have a high potential to be regulated by the prioritized ligands. An open source R implementation of NicheNet is available at GitHub (https://github.com/saeyslab/nichenetr).
NicheNet ligand activity prediction to prioritize ligands regulating activation of HSC and LSEC after KC depletion
To perform NicheNet ligand activity analysis, we need to define a list of potentially active ligands and sets of affected and non-affected background genes in the receiving cell. NicheNet will then rank ligands according to how well they predict whether a gene belongs to the gene set of interest compared to the background gene set. As potentially active ligands for regulating respectively HSC or LSEC activation, we considered all ligands in the NicheNet model for which at least one specific receptor was expressed in respectively HSC or LSEC (average log2 expression value > 4). Receptors of ligands were determined by querying the ligand-receptor data sources of NicheNet after excluding the data sources containing predicted ligand-receptor interactions. As target gene set, we considered the list of genes that are differentially expressed in respectively HSC or LSEC between steady-state and 12 h after KC depletion (adjusted p value ≤ 0.05 and |average log2 fold change| > = 1; expressed in at least 10% KCs single cells). As background, we considered all other genes that are not differentially expressed. Ligand activity scores were then calculated both for the HSC and LSEC setting as the pearson correlation coefficient between the ligand-target regulatory potential scores of each selected ligand and the target indicator vector, which indicates whether a gene belongs to the gene set of interest or not. To make the activity scores of the HSC and LSEC settings comparable, z-score normalization of the pearson correlation coefficients was performed.
Heatmap visualization of NicheNet analysis to prioritize ligands regulating activation of HSC and LSEC after KC depletion
In the heatmaps, the top 5 ligands for the HSC setting (out of 284 ligands) and top 5 ligands for the LSEC setting (out of 245 ligands) are shown. Ligands are ordered according to the average z-score over both settings. For those ligands, the corresponding receptors are indicated in the ligand-receptor heatmap. The indicated score accords to the weight of the interaction between the ligand and receptor in the integrated weighted ligand signaling network of NicheNet. In the ligand-target heatmap, we show regulatory potential scores for interactions between the top-ranked ligands and following target genes: genes that are differentially expressed in HSC or LSEC (and with average log2 expression value > 4) and belong to the 150 most strongly predicted targets of Tnf or Il1a or Il1b (out of 17330 possible genes). As cutoff on the ligand-target regulatory potential, we chose the minimal regulatory potential score among the interactions between Tnf, Il1a, Il1b and each of their respective 150 top targets.
NicheNet ligand activity prediction to prioritize niche ligands regulating monocyte to KC differentiation
To investigate the role of the different niche cell types in regulating monocyte to KC differentiation, we performed a NicheNet ligand activity analysis for every niche cell type separately, once for prioritizing ligands regulating genes that are differentially expressed during differentiation and once for ligands regulating a set of core KC TFs. We considered once HSC-specific, once LSEC-specific and once hepatocyte-specific ligands as potentially active ligands if at least one specific receptor was expressed in monocytes (average log2 expression value > 6). Cell-type specific ligands were determined as ligands that are stronger expressed in the cell type of interest compared with both other cell types (log2 fold change > 0.5 and adjusted p value ≤ 0.05 and average log2 expression value > 4). Receptors of ligands were determined by querying the ligand-receptor data sources of NicheNet after excluding the data sources containing predicted ligand-receptor interactions. As target gene sets, we considered once the list of genes that are differentially expressed between monocytes and mo-KCs 3 days after KC depletion (adjusted p value ≤ 0.05; |log2 fold change| > = 1; expressed in at least 10% of mature KC single cells) and once the list of the top 20 prioritized KC TFs. As background, we considered all other genes that are not differentially expressed. Ligand activity scores were then calculated both for the differentially expressed genes and KC TFs setting as the Pearson correlation coefficient between the ligand-target regulatory potential scores of each selected ligand and the target indicator vector, which indicates whether a gene belongs to the gene set of interest or not. To make the activity scores of both settings comparable over all ligands, z-score normalization of the Pearson correlation coefficients was performed after pooling the ligands for the different cell types together.
Heatmap visualization of NicheNet niche ligands regulating monocyte to KC differentiation
In the heatmaps, the 5 top-ranked HSC, LSEC and hepatocyte-specific ligands (out of respectively a total of 37, 55 and 20 ligands) were shown for the analyses on both differentially expressed genes and KC TFs. Ligands are ordered according to the average z-score over both settings. For those ligands, the corresponding receptors are indicated in the ligand-receptor heatmap. The indicated score accords to the weight of the interaction between the ligand and receptor in the integrated weighted ligand signaling network of NicheNet. In the ligand-target heatmap, we show regulatory potential scores for interactions between a subset of the top-ranked ligands and following target genes: KC TFs and genes that are differentially expressed between monocytes and mo-KCs 3 days after KC depletion and that also belong to the 100 most strongly predicted targets of Bmp5, Bmp4, Inhbc, Gdf2, Gdf6, Bmp2, Bmp6, Inhbb, Bmp10, Dll1, Dll4 or Csf1 (out of 17330 possible genes). As cutoff on the ligand-target regulatory potential scores for Csf1, we chose the minimal regulatory potential score among the interactions between Csf1 and its respective 100 top targets. For the ligands of the Bmp and Delta-like family, we chose the minimal regulatory potential score among the interactions between each of those ligands and their respective 100 top targets.
Circular visualization of prioritized ligand-target links
For circular visualization of the links between niche cell ligands and KC genes, the circlize R package was used (Gu et al., 2014). We show the 5 top-ranked HSC, LSEC and hepatocyte-specific ligands for the analyses on both differentially expressed genes and KC TFs. For those ligands, we also show the target genes divided in three groups: the group of genes that are predominantly targets of Csf1, Bmp-Delta-Notch or of one of the other top-ranked ligands. As target genes, we show the genes that belong to the set of KC TFs and genes that are differentially expressed between monocytes and mo-KCs 3 days after KC depletion and that also belong to the 100 most strongly predicted targets of the prioritized ligands. We show only target genes and ligands if they have at least one interaction with regulatory potential score > 0.00399. Links between ligands and targets are only drawn when the target belongs to the top 100 target genes of that ligand and the regulatory potential score > 0.0045. Width of sectors and links are determined as the sum of the regulatory potential scores. In addition to the target genes of the prioritized ligands, we also show their specific receptors expressed in monocytes. The width of the sectors for every receptor group was determined such that ratio between the three different groups was the same as for the targets. Within one receptor group, the width is proportional to the ligand-receptor interaction weights.
Gene expression analysis by real-time RT-PCR
RNA was purified from 2,5x10⁴ sorted cells using a RNeasy Plus micro kit (QIAGEN). RNA was reverse transcribed to cDNA with a Sensifast cDNA synthesis kit (Bioline). Gene expression was assayed by real-time RT-PCR using a SensiFast SYBR No-Rox kit (Bioline) on a PCR amplification and detection instrument (LightCycler 480; Roche) with the primers listed in the Key Resources Table. Gene expression was normalized to B2m, and the mean relative gene expression was calculated using the 2−ΔΔC(t) method.
Chemicals treatments
For KC depletion, mice were intraperitoneally (IP) injected with a single dose of 500 ng of DT (Sigma) or PBS for control mice. For TNF and IL-1 blocking experiments, 20 mg/kg of Anti-TNF-blocking antibody (Bio X Cell), 100 mg/kg of Anakinra or 20 mg/kg of isotype control (Bio X Cell) were given to mice intraperitoneal concomitant to DT injection. For EdU (Thermo Fisher) experiment, mice were IP injected with 1mg/mouse of EdU 4 h before sacrifice. For DDL1/4 blocking experiments, 1 mg of of DLL1 (BioXcell) and 1 mg of DLL4 (BioXCell) or 2 mg of polyclonal Armenian hamster IgG isotype (BioXCell) were injected 24 h before DT injection. For CSF1R blocking experiments, 100 mg/kg of PLX3397 was given by gavage 24 h and 48 h after DT injection.
Serum CCL2 measurement
Mice were injected with DT at the indicated time points. Blood was collected and kept at room temperature for 30 min to allow the blood to clot. The serum was then separated from the clot by centrifuging the tubes for 10 min at 2000 g. Resulting serums were then kept at −80°C.
Quantification and Statistical Analysis
To determine the monocytes size, maximum intensity Z-projections pictures were thresholded and individual monocytes were measured using ImageJ. To quantify the number of CCL2 or CSF1-expressing cells, Z stacks were analyzed slice by slice to determine which cells were containing the molecules. Results were normalized per mm2 of tissue. In all experiments, data are presented as means ± SD. Statistical tests were selected based on appropriate assumptions with respect to data distribution and variance characteristics. Student’s t test with Welch correction (two-tailed) was used for the statistical analysis of differences between two groups. One-way ANOVA with Bonferroni post-test was used for the statistical analysis of differences between more than two groups. Two-way ANOVA with Tukey post-test was used for the statistical analysis of differences between more than two groups and with 2 different independent variables. Statistical significance was defined as p < 0.05. Sample sizes were chosen according to standard guidelines. Number of animals is indicated as ‘‘n.’’ Of note, sizes of the tested animal groups were also dictated by availability of the transgenic strains and litter sizes, allowing littermate controls. Pre-established exclusion criteria are based on IACUC guidelines. The investigator was not blinded to the mouse group allocation. Tested samples were blindly assayed.
Data and Code Availability
All RNA-sequencing and micro-array data have been deposited in the Gene Expression Omnibus public database under accession number GEO: GSE135790.
Acknowledgments
We thank the VIB-IRC Flow Cytometry and the VIB-IRC Microscopy Core Facilities for assistance. We thank Kiavash Movahedi for the PLX3397 protocol and Mohamed Lamkanfi for the Anakinra. This study benefitted from data assembled by the Immgen Consortium. J.B. is supported by an Fonds voor Wetenschappelijk Onderzoek (FWO) postdoctoral fellowship (12I0617N). R.B. is supported by an FWO PhD fellowship (1181318N). W.T. is supported by a BOF Ghent University fellowship. The Guilliams lab is supported by the FWO, a GOA Ghent University grant and an ERC Consolidator Grant (KupfferCellNiche).
Author Contributions
Conceptualization: M.G. and J.B. Methodology: M.G., J.B., W.T., D.G., R.B., C.L.S., L.M., A.K., E.V.H., I.M., L.A.v.G., B.N.L., T.T., S.L., and Y.S. Formal Analysis: J.B., W.T., R.B., and L.M. Investigation: J.B., W.T., D.G., R.B., C.L.S., L.M., B.V., S.D.P., A.K., E.V.H., P.B., W.T., P.D.B., and S.L. Resources: M.G., S.A.N., A.B., T.T., and Y.S. Writing: J.B. and M.G. Visualization: J.B. and M.G. Supervision: M.G., S.L., D.E., and Y.S. Funding Acquisition: M.G.
Declaration of Interests
The authors declare no competing interests.
Published: September 24, 2019
Footnotes
Supplemental Information can be found online at https://doi.org/10.1016/j.immuni.2019.08.017.
Contributor Information
Johnny Bonnardel, Email: johnny.bonnardel@irc.vib-ugent.be.
Martin Guilliams, Email: martin.guilliams@irc.vib-ugent.be.
Supplemental Information
References
- Andrae J., Gallini R., Betsholtz C. Role of platelet-derived growth factors in physiology and medicine. Genes Dev. 2008;22:1276–1312. doi: 10.1101/gad.1653708. [DOI] [PMC free article] [PubMed] [Google Scholar]
- Begemann I., Galic M. Correlative light electron microscopy: connecting synaptic structure and function. Front. Synaptic Neurosci. 2016;8:28. doi: 10.3389/fnsyn.2016.00028. [DOI] [PMC free article] [PubMed] [Google Scholar]
- Belevich I., Joensuu M., Kumar D., Vihinen H., Jokitalo E. Microscopy image browser: a platform for segmentation and analysis of multidimensional datasets. PLoS Biol. 2016;14:e1002340. doi: 10.1371/journal.pbio.1002340. [DOI] [PMC free article] [PubMed] [Google Scholar]
- Bishop D., Nikić I., Brinkoetter M., Knecht S., Potz S., Kerschensteiner M., Misgeld T. Near-infrared branding efficiently correlates light and electron microscopy. Nat. Methods. 2011;8:568–570. doi: 10.1038/nmeth.1622. [DOI] [PubMed] [Google Scholar]
- Browaeys R.S., Saelens W., Saeys Y. 2019. NicheNet: modeling intercellular communication by linking ligands to target genes. [DOI] [PubMed] [Google Scholar]
- Cavalli G., Dinarello C.A. Anakinra therapy for non-cancer inflammatory diseases. Front. Pharmacol. 2018;9:1157. doi: 10.3389/fphar.2018.01157. [DOI] [PMC free article] [PubMed] [Google Scholar]
- Friedman S.L. Hepatic stellate cells: protean, multifunctional, and enigmatic cells of the liver. Physiol. Rev. 2008;88:125–172. doi: 10.1152/physrev.00013.2007. [DOI] [PMC free article] [PubMed] [Google Scholar]
- Gautier E.L., Shay T., Miller J., Greter M., Jakubzick C., Ivanov S., Helft J., Chow A., Elpek K.G., Gordonov S., Immunological Genome Consortium Gene-expression profiles and transcriptional regulatory pathways that underlie the identity and diversity of mouse tissue macrophages. Nat. Immunol. 2012;13:1118–1128. doi: 10.1038/ni.2419. [DOI] [PMC free article] [PubMed] [Google Scholar]
- Gerhardt T., Ley K. Monocyte trafficking across the vessel wall. Cardiovasc. Res. 2015;107:321–330. doi: 10.1093/cvr/cvv147. [DOI] [PMC free article] [PubMed] [Google Scholar]
- Grivennikov S.I., Tumanov A.V., Liepinsh D.J., Kruglov A.A., Marakusha B.I., Shakhov A.N., Murakami T., Drutskaya L.N., Förster I., Clausen B.E. Distinct and nonredundant in vivo functions of TNF produced by t cells and macrophages/neutrophils: protective and deleterious effects. Immunity. 2005;22:93–104. doi: 10.1016/j.immuni.2004.11.016. [DOI] [PubMed] [Google Scholar]
- Gu Z., Gu L., Eils R., Schlesner M., Brors B. circlize Implements and enhances circular visualization in R. Bioinformatics. 2014;30:2811–2812. doi: 10.1093/bioinformatics/btu393. [DOI] [PubMed] [Google Scholar]
- Guilliams M., Scott C.L. Does niche competition determine the origin of tissue-resident macrophages? Nat. Rev. Immunol. 2017;17:451–460. doi: 10.1038/nri.2017.42. [DOI] [PubMed] [Google Scholar]
- Halpern K.B., Shenhav R., Massalha H., Toth B., Egozi A., Massasa E.E., Medgalia C., David E., Giladi A., Moor A.E. Paired-cell sequencing enables spatial gene expression mapping of liver endothelial cells. Nat. Biotechnol. 2018;36:962–970. doi: 10.1038/nbt.4231. [DOI] [PMC free article] [PubMed] [Google Scholar]
- Heldin C.H., Westermark B. Mechanism of action and in vivo role of platelet-derived growth factor. Physiol. Rev. 1999;79:1283–1316. doi: 10.1152/physrev.1999.79.4.1283. [DOI] [PubMed] [Google Scholar]
- Heng T.S., Painter M.W., Immunological Genome Project Consortium The Immunological Genome Project: networks of gene expression in immune cells. Nat. Immunol. 2008;9:1091–1094. doi: 10.1038/ni1008-1091. [DOI] [PubMed] [Google Scholar]
- Hoeffel G., Chen J., Lavin Y., Low D., Almeida F.F., See P., Beaudin A.E., Lum J., Low I., Forsberg E.C. C-Myb(+) erythro-myeloid progenitor-derived fetal monocytes give rise to adult tissue-resident macrophages. Immunity. 2015;42:665–678. doi: 10.1016/j.immuni.2015.03.011. [DOI] [PMC free article] [PubMed] [Google Scholar]
- Hulsmans M., Clauss S., Xiao L., Aguirre A.D., King K.R., Hanley A., Hucker W.J., Wulfers E.M., Seemann G., Courties G. Macrophages facilitate electrical conduction in the heart. Cell. 2017;169:510–522 e520. doi: 10.1016/j.cell.2017.03.050. [DOI] [PMC free article] [PubMed] [Google Scholar]
- Lavin Y., Winter D., Blecher-Gonen R., David E., Keren-Shaul H., Merad M., Jung S., Amit I. Tissue-resident macrophage enhancer landscapes are shaped by the local microenvironment. Cell. 2014;159:1312–1326. doi: 10.1016/j.cell.2014.11.018. [DOI] [PMC free article] [PubMed] [Google Scholar]
- Madisen L., Zwingman T.A., Sunkin S.M., Oh S.W., Zariwala H.A., Gu H., Ng L.L., Palmiter R.D., Hawrylycz M.J., Jones A.R. A robust and high-throughput Cre reporting and characterization system for the whole mouse brain. Nat. Neurosci. 2010;13:133–140. doi: 10.1038/nn.2467. [DOI] [PMC free article] [PubMed] [Google Scholar]
- Mass E., Ballesteros I., Farlik M., Halbritter F., Günther P., Crozet L., Jacome-Galarza C.E., Händler K., Klughammer J., Kobayashi Y. Specification of tissue-resident macrophages during organogenesis. Science. 2016;353:aaf4238. doi: 10.1126/science.aaf4238. [DOI] [PMC free article] [PubMed] [Google Scholar]
- Mederacke I., Dapito D.H., Affò S., Uchinami H., Schwabe R.F. High-yield and high-purity isolation of hepatic stellate cells from normal and fibrotic mouse livers. Nat. Protoc. 2015;10:305–315. doi: 10.1038/nprot.2015.017. [DOI] [PMC free article] [PubMed] [Google Scholar]
- Metchnikoff E. Volume G. Masson; 1892. Leçons sur la pathologie comparée de l’inflammation: faites à l’Institut Pasteur en avril et mai 1891. [Google Scholar]
- Okabe Y., Medzhitov R. Tissue biology perspective on macrophages. Nat. Immunol. 2016;17:9–17. doi: 10.1038/ni.3320. [DOI] [PubMed] [Google Scholar]
- Paolicelli R.C., Bolasco G., Pagani F., Maggi L., Scianni M., Panzanelli P., Giustetto M., Ferreira T.A., Guiducci E., Dumas L. Synaptic pruning by microglia is necessary for normal brain development. Science. 2011;333:1456–1458. doi: 10.1126/science.1202529. [DOI] [PubMed] [Google Scholar]
- Paul-Gilloteaux P., Heiligenstein X., Belle M., Domart M.C., Larijani B., Collinson L., Raposo G., Salamero J. eC-CLEM: flexible multidimensional registration software for correlative microscopies. Nat. Methods. 2017;14:102–103. doi: 10.1038/nmeth.4170. [DOI] [PubMed] [Google Scholar]
- Satpathy A.T., Briseño C.G., Lee J.S., Ng D., Manieri N.A., Kc W., Wu X., Thomas S.R., Lee W.L., Turkoz M. Notch2-dependent classical dendritic cells orchestrate intestinal immunity to attaching-and-effacing bacterial pathogens. Nat. Immunol. 2013;14:937–948. doi: 10.1038/ni.2679. [DOI] [PMC free article] [PubMed] [Google Scholar]
- Schulz C., Gomez Perdiguero E., Chorro L., Szabo-Rogers H., Cagnard N., Kierdorf K., Prinz M., Wu B., Jacobsen S.E., Pollard J.W. A lineage of myeloid cells independent of Myb and hematopoietic stem cells. Science. 2012;336:86–90. doi: 10.1126/science.1219179. [DOI] [PubMed] [Google Scholar]
- Scott C.L., T’Jonck W., Martens L., Todorov H., Sichien D., Soen B., Bonnardel J., De Prijck S., Vandamme N., Cannoodt R. The transcription factor ZEB2 is required to maintain the tissue-specific identities of macrophages. Immunity. 2018;49:312–325. doi: 10.1016/j.immuni.2018.07.004. [DOI] [PMC free article] [PubMed] [Google Scholar]
- Scott C.L., Zheng F., De Baetselier P., Martens L., Saeys Y., De Prijck S., Lippens S., Abels C., Schoonooghe S., Raes G. Bone marrow-derived monocytes give rise to self-renewing and fully differentiated Kupffer cells. Nat. Commun. 2016;7:10321. doi: 10.1038/ncomms10321. [DOI] [PMC free article] [PubMed] [Google Scholar]
- Serbina N.V., Pamer E.G. Monocyte emigration from bone marrow during bacterial infection requires signals mediated by chemokine receptor CCR2. Nat. Immunol. 2006;7:311–317. doi: 10.1038/ni1309. [DOI] [PubMed] [Google Scholar]
- Steeland S., Gorlé N., Vandendriessche C., Balusu S., Brkic M., Van Cauwenberghe C., Van Imschoot G., Van Wonterghem E., De Rycke R., Kremer A. Counteracting the effects of TNF receptor-1 has therapeutic potential in Alzheimer’s disease. EMBO Mol. Med. 2018;10:e8300. doi: 10.15252/emmm.201708300. [DOI] [PMC free article] [PubMed] [Google Scholar]
- T’Jonck W., Guilliams M., Bonnardel J. Niche signals and transcription factors involved in tissue-resident macrophage development. Cell. Immunol. 2018;330:43–53. doi: 10.1016/j.cellimm.2018.02.005. [DOI] [PMC free article] [PubMed] [Google Scholar]
- Theurl I., Hilgendorf I., Nairz M., Tymoszuk P., Haschka D., Asshoff M., He S., Gerhardt L.M., Holderried T.A., Seifert M. On-demand erythrocyte disposal and iron recycling requires transient macrophages in the liver. Nat. Med. 2016;22:945–951. doi: 10.1038/nm.4146. [DOI] [PMC free article] [PubMed] [Google Scholar]
- Trapnell B.C., Whitsett J.A., Nakata K. Pulmonary alveolar proteinosis. N. Engl. J. Med. 2003;349:2527–2539. doi: 10.1056/NEJMra023226. [DOI] [PubMed] [Google Scholar]
- Urwyler O., Izadifar A., Dascenco D., Petrovic M., He H., Ayaz D., Kremer A., Lippens S., Baatsen P., Guérin C.J., Schmucker D. Investigating CNS synaptogenesis at single-synapse resolution by combining reverse genetics with correlative light and electron microscopy. Development. 2015;142:394–405. doi: 10.1242/dev.115071. [DOI] [PubMed] [Google Scholar]
- van de Laar L., Saelens W., De Prijck S., Martens L., Scott C.L., Van Isterdael G., Hoffmann E., Beyaert R., Saeys Y., Lambrecht B.N., Guilliams M. Yolk sac macrophages, fetal liver, and adult monocytes can colonize an empty niche and develop into functional tissue-resident macrophages. Immunity. 2016;44:755–768. doi: 10.1016/j.immuni.2016.02.017. [DOI] [PubMed] [Google Scholar]
- Van de Walle I., De Smet G., Gärtner M., De Smedt M., Waegemans E., Vandekerckhove B., Leclercq G., Plum J., Aster J.C., Bernstein I.D. Jagged2 acts as a Delta-like Notch ligand during early hematopoietic cell fate decisions. Blood. 2011;117:4449–4459. doi: 10.1182/blood-2010-06-290049. [DOI] [PMC free article] [PubMed] [Google Scholar]
- Von Kupffer C. Ueber Sternzellen der Leber. Archiv für Mikroskopische Anatomie. 1876;12:353–358. [Google Scholar]
- Wake K. Karl Wilhelm Kupffer and his contributions to modern hepatology. Comp. Hepatol. 2004;3(Suppl 1):S2. doi: 10.1186/1476-5926-2-S1-S2. [DOI] [PMC free article] [PubMed] [Google Scholar]
- Wang Y., Colonna M. Interkeukin-34, a cytokine crucial for the differentiation and maintenance of tissue resident macrophages and Langerhans cells. Eur. J. Immunol. 2014;44:1575–1581. doi: 10.1002/eji.201344365. [DOI] [PMC free article] [PubMed] [Google Scholar]
- Yan D., Kowal J., Akkari L., Schuhmacher A.J., Huse J.T., West B.L., Joyce J.A. Inhibition of colony stimulating factor-1 receptor abrogates microenvironment-mediated therapeutic resistance in gliomas. Oncogene. 2017;36:6049–6058. doi: 10.1038/onc.2017.261. [DOI] [PMC free article] [PubMed] [Google Scholar]
- Yona S., Kim K.W., Wolf Y., Mildner A., Varol D., Breker M., Strauss-Ayali D., Viukov S., Guilliams M., Misharin A. Fate mapping reveals origins and dynamics of monocytes and tissue macrophages under homeostasis. Immunity. 2013;38:79–91. doi: 10.1016/j.immuni.2012.12.001. [DOI] [PMC free article] [PubMed] [Google Scholar]
- Zhou X., Franklin R.A., Adler M., Jacox J.B., Bailis W., Shyer J.A., Flavell R.A., Mayo A., Alon U., Medzhitov R. Circuit design features of a stable two-cell system. Cell. 2018;172:744–757. doi: 10.1016/j.cell.2018.01.015. [DOI] [PMC free article] [PubMed] [Google Scholar]
Associated Data
This section collects any data citations, data availability statements, or supplementary materials included in this article.
Supplementary Materials
3D reconstruction of Clec4fDTR/+ mouse liver sections stained for Clec4F (blue), F4/80 (cyan), Sirpα (green), and MHCII (red) in PBS control mice or 16 h after DT injection. The video showed that capsule liver macrophages (SirpαhiMHCII+F4/80lowClec4F−) were not depleted after DT injection, contrary to KCs (SirpαlowMHCIIlowF4/80hiClec4Fhi). Data are representative of 2 experiments. Scale bar, 50 μm.
Intravital two-photon imaging of a Clec4fDTR/CRE-Ccr2GFP/+-Rosa26TdT/+ mice with KCsTdT/+ (red) and monocytesGFP/+ (green). Mice were injected with PBS. Data are representative of 2 experiments.
Intravital two-photon imaging of a Clec4fDTR/CRE-Ccr2GFP/+-Rosa26TdT/+ mice with KCsTdT/+ (red) and monocytesGFP/+ (green). Mice were injected with DT and imaged 10 h to 16 h after DT. Data are representative of 3 experiments.
Intravital two-photon imaging of a Clec4fDTR/CRE-Ccr2GFP/+-Rosa26TdT/+ mice with KCsTdT/+ (red) and monocytesGFP/+ (green). Mice were injected with DT and imaged 24 h to 28 h after DT. Data are representative of 2 experiments.
CLEM 3D reconstruction showing a monocyte (red) interacting with an HSC (green) and hepatocytes (yellow) across the LSEC barrier (blue).
CLEM 3D reconstruction showing a KC (red) interacting with an HSC (green) and multiple LSECs (blue).
Data Availability Statement
All RNA-sequencing and micro-array data have been deposited in the Gene Expression Omnibus public database under accession number GEO: GSE135790.