Abstract
Medication dosing in a critical care environment is a complex task that involves close monitoring of relevant physiologic and laboratory biomarkers and corresponding sequential adjustment of the prescribed dose. Misdosing of medications with narrow therapeutic windows (such as intravenous [IV] heparin) can result in preventable adverse events, decrease quality of care and increase cost. Therefore, a robust recommendation system can help clinicians by providing individualized dosing suggestions or corrections to existing protocols. We present a clinician-in-the-loop framework for adjusting IV heparin dose using deep reinforcement learning (RL). Our main objectives were to learn a new IV heparin dosing policy based on the multi-dimensional features of patients, and evaluate the effectiveness of the learned policy in the presence of other confounding factors that may contribute to heparin-related side effects. The data used in the experiments included 2598 intensive care patients from the publicly available MIMIC database and 2310 patients from the Emory University clinical data warehouse. Experimental results suggested that the distance from RL policy had a statistically significant association with anticoagulant complications (p < 0.05), after adjusting for the effects of confounding factors.
I. Introduction
Heparin is an effective intravenous (IV) anticoagulant used to prevent the formation of blood clots in susceptible patients. However, due to IV heparin’s narrow therapeutic window, its administration requires frequent monitoring and dose adjustment to prevent adverse events associated with supraor sub- therapeutic anticoagulation. Latent endogeneous and exogeneous factors are continuously affecting patient’s ability to maintain normal blood coagulation. Yet, dosing and sequential adjustment of IV heparin is often performed by following clinical protocols based on a limited number of clinical measurements, collected at the initiation of care (e.g. weight, history of complications and intermittent monitoring of coagulation factors). In practice, deviations from such protocols are common due the complex and dynamic nature of patient’s physiology [1]. While the rationale for deviations from established protocols are often not directly reported in electronic medical records (EMRs), EMRs may provide indirect evidence of the work-flow related factors, drug-interactions, and other complex scenarios that informed the decision to deviate from clinical guidelines.
In recent years, there has been a growing number of clinical studies both through prospective trials as well as retrospective analysis of electronic medical records [2], [3], [4] aimed at refining the heparin dosing protocols. The prospect of learning optimal dosing protocols from retrospective clinical data is particularly intriguing in a time when 90% of health providers now store detailed electronics medical records [5], allowing algorithmic approaches to leverage heterogeneity in both dosing behavior, and patient characteristics, when identifying ‘optimal’ policies. Indeed, retrospective analyses are a necessary precursor to motivate prospective trials, which produce smaller data archives, at higher cost, and must necessarily exclude patients at ‘high-risk’ for adverse outcomes (e.g. the elderly). Important previous work has found associations between observational trial results and RCTs [6].
Retrospective analysis starts by extracting sequential dose-response data, laboratory and other clinical data, as well as outcome variables corresponding to adverse events. However, dose-response data is often sparse, since blood draws are required to measure the relevant biomarkers (such as ‘Heparin Level’, ‘activated Partial Thromboplastin Time’ or aPTT, and ‘Activated Clotting Time’ or ACT). This feedback delay is akin to the problem of delayed rewards and credit assignment in the Reinforcement Learning (RL) literature, wherein the rewards associated with a state-action pair can occur terribly delayed [7]. As a consequence, such reward signals will only very weakly affect all temporally distant states that have preceded it, resulting in a difficulty to assign the appropriate credit to a given state-action pair.
In this work, we utilize the framework of reinforcement learning in continuous state-action spaces to learn a better policy for heparin dosing from observational data. Furthermore, we aim to statistically assess if the learned policy is in fact better than the existing hospital protocols. When evaluating a new policy, we perform multivariate regression analysis to test the hypothesis that adherence to the learned RL policy is significantly associated with improved outcomes after adjusting for confounding factors.
II. Method
A. Data
Data for this multicenter-study was collected from two sources: The first dataset was collected from the publicly available Medical Information Mart For Intensive Care (MIMIC) dataset [8], the second dataset was collected from the Emory Hospital intensive care unit data. Of note, inclusion of two separate datasets was meant to show the generalizability of the proposed framework, but not necessarily a set of model coefficients. We identified 2598 patients in MIMIC database who received IV heparin infusion during their ICU stay, and who had activated partial thromboplastin time measures (aPTT), which is used in MIMIC to monitor the response of patients. We extracted high resolution data including laboratory results, and time-lagged aPTT and heparin dose measurements over the three hours period prior to the selected time (t-1h : t-3h). Additionally, we collected the following covariates: gender, age, weight, ICU unit, ethnicity, history of pulmonary embolism and the overall Sequential Organ Failure Assessment (SOFA) score. The dosing protocol at the Beth Isreal Medical Deaconess Medical Center (where MIMIC was collected) defines a threapeutic aPPT as between 60 and 100.
The second dataset included 2310 ICU patients from Emory Healthcare (Atlanta, GA). All patients were admitted between Jan. 2013 and Dec. 2015 and received IV heparin during their admission. Collected data included demographic information (gender, ethnicity, etc.), laboratory testing result and the heparin level, which is used in Emory hospital as a biomarker of dose response. Additionally, we obtained the healthcare system’s weight-based IV heparin infusion protocol to help determine the level of adherence to the official dosing protocol. The dosing protocol at Emory was divided into low-standard and high-standard according to a patient’s indication for IV heparin.
For both datasets, we determined the patient’s history of medical condition using daily International Classification of Diseases-9 (ICD-9) codes (assigned by the clinical team) [9]. From the daily diagnostic codes assigned by the bedside clinical team, we extracted the timestamps of complications related to bleeding instance, blood clots including pulmonary embolism (PE) and deep vein thrombosis (DVT). These complications were used as a prediction target for the analysis. Sample-and-hold was used to handle missing data when applicable. In all other cases, mean imputation was used by calculating the mean value of each feature across the training data, and utilizing the same values on the testing data.
B. Reinforcement learning
1). Policy Architecture:
The methods in this study are based on the deep deterministic policy gradient approach (DDPG) described by Lillicrap et al. [10]. DDPG is a technique designed for RL in the continuous action domain. The algorithm combines Deterministic Policy Gradient (DPG) [11] and Deep Q-Networks (DQN) [12]. Let (st, at) denote the state and action pair at the time-step t, and πθ (st, at) = P (at|st, θ) represent the policy which provides a parametric conditional probability distribution over the space of possible actions given a state st, and model parameters θ. In our setting, the state may represent the set of measurements that characterizes a patient at a given time, or a lower dimensional representation of such measurements. The action is the continuous dosage of the drug, and the policy is a deterministic function, at = μθ(st), that corresponds to the behavior of the RL dosing protocol. For our purposes, the form of μθ is a neural network that maps from the state of the patient to the appropriate dose of heparin. Finally, the objective of learning is to find a policy that maximizes the discounted long-term accumulated reward (across) associated with a state-action pair, denoted by . Therefore the goal of learning is to maximize the objective function:
The gradient of the above objective function can be calculated by the policy gradient theorem [13]:
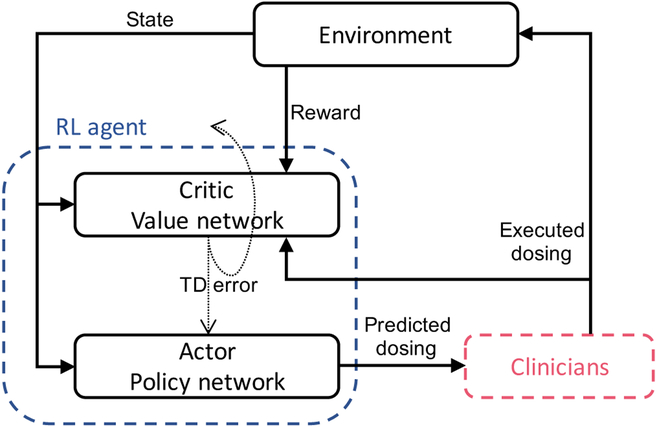
where πθ (s, a) is known as the actor network and is known as the critic network (see Figure 1). The actor follows a deterministic policy to suggest an action. The critic estimates the long-term value of this act ion:
and utilizes a TD (Temporal-Difference) error signal (the difference between the left and right-hand sides of the above equation) to drive the learning in both the actor and the critic. The deterministic policy gradient theorem provides the update rule for the weights of the actor network, while the critic network is updated from the gradients obtained from the TD error signal. In the online setting, the RL agent executes a series of actions following an exploration-exploitation policy and observes the resulting rewards and state transitions. Each mini-batch of size N includes examples of the form . Learning occurs through mini-batch gradient decedent by following the policy gradient. For a more detailed explanation of the DDPG algorithm and description of the learning procedure see Lillicrap et al. [10].
Fig. 1.
Clinician-in-the-loop framework. The Actor network suggests a dose, which is presented to a clinician who in-turn either accepts the recommendation or executes a different dose. The Critic network receives the corresponding reward from the environment and produces a TD error for updating the network.
2). Reward Function:
For each dataset, We defined a function that translates the measured outcomes into a continuous reward ∈[−1, 1].
- MIMIC: Rewards were assigned according to the following a scaling function:
which assigns a value close to 1 to aPTT values that fall within the therapeutic range of 60–100, and negative values elsewhere. -
Emory: We generated a reward function for each dosing standard (low and high). For patients on the low-standard protocol, reward was defined as:For patients on the high-standard protocol, reward was defined as:
C. Assessing Policy Value
Following Hirano and Imbens [14], the adjusted treatment effect can be measured by estimating the treatment-outcome curve with a regression models. More specifically, the conditional expectation of the outcome under different IV heparin dosing can be estimated using the observed outcomes, which corresponds to the potential outcome under the level of treatment received:
where Y is the outcome, X is the vector of patient’s covariates and T is the continuous heparin treatment level. We used regression estimators to model the outcome as a function of the treatment level and covariates. With parametric models for the outcome, we can further analyze the expected value of the outcome under different levels of treatment.
In order to evaluate the adjusted treatment effect, we need to model the treatment-outcome curve using a regression model. Let us first define the notion of distance from RL policy as the difference between the recommended dose of IV heparin (by the RL agent) and actual dose of IV heparin given to the patient over an entire dosing trajectory: Distance = Et[recommended dose(t) − administered dose(t)]. We define five distance levels (indexed as −2, −1, 0, 1, 2) by binning the continuous distance into five quantiles, which we interchangeably call the treatment level. For instance, a treatment level of zero corresponds to receiving the exact dose as recommended by the RL agent, while a treatment level of −2 means that the administered dose was higher than the RL agent’s recommendation.
D. Clinician-in-the-loop framework
While traditionally RL has been successful in online learning scenarios (with either real-world or simulated environments), clinical applications of RL have been limited to learning from offline data. If an accurate pharmacological drug dose-response model is available, an RL agent can learn an optimal policy through exploration-exploitation and execution of various dosages. However, when it comes to real world clinical scenarios, random exploration over the action space during the training phase is not realistic. Therefore, instead of generating new episodes by interacting with environment, a potential approach to learning is to utilize real episodes from retrospective clinical data. Again, the retrospective data is organized into tuples of the form , where the actions correspond to the actual dose of medication given to the patient. One interpretation of this setting is that the RL agent only recommends an action, and it’s up to the clinician to either take the recommendation or execute an alternative action. We call this a clinician-in-the-loop framework, as depicted in Figure 1. In this scheme, regardless of the action of the clinician, the agent learns by analyzing the trajectory of states, actions, and associated rewards. As long as there is sufficient variability in the actions performed the agent will be able to learn from historical data to arrive at a better policy. However, the true value of a new policy can only be determined with respect to meaningful clinical outcomes, and after adjusting for confounding factors. We utilize the framework of adjusted treatment effects (also known as causal treatment effects) to assess the value of a new policy, where a new policy plays the role of a treatment that only a subset of the population may receive.
E. Results
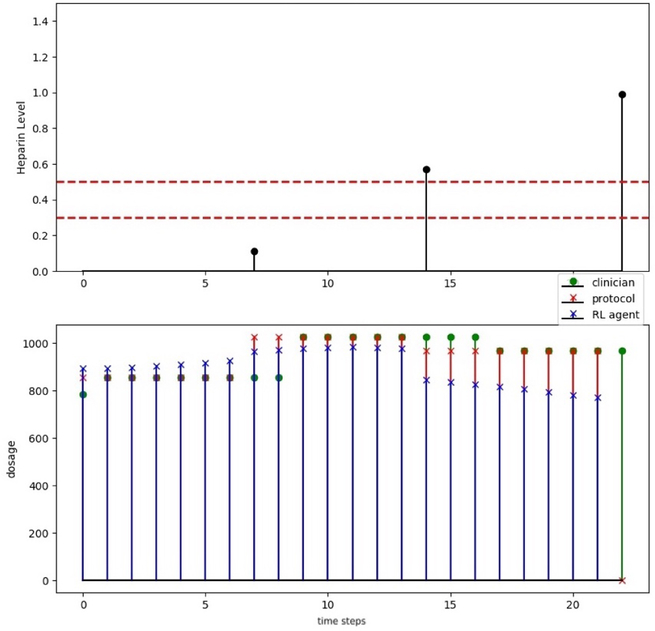
In Figures 2, we provide an example of the heparin dosing decisions by the clinical team, compared to the official weight-based protocols, and the suggestions of the RL agent.
Fig. 2.
Emory dosing: heparin level and therapeutic range; clinicians dosing (green stem with circle), protocol dosing (red stem with cross) and recommendation dosing (blue stem with cross).
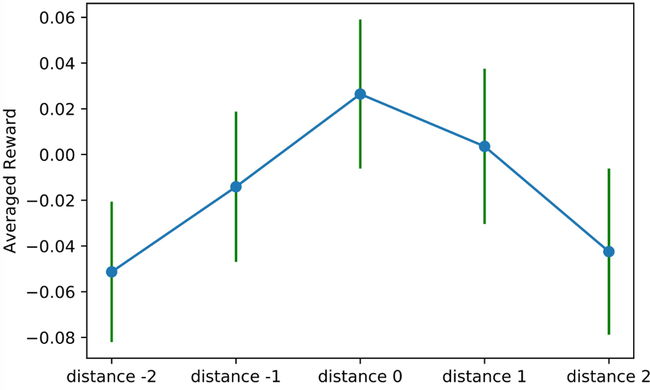
In Figure 3, we depict the reward associated with the five distance levels defined above(−2, −1, 0, 1 2) on the Emory datasets. We observe here that the average reward of distance level zero (corresponding to exactly following the RL agent’s recommendation) provides the greatest reward. Furthermore, as the distance between the recommended dose and the actual dose increases, there is a decline in the average accumulated reward. These observations suggest that our RL agent is providing reasonable and useful recommendations for the patients within the Emory dataset. These findings were consistent across the MIMIC dataset.
Fig. 3.
Association between distance from policy and average accumulated reward (Emory data): mean and standard deviation
While these results are encouraging, one may argue that patients in distance 0 class are simply healthier than other patients. In order to adjust for confounding factors when assessing the relationship between treatment levels and outcomes, we performed a multiple linear regression analysis, with the continuous variable ‘average reward’ as the outcome of interest, to determine whether the treatment level (or distance from policy) is as significant (p-value < 0.05). The regression results using the MIMIC and Emory data are shown in Table I and II.
TABLE I.
Regression on reward (MIMIC). SOFA: Sequential Organ Failure Assessment. PE: Pulmonary Embolism
| Feature | β | p-value | [95% Interval] |
|---|---|---|---|
| Constant | −0.3503 | 0.000 | [−0.37, −0.32] |
| | Distance From Policy | | −0.1235 | 0.000 | [−0.15, −0.10] |
| Gender | −0.0108 | 0.376 | [−0.03,0.01] |
| Age | 0.001 | 0.887 | [−0.02,0.03] |
| Weight | −0.0166 | 0.193 | [−0.04,0.0] |
| PE | 0.0093 | 0.438 | [−0.01,0.03] |
| SOFA | −0.0090 | 0.454 | [−0.02, −0.00] |
TABLE II.
Regression on reward (Emory data)
| Feature | β | p-value | [95% Interval] |
|---|---|---|---|
| Constant | 0.0032 | 0.397 | [ −0.004 , 0.011 ] |
| | Distance From Policy | | −0.0198 | 0.001 | [ −0.030 , −0.008 ] |
| History Of Clot | 0.0074 | 0.224 | [ −0.005 , 0.019 ] |
| History Of Bleed | 0.0048 | 0.431 | [ −0.007 , 0.017 ] |
| Weight | 0.0004 | 0.952 | [ −0.011 , 0.012 ] |
| Age | 0.0059 | 0.306 | [ −0.005 , 0.017 ] |
| SOFA | −0.0029 | 0.605 | [ −0.014 , 0.008 ] |
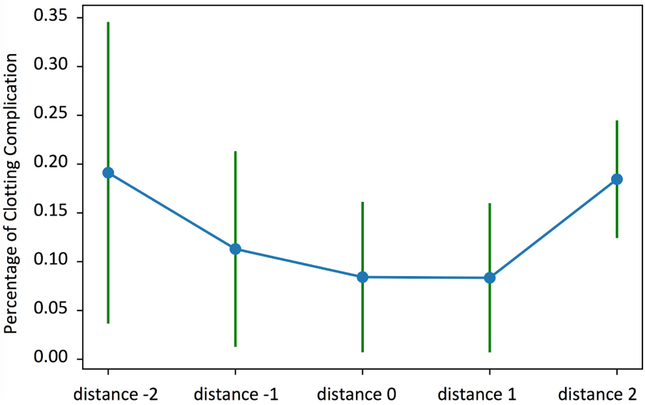
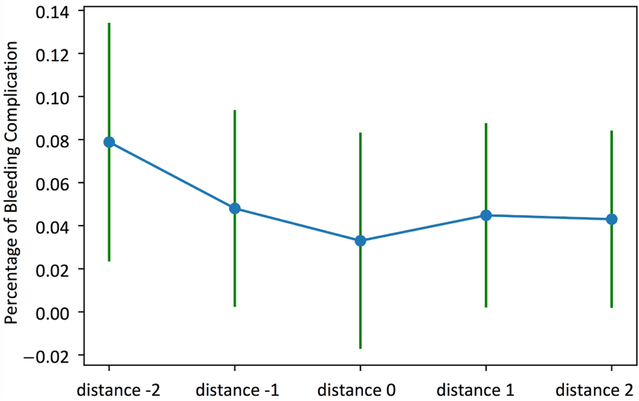
The other evaluation was focused on the under anticoagulation (i.e., thrombus/embolus) and over anticoagulation (i.e., bleeding) complications in Emory ICU data. In Figures 4 and 5 and Tables IV and III, we illustrate the results of a logistic regression model used to predict the presence or absence of complications (thrombus/embolus and bleeding) given distance from policy, after adjusting for confounding factors using the Emory dataset.
Fig. 4.
Association between distance from policy and percentage of clotting complication (Emory data): mean and standard deviation
Fig. 5.
Association between distance from policy and percentage of bleeding complication (Emory data): mean and standard deviation
TABLE IV.
Regression on bleeding complication (Emory data)
| Feature | β | p-value | [95% Interval] |
|---|---|---|---|
| Constant | −3.0050 | 0.000 | [ −3.200 , −2.810 ] |
| Distance From Policy | −0.0282 | 0.000 | [ −0.036 , −0.021 ] |
| History Of Bleed | −0.1086 | 0.303 | [ −0.315 , 0.098 ] |
| Weight | −0.0112 | 0.912 | [ −0.210 , 0.187 ] |
| Age | 0.0027 | 0.978 | [ −0.190 , 0.196 ] |
| SOFA | 0.2492 | 0.001 | [ 0.104 , 0.395 ] |
TABLE III.
Regression on clotting complications (Emory data)
| Feature | β | p-value | [95% Interval] |
|---|---|---|---|
| Constant | −2.3724 | 0.000 | [−2.522, −2.223] |
| Distance From Policy | 0.0146 | 0.001 | [0.007,0.022] |
| History Of Clot | 0.1156 | 0.073 | [−0.011,0.242] |
| Weight | 0.0740 | 0.282 | [−0.061,0.209] |
| Age | −0.1416 | 0.053 | [−0.285,0.002] |
| SOFA | −0.1059 | 0.202 | [−0.269,0.057] |
For the under anticoagulation complications, the distance from policy is the only significant variable with a p-value smaller than 0.05, and a positive regression coefficient indicating an increase in risk of under anticoagulation complications with the increasing distance from the RL policy (i.e., receiving less heparin than recommended by the RL agent). For the over anticoagulation complications, a decrease in distance from policy (i.e., receiving more heparin than recommended by the RL agent) is associated with an increase in bleeding probability. The second variable with significant p-value is the coagulation SOFA scores which is directly related to platelets count, and is positively associated with over anticoagulation complications (as expected).
III. Discussion and Conclusion
The major finding of this study is that the DDPG method can learn an improved policy for IV heparin dosing using retrospective data. We utilized the adjusted treatment effect framework to show that the learned policy is significantly associated with improved outcomes even after adjusting for confounding factors. The multiple linear regression and logistics regression analysis revealed that the distance between recommended dosing and clinicians’ dosing is significantly associated with total accumulated reward and coagulation-related complications. These findings indicate that following the RL agent’s recommendations, on average, would have likely resulted in improved clinical outcomes.
The DDPG method, which operates in continuous state and action spaces, does not require arbitrary discretization of actions, which was used in prior studies that utilized Q-learning [2]. However in practice, the continuous nature of the actions often results in smooth changes in the RL agent’s recommendations. While this may be an advantage if the RL agent successfully learns to never over-dose the patients, in the cases when such events do happen, the clinical protocols dictate an immediate stop of IV heparin infusion. In our setting, the RL agent was not able to suggest such rapid transitions, which may be a consequence of the way negative and positive rewards were defined in this study. For instance, designing asymmetric rewards based on patients underlying risk factors may be a potential approach to mitigate this issue. For instance, one may increase the penalty (negative reward) associated with over-dosing in a patient at risk for bleeding complications.
Our future work includes a closer examination (via chart review) of the underlying causes of occasional large discrepancies between the recommended and actual dosing of heparin. We hypothesize that the underlying causes of such discrepancies are multifactorial, which may include confounding clinical factors that were not adequately captured by the structured data within the EMR, and work flow-related issues that may have slowed down a timely response to an overshoot or an undershoot.
In conclusion, our preliminary results suggests that the RL framework allows for learning improved IV heparin dosing policies from retrospective data by considering the high-dimensional static and dynamic observations that are commonly available in electronic medical records. The adjusted treatment effect framework in association with the RL modeling approach provides a powerful tool for learning medication recommendation and surveillance models from retrospective clinical data. Further advancement in this clinical space has the potential to improve personalized delivery of care, reduce anticoagulation-related complications, and reduce healthcare expenditures.
ACKNOWLEDGMENTS
S.N. is grateful for an NIH early career development award in Biomedical Big Data science (1K01ES025445-01A1). M.M. Ghassemi would like to acknowledge the Salerno foundation, and the following NIH training Grants: T32EB001680, T90DA22759, T32HL007901. The authors would like to thank the Emory Data Analytics and Biostatistics (DAB) Core for assistance with data extraction from the Emory Clinical Data Warehouse.
REFERENCES
- [1].Hutchinson A, Baker R et al. , Making use of guidelines in clinical practice. Radcliffe Publishing, 1999. [Google Scholar]
- [2].Nemati S, Ghassemi MM, and Clifford GD, “Optimal medication dosing from suboptimal clinical examples: A deep reinforcement learning approach,” in Engineering in Medicine and Biology Society (EMBC), 2016 IEEE 38th Annual International Conference of the. IEEE, 2016, pp. 2978–2981. [DOI] [PubMed] [Google Scholar]
- [3].Ghassemi MM, Richter SE, Eche IM, Chen TW, Danziger J, and Celi LA, “A data-driven approach to optimized medication dosing: a focus on heparin,” Intensive care medicine, vol. 40, no. 9, pp. 1332–1339, 2014. [DOI] [PMC free article] [PubMed] [Google Scholar]
- [4].Ghassemi MM, Alhanai T, Westover MB, Mark RG, and Nemati S, “Personalized medication dosing using volatile data streams,” in AAAI, 2018, p. In press. [Google Scholar]
- [5].Cowie MR, Blomster JI, Curtis LH, Duclaux S, Ford I, Fritz F, Goldman S, Janmohamed S, Kreuzer J, Leenay M et al. , “Electronic health records to facilitate clinical research,” Clinical Research in Cardiology, vol. 106, no. 1, pp. 1–9, 2017. [DOI] [PMC free article] [PubMed] [Google Scholar]
- [6].Anglemyer A, Horvath HT, and Bero L, “Healthcare outcomes assessed with observational study designs compared with those assessed in randomized trials,” The Cochrane Library, 2014. [DOI] [PMC free article] [PubMed] [Google Scholar]
- [7].Kaelbling LP, Littman ML, and Moore AW, “Reinforcement learning: A survey,” Journal of artificial intelligence research, vol. 4, pp. 237–285, 1996. [Google Scholar]
- [8].Johnson AE, Pollard TJ, Shen L, Li-wei HL, Feng M, Ghassemi M, Moody B, Szolovits P, Celi LA, and Mark RG, “Mimic-iii, a freely accessible critical care database,” Scientific data, vol. 3, p. 160035, 2016. [DOI] [PMC free article] [PubMed] [Google Scholar]
- [9].N. C. for Health Statistics (US) et al. , The International Classification of Diseases: 9th Revision, Clinical Modification: ICD-9-CM, 1991.
- [10].Lillicrap TP, Hunt JJ, Pritzel A, Heess N, Erez T, Tassa Y, Silver D, and Wierstra D, “Continuous control with deep reinforcement learning,” arXiv preprint arXiv:1509.02971, 2015. [Google Scholar]
- [11].Silver D, Lever G, Heess N, Degris T, Wierstra D, and Riedmiller M, “Deterministic policy gradient algorithms,” in Proceedings of the 31st International Conference on Machine Learning (ICML-14), 2014, pp. 387–395. [Google Scholar]
- [12].Mnih V, Kavukcuoglu K, Silver D, Graves A, Antonoglou I, Wierstra D, and Riedmiller M, “Playing atari with deep reinforcement learning,” arXiv preprint arXiv:1312.5602, 2013. [Google Scholar]
- [13].Sutton RS, McAllester DA, Singh SP, and Mansour Y, “Policy gradient methods for reinforcement learning with function approximation,” in Advances in neural information processing systems, 2000, pp. 1057–1063. [Google Scholar]
- [14].Hirano K and Imbens GW, “The propensity score with continuous treatments,” Applied Bayesian modeling and causal inference from incomplete-data perspectives, vol. 226164, pp. 73–84, 2004. [Google Scholar]


