Abstract
Video techniques for monitoring exposure, such as NIOSH’s “Helmet-CAM,” employ both real-time dust monitors and mobile video cameras to assess workers’ respirable dust exposures. Many real-time personally worn dust monitors utilize light scattering sensing elements, which are subject to measurement biases as a function of dust type (size, composition, shape factor) and environmental conditions such as relative humidity. These biased and inaccurate dust measurements impair the monitor’s ability to properly represent actual respirable dust concentrations. In the testing described, instrument mass concentration data was collected using three different types of commonly used commercial off-the-shelf personal dust monitors and compared to a reference standard. This testing was performed in a calm air (Marple) dust chamber in which three units of each make and model (for a total of nine monitors) were used for each test. Equivalency factors (EF, a multiplier to match the Thermo TEOM 1400a reference instrument) ranged between 0.746 and 1.879 across all dusts and environmental conditions tested, and between 0.821 and 1.519 on the ISO test dust.
Keywords: Light scattering instrument, Industrial mineral dusts, Respirable dust sampler, Aerosol sampling methods, Equivalency factor
1. Introduction
Exposure to respirable crystalline silica remains a serious health concern for U.S. miners. Silica’s toxicity has led the Mine Safety and Health Administration (MSHA) to set a personal exposure limit that is 15 times lower than that for coal dust (100 μg/m3 for silica vs. 1500 μg/m3 for coal). Outside of mining, the 2015 Occupational Safety and Health Administration (OSHA) rule has even further reduced the exposure limit to 50 μg/m3. The latest estimate of non-coal mining employment (Spring/Summer 2008) estimates the number of workers at 161,542 [1]. The MSHA health samples data of that year reveals that there were 3642 samples collected for respirable dusts including quartz [2]; therefore, approximately 2.2% of metal/nonmetal (M/NM) and stone, sand, and gravel workers had a compliance sample taken in that year. Given the varied nature of miners’ job tasks, dust content, and environmental conditions, it is difficult to estimate their daily personal exposures.
To assist mines in pinpointing elevated dust exposures in their workforce, NIOSH has developed a video exposure monitoring (VEM) technology termed “Helmet-CAM” [3]. Helmet-CAM hardware consists of a wearable video camera (typically mounted on the worker’s hardhat or shoulder) and a wearable real-time respirable dust monitor. NIOSH has also developed a custom software package called EVADE [4] (Enhanced Video Analysis of Dust Exposures), which is downloadable from the NIOSH website (https://www.cdc.gov/niosh/mining/Works/coversheet1867.html). EVADE allows users to quickly and easily merge recorded video and monitor results, perform simple analysis, and identify events that led to higher exposures. Specific hardware is not required and EVADE can merge data from multiple cameras and monitors (in generic, universal formats). In its research, NIOSH has routinely used the Thermo pDR-1500 (Waltham, MA) instrument because of its onboard filter option, which allows for a secondary analysis technique such as silica estimation by XRD [5] to be used after the Helmet-CAM session. Prior studies have shown that the pDR-1500 is accurate when mass corrected with measurements from the onboard filter [6].
The light scattering techniques commonly used in real-time recording dust monitors are based on the principle of the Mie theory [7, 8]. Light scattering methods direct a fixed wavelength laser at the dust particles, causing them to scatter electromagnetic radiation which is then measured by photodetectors whose response is proportional to the amount of dust in the air. It is well known that light scattering methods are dependent on particle characteristics such as size, shape, and refractive index and are only corrected by calibrating with dust with the same optical properties [9, 10]. Prior studies have assessed the response of similar instruments with different industrial dusts [11] including stone dust, solid and engineered wood dusts, and white flour. In support of a similar video exposure monitoring system (named PIMEX), another study [12] examined the performance of direct reading personal respirable dust monitors and found good response linearity for monitors in both active (air drawing) and passive modes.
The objective of this work was to establish equivalency factors (EF is the multiplier required to match the reference instrument) for three personal respirable dust monitors used in the U.S. M/NM industry across various mineral dusts. This would aid the plant-level industrial hygienist in collecting more accurate data in the absence of specific, routine, gravimetrically derived corrections for the monitors. The study focused on the determination of these EFs with specific dusts rather than isolating certain dust characteristics such as size and refractive index, although there certainly were these kinds of differences present in the materials tested. While instrument manufacturers recommend instrument/aerosol-specific corrections as a best practice [13], this step is not always taken, given the resource constraints on plant health and safety personnel. The EFs provided from this research should further demonstrate the necessity for such corrections, but in cases where this simply cannot be accomplished, the provided multipliers may yield more accurate results.
2. Methods
2.1. Instruments Tested
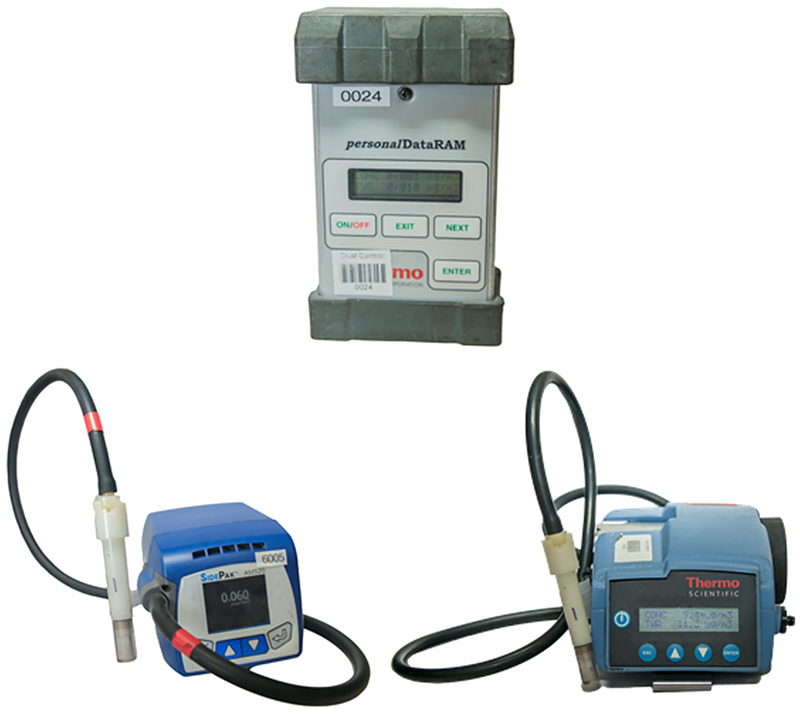
A total of nine individual dust monitors were used in this experiment—three units for each type of monitor (Fig. 1). The dust monitors tested were chosen because of their prevalence in the U.S. industrial minerals industry. All of the monitors are intended to be worn by the worker, most commonly employing belt loops, with the unit being supported by a heavy duty “miner’s belt.” Two of the three instruments were active and allowed for the use of an external cyclone—in this case, the Dorr-Oliver (DO) 10-mm nylon cyclone, since it is specified for compliance sampling in the U.S. M/NM mining industry. The DO nylon cyclones were used at a flow rate of 1.7 l/min for the active instruments. A summary of the instruments used and their basic characteristics are listed in Table 1. All sample lines were of consistent length (~ 81 cm) and conductive tubing (Thermo part no. 32-006785-0050, 0.48-cm ID) was used between the instrument and the cyclone. The use of a sampling line, even when a conducting material, can result in a loss of dust (by deposition in the tube) [14]. However, because the sampling line is an inherent part of the monitor that transfers the sample from the inlet to the size selector and the sensor, the losses are intrinsically included in the calculation of EFs.
Fig. 1.
Instruments tested—pDR-1000 (top), AM520 (lower left), and pDR-1500 (lower right)
Table 1.
Instruments tested
| Manufacturer | Model | Unit | Flow rate (l/min) | Cyclone selector | Active or passive |
|---|---|---|---|---|---|
| Thermo Scientific | pDR-1000 | 1000–1 | NA | None | Passive |
| 1000–2 | |||||
| 1000–3 | |||||
| Thermo Scientific | pDR-1500 | 1500–1 | 1.7 | 10-mm Nylon DO | Active |
| 1500–2 | |||||
| 1500–3 | |||||
| TSI | AM520 | 520–1 | 1.7 | 10-mm Nylon DO | Active |
| 520–2 | |||||
| 520–3 |
Descriptions and capabilities of the three different monitors used in this comparative testing are given below.
2.1.1. pDR-1000
The pDR-1000, or “personalDataRAM” (Thermo Scientific, Waltham, MA), is a passive, non-size-selective instrument whose light scattering sensing configuration is optimized to measure the respirable fraction of airborne dust, smoke, fumes, and mists in industrial and other indoor environments [15]. Dust enters the pDR-1000 via natural ambient airflow and moves under a rubber hood which shrouds the sensing chamber (to address sensitivity to ambient light).
2.1.2. pDR-1500
The pDR-1500 (Thermo Scientific, Waltham, MA) utilizes more modern electronics than the pDR-1000. This instrument is active, drawing from ambient air via a flow-controlled pump which allows for the use of a cyclone mounted to the inlet. The instrument includes an onboard, internal 37-mm filter holder which can provide a physical sample for further analysis (e.g., methods NIOSH 0600 for gravimetric correction or NIOSH 7500 for silica quantification).
In this testing, to better focus on the raw response of the monitor, software options to correct for the effects of relative humidity (RH) were disabled.
2.1.3. AM520
The AM520 personal aerosol monitor (TSI, Shoreview, MN) is active, pulling a sample through custom inlets with stated cut points in the respirable range. For the purposes of this experiment, the null inlet was used with a remote-mounted cyclone. The AM520 was factory calibrated with emery oil which is then correlated to ISO 12103–1, A1 test dust (fine Arizona Road Dust).
2.2. Dusts
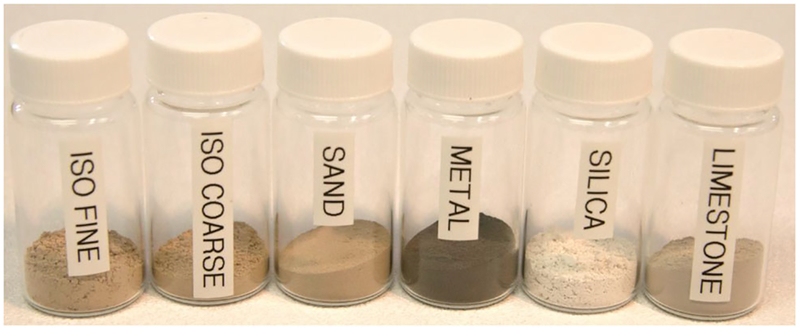
As shown in Fig. 2, the ISO test dusts used in this study (Arizona road dusts, ISO 12103–1 A2, “ISO FINE” and ISO 121013–1 A4, “ISO COARSE”) were obtained from Powder Technology International (Arden Hills, MN). The other dusts were collected in the course of NIOSH studies from producing U.S. mining operations. A “sand” dust was obtained from a surface sand operation, the “metal” dust from an underground platinum mine, and the “limestone” dust from an underground limestone mine. The fourth dust was obtained from a commercially available high purity silica product (MIN-U-SIL 5; U.S. Silica, Fredrick, MD). It is noted that smaller dusts are, in general, easier to control within the dust generator than larger dusts.
Fig. 2.
Dust types used for the study, including ISO fine and coarse, sand, metal, high purity silica, and limestone
Sizing (volume mean diameter) of the bulk materials was performed using a Beckman Coulter Particle Size Analyzer, model LS 13320 (Brea, CA), using an assumed constant index of refraction of 1.68. The volume mean diameter is not the same as the aerodynamic diameter, but still is provided to give an indication of the relative sizes of dusts (before aerosolization) (Table 2).
Table 2.
Bulk dust particle sizes
| Dust | Volume median diameter (μm) |
|---|---|
| ISO Fine | 6.97 |
| ISO Coarse | 36.12 |
| Sand | 30.54 |
| Metal | 11.38 |
| Silica | 2.49 |
| Limestone | 10.89 |
2.3. Chamber and Reference Equipment
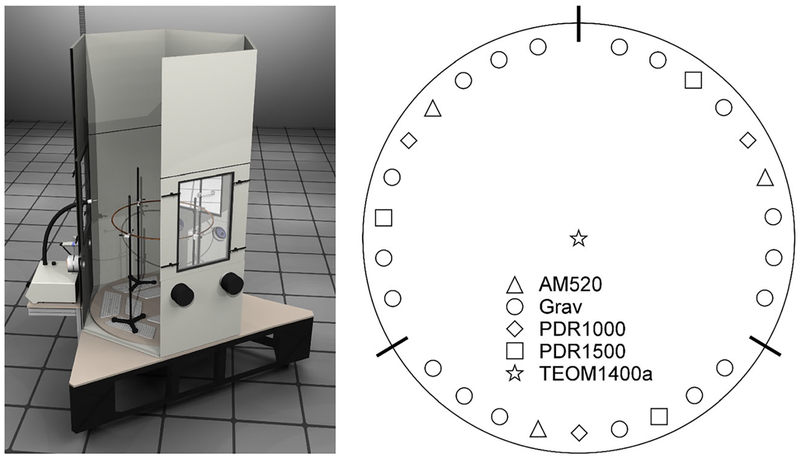
The aerosol testing chamber (Fig. 3) at NIOSH’s Pittsburgh Mining Research Division Laboratory was of the Marple design [16]. Equipped with reference instrumentation, it provided an optimal environment for side-by-side instrument comparisons and has been documented for low spatial variability [17, 18]. Concerns of the effects of over- or under-sampling due to inlet efficiency as a function of wind speed are eliminated due to the calm air environment [19]. Filtered air is supplied to the chamber by first entering a mass flow, humidity, and temperature controller (Miller-Nelson; model HCS-501; Livermore, CA). The air then enters a fluidized bed aerosolizer (TSI 3400A) where it is mixed with the particular dust used for the experiment. Next, this dust/air mixture proceeds into the radioactive charge neutralizer (TSI 3012A NRC) and then enters the top of the chamber and flows through a honeycomb flow straightener. Finally, the air is drawn down through the chamber via an adjustable damper meant to apply a slight vacuum. The chamber features a circular moving base with oscillating rotation about its center axis, to reduce any spatial variability. Eighteen gravimetric assemblies were also used for each day of testing, again distributed in a circle within the chamber. The gravimetric assemblies included 10-mm nylon DO cyclone, two-piece plastic cassette, and a 5-μm pore, 37-mm PVC filter (SKC, Eighty-Four PA, Cat. No. 225–80,601 K). The flow rates of these gravimetric assemblies were also checked with the flow calibrator. Critical orifices, designed for 1.7 l/min flow, were connected in groups of six, and the filter samples were connected to each of three manifolds so that the vacuum could be simultaneously turned on for six (6) filter assemblies when each steady-state concentration level had been reached.
Fig. 3.
Calm air Marple chamber used for experiments—exterior cutaway view (left) and internal sampler layout (right). Sampler cyclone inlets were distributed around the circular ring (0.8-m diameter, mid-height in chamber)
2.4. Test Plan and Design of Experiments
Side-by-side comparisons were performed under controlled conditions within the Marple chamber against a reference instrument. The test plan used a Thermo Scientific TEOM 1400a equipped with a DO cyclone and operated at 1.7 l/min as the reference. The various dust monitors under evaluation were compared to the 1400a real-time concentration readings and EFs determined. By using a real-time reference, it was possible to directly compare the data points from the dust monitors to those of the reference instrument. All instruments were set to sample at their highest possible rate—one reading every 2 s—but the reference TEOM recorded rolling 15-min averages every minute. A 6 × 2 test grid was used, with six dusts and two humidity levels per dust. To achieve the greatest possible differences in instrument response, the lowest and highest humidities possible in the chamber were targeted (approximately 30% and 90% RH).
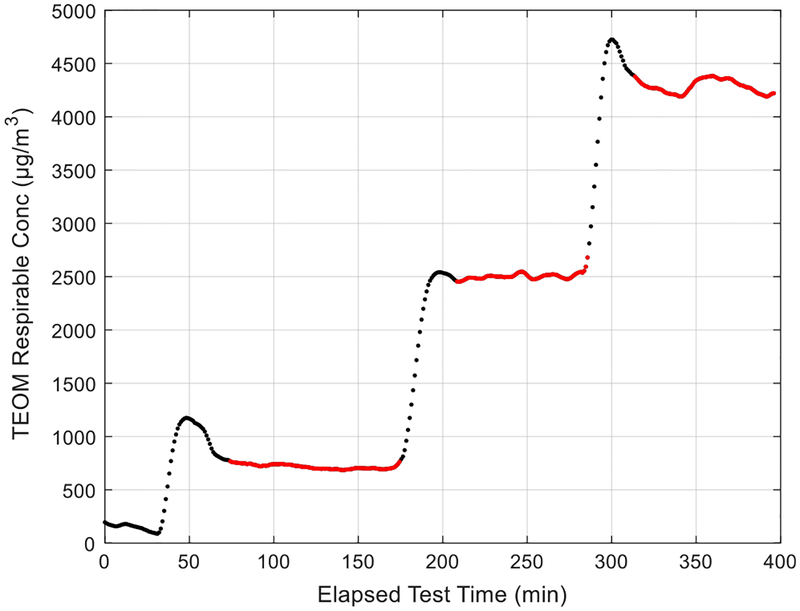
Each test attempted to reach and maintain three distinct dust concentration plateaus (Fig. 4)—700, 2500, and 4300 μg/m3. These concentrations were chosen based on the actual ranges observed in the field as well as those used in prior instrument comparisons [6, 17]. Each concentration plateau was held for approximately 90 mins, and accounting also for an initial zero period as well as transitions between levels each test lasted around 6.5 h. This approach ensured that the dust concentrations would be achievable by the chosen experimental setup and relatable to previous work performed in the same NIOSH laboratory.
Fig. 4.
Typical respirable dust concentration profile as measured by the reference TEOM 1400a monitor (ISO Fine test dust shown)
Before each day of sampling, each of the test monitors was zeroed with a HEPA filter on its inlet, with flow adjusted against a Gilibrator-2 primary airflow calibrator (Sensidyne, St. Petersburg, FL). The flow rate of the TEOM reference instrument was also checked. The instruments were then set into the chamber and their cyclone inlets attached around the circular ring at a fixed height. The monitors were distributed spatially in the chamber in three sets, with one unit of each monitor type per set, such that they were offset from each other by 120°. The environmental controller was then turned on and the conditions in the Marple chamber were allowed to stabilize for 30 mins. This period also served as a zero point of reference to further ensure that the instruments were operating normally. The process of achieving the dust concentration plateaus involved monitoring the concentration levels and adjusting the flow rate to the chamber and dust generation rate accordingly. Between testing of each dust type (ISO fine, sand, limestone, etc.), the chamber was thoroughly cleaned with pressurized air and a HEPA vacuum.
2.5. Data Processing and Statistical Approach
As previously stated, the objective of these experiments was to determine the coefficient by which specific light scattering instruments’ dust concentrations should be multiplied to best estimate the reference monitor concentrations for different types of dust and relative humidity levels.
To obtain better fits of the linear models, data was edited to remove time periods of rapid concentration change, which can be problematic when comparing instruments with different response times and recording rates. Data analysis focused on plateau concentration periods, where concentrations were most accurately known and there were no time offsets between the correlated data records. Weighted least squares (WLS) regression equations included intercepts in order to enhance the accuracy of derived slopes. The majority of the WLS regressions were performed using an iterative weight estimation process described in statistics literature [20]. The other regressions were performed using an SPSS weight estimation procedure. This procedure tests weight transformations based on a range of powers of the predictor variable and identifies the transformation that provides the best fit to the data. The homogeneity of variance of the weighted residuals was examined by the Levene test [21]. All statistical calculations were performed using IBM SPSS Statistics for Windows, Version 24.0, released in 2016, IBM Corporation, Armonk, NY.
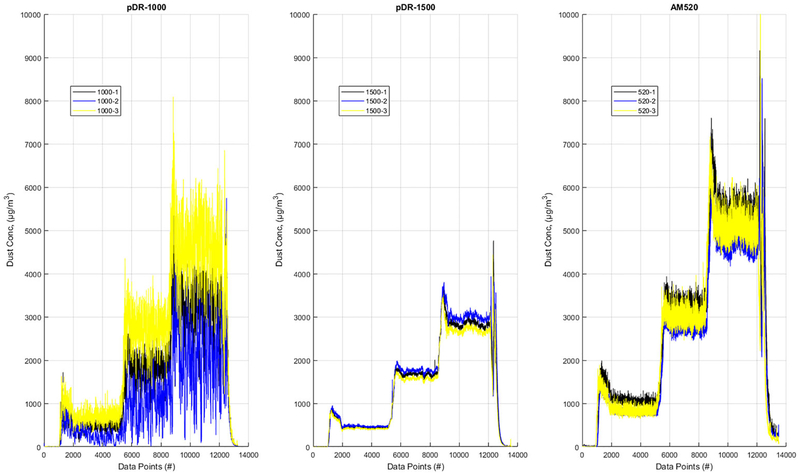
The testing generated 130 individual data files with approximately 1.5 million raw data pairs. To ensure that the data would be handled consistently and to reduce the potential for human error in file manipulation, all of the data pre-processing was handled in Matlab (version 9.2, 2017). First, a software routine was created for each instrument type (pDR-1500, AM520, etc.) which would read in the raw ASCII files (Fig. 5). These files contain some header information and then rows of time and date records, concentration values, error codes, and other diagnostics.
Fig. 5.
Initially imported signals for each tested instrument before synchronization for time offset and data processing
For each test, data was pooled (not averaged) for each type of monitor. Next, the pooled data was plotted to visually inspect for potential anomalies (for example, a dust monitor that failed mid-way during testing). Because the reference data was not sampled at the same rate as the dust monitors, it needed to be digitally resampled; this was done using an anti-aliasing finite-duration impulse response (FIR) low-pass filter with delay compensation. Once at the same rate, the data sets were cropped to match the length of the shortest set (no meaningful data was lost since all instruments were started well before and stopped well after the target concentration plateaus were reached).
Because the data was recorded individually to each dust monitor, all monitors were manually started by the test technician in an effort to synchronize the data sets. Later, the data sets were better synchronized using a peak identification scheme, because of its robustness and the presence of strong, unmistakable peaks in the data sets. Even though all of the instruments are “real-time” or “nearly real-time,” they all have their own characteristic response times. While every effort had been made to resample and synchronize the data sets, it was worthwhile to remove transitionary data in between the target concentration plateaus, since this would further eliminate the effects of varying response times.
To accomplish this transition period removal (and to address when a plateau did not occur in a single uninterrupted time span), again an automated routine was written that identified two factors of data to reject. The first criterion was to remove data that was not within ± 10% of the target concentration. The second criterion removed data whose positive rate of change was > 200 when the first derivative of the concentration versus time data was plotted (removal of black data points, Fig. 4). While both of these criteria were obtained by trial and error, they did allow for a fixed set of minimal conditions to screen the data into a form that met the intended test conditions.
After these steps, the data was finally hand-edited where the few transition outliers that made it through the previously outlined steps were removed. The ordinal plots of the reference concentration were presented to the authorship team and consensus was reached on which points to remove (typically not more than 20 points in a data set of 600 were identified and removed). There were then three clusters of data remaining, one for each of the concentration plateaus. These data sets, still pooled by monitor type, were then written back into an ASCII format for statistical processing, including WLS regressions in SPSS.
3. Results and Discussion
3.1. Data Quality and Results Presentation
A total of twenty-six (26) linear regressions were completed. All dust types were tested at two humidity conditions except for the ISO Fine which had three RH levels. The process of collecting and analyzing the gravimetric filter results ended with the research team deciding that no correction to the reference TEOM was justified (the mean gravimetric correction required would be only 1.014).
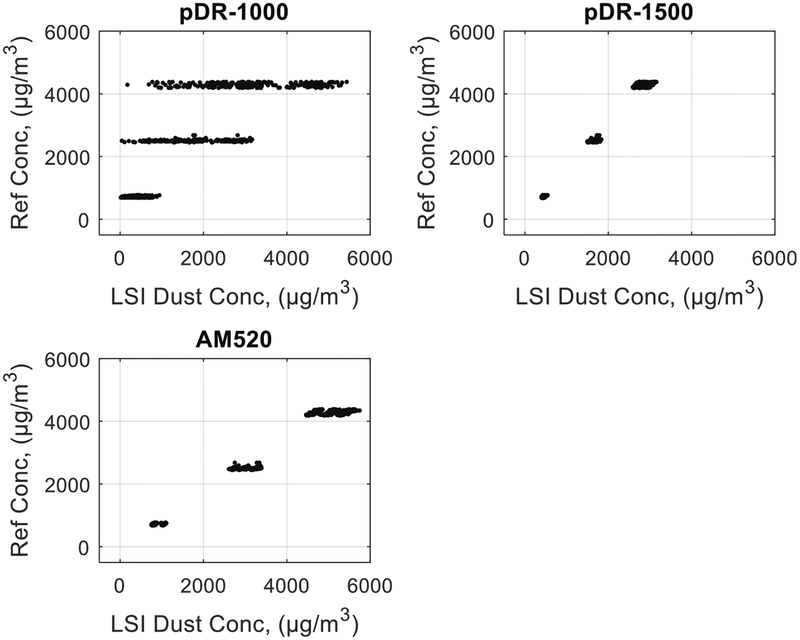
The response of the pDR-1000 had substantial scatter (Fig. 6) likely due to its design as a passive instrument intended for moving air environments (which precludes its use with a size classifier). As such, the calm air Marple chamber may not be an appropriate environment in which to test passive dust samplers. The pDR-1000 units were positioned in the Marple chamber in their normal (dust hood up) orientation, which possibly impeded the very low airflow from entering the sensing chamber. For this instrument, the R2 values were much lower (~ 0.680), and for that reason, the EFs are not presented, since the data is not of the same quality as from the other instruments. Fitting data with a high level of the variance would have required different statistical methods for a single instrument type, compromised the cohesiveness of the larger study, and produced presumptive EFs that would be used with much less confidence.
Fig. 6.
Final data clusters for the calibration test dust, ISO Fine A1. The increased scatter of the pDR-1000 data can be clearly seen in this calm-air environment (upper left)
For each regression, the EF (slope), slope intercept, lower and upper 95% confidence interval limits, R2 (coefficient of determination), and SEE (standard error of the estimate) values are reported (Table 3). The mean R2 value was 0.985 for the combined AM520 and pDR-1500 regressions.
Table 3.
Statistical results summary
| Dust type | Relative humidity (RH) | Test instrument | Slope value | Slope 95% LCL | Slope 95% UCL | Intercept value | Intercept 95% LCL | Intercept 95% UCL | R2 value | SEE |
|---|---|---|---|---|---|---|---|---|---|---|
| ISO FINE | 30 | PRD1500 | 1.506 | 1.495 | 1.516 | 76.736 | 69.450 | 84.023 | 0.991 | 1.175 |
| 30 | AM520 | 0.821 | 0.814 | 0.829 | 57.747 | 43.975 | 71.519 | 0.984 | 1.190 | |
| 60 | PRD1500 | 1.478 | 1.470 | 1.486 | 61.509 | 55.298 | 67.720 | 0.994 | 1.147 | |
| 60 | AM520 | 0.846 | 0.839 | 0.854 | −18.800 | −33.481 | −4.120 | 0.985 | 1.162 | |
| 90 | PRD1500 | 1.519 | 1.504 | 1.534 | −10.781 | −27.340 | 5.778 | 0.984 | 1.256 | |
| 90 | AM520 | 0.896 | 0.884 | 0.909 | −206.648 | −235.145 | −178.152 | 0.969 | 1.223 | |
| ISO | 30 | PRD1500 | 1.632 | 1.622 | 1.643 | 8.895 | 1.851 | 15.940 | 0.993 | 1.138 |
| COARSE | 30 | AM520 | 0.859 | 0.851 | 0.867 | 56.151 | 46.640 | 65.662 | 0.984 | 1.132 |
| 90 | PRD1500 | 1.496 | 1.484 | 1.509 | 51.656 | 41.361 | 61.951 | 0.986 | 1.107 | |
| 90 | AM520 | 0.982 | 0.976 | 0.989 | −57.222 | −71.390 | −43.064 | 0.991 | 1.165 | |
| SAND | 30 | PRD1500 | 1.627 | 1.587 | 1.666 | 74.048 | 53.840 | 94.246 | 0.975 | 0.012 |
| 30 | AM520 | 0.949 | 0.919 | 0.979 | 82.201 | 52.447 | 111.955 | 0.958 | 0.112 | |
| 90 | PRD1500 | 1.610 | 1.578 | 1.642 | 53.584 | 27.374 | 79.794 | 0.976 | 0.401 | |
| 90 | AM520 | 0.990 | 0.963 | 1.018 | −25.562 | −66.934 | 15.202 | 0.953 | 0.350 | |
| METAL | 30 | PRD1500 | 1.879 | 1.869 | 1.890 | 32.282 | 26.594 | 38.171 | 0.995 | 1.205 |
| 30 | AM520 | 1.159 | 1.148 | 1.170 | −29.869 | −42.540 | −17.198 | 0.985 | 1.147 | |
| 90 | PRD1500 | 1.794 | 1.784 | 1.804 | 87.964 | 82.397 | 93.531 | 0.994 | 1.247 | |
| 90 | AM520 | 1.156 | 1.146 | 1.167 | 17.924 | 4.961 | 30.886 | 0.982 | 1.155 | |
| SILICA | 30 | PRD1500 | 1.517 | 1.502 | 1.531 | −0.899 | −14.286 | 12.487 | 0.990 | 1.215 |
| 30 | AM520 | 1.013 | 1.001 | 1.025 | −138.127 | −158.842 | −117.412 | 0.978 | 1.624 | |
| 90 | PRD1500 | 1.491 | 1.483 | 1.499 | 72.362 | 65.306 | 79.417 | 0.995 | 1.151 | |
| 90 | AM520 | 0.829 | 0.821 | 0.836 | 48.056 | 35.182 | 60.929 | 0.985 | 0.460 | |
| LIMESTONE | 30 | PRD1500 | 1.373 | 1.365 | 1.380 | 57.921 | 52.236 | 63.515 | 0.995 | 1.191 |
| 30 | AM520 | 0.746 | 0.739 | 0.752 | 67.148 | 55.541 | 78.756 | 0.987 | 1.151 | |
| 90 | PRD1500 | 1.318 | 1.308 | 1.327 | 101.240 | 93.357 | 109.122 | 0.992 | 1.207 | |
| 90 | AM520 | 0.758 | 0.750 | 0.766 | 62.639 | 46.933 | 78.345 | 0.983 | 1.175 |
LCL, lower confidence limit; UCL, upper confidence limit; SEE, standard error of the estimate
While all of the tests were run for the same approximate duration, the final trimmed data sets vary in size from 173 points to 831. Some of the dusts were more difficult to control with the dust generator than others. Therefore, stable concentration plateaus were more difficult to achieve with those dusts and fewer final data points survived the selection criteria described above.
3.2. Discussion of Equivalency Factors
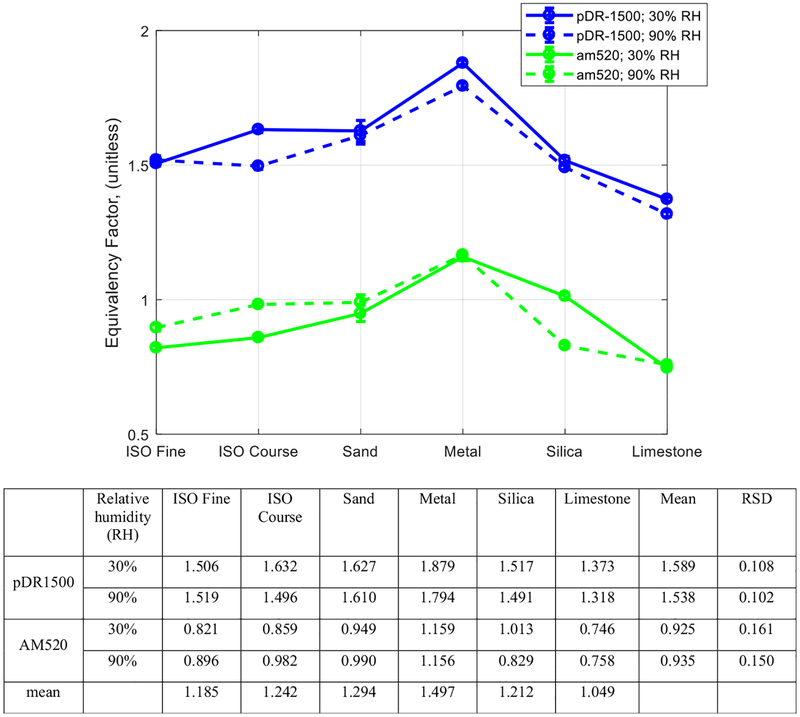
Comparing the pDR-1500 and AM520, on average across all dusts and humidities in Fig. 7, the pDR-1500 had an EF average of 1.564 compared to the 0.931 for the AM520. Examining the calibration dust at 30% RH, the EFs were similar to those pooled means, with an EF of 1.506 for the pDR-1500 and 0.821 for the AM520. The metal dust required the highest EF and limestone the lowest for both instruments. This means that the instruments tended to over-read for limestone and under-read for the metal dust. To illustrate the application of these EFs, consider a hypothetical sand plant operator (sand corrections are 1.627 and 0.949 for the pDR-1500 and AM520) whose crystalline silica content averages 50%. Assuming that the sampling was conducted in low humidity and the mean shift concentration reported by the dust monitor was 150 μg/m3, this would yield an exposure of 122 μg/m3 (silica content only, with total respirable dust higher) with the pDR-1500 and 71 μg/m3 using the AM520. The magnitude of these differences could significantly impact the mine’s decision to implement engineering controls.
Fig. 7.
Equivalency factor results for the pDR-1500 and AM520 with exact values shown in table
While the pDR-1500 required higher EFs compared to the AM520, the relative standard deviation (RSD) instrument response across dust types was lower (0.105) for the pDR-1500 than for the AM520 (0.156). Note that this describes the variation of the instrument’s response across dusts, not the intra-instrument response to a single test condition (i.e., noise).
Averaged across instrument and humidity, the EFs ranged between 1.049 and 1.497 for the limestone and metal dusts, respectively. For the pDR-1500, the limestone dust provided EFs closest to unity (1.373 and 1.318) for 30% and 90% RH, respectively. For the AM520, the sand dust had the closest EFs to unity (0.949 and 0.990) for 30% and 90% RH. Generally, EF was not greatly affected by RH level. For any given instrument/dust combination, varying RH did not prove to be a decisive factor. While this cannot guarantee the same outcome for all possible dusts that might be measured in the field, it was the consistent result among the dusts used in this current research.
On average, the larger-size coarse dust caused the pDR-1500 to under-read (larger EFs) by 3.4% and the AM520 by 7.2% (even in the presence of a size selector). The light scattering instruments were, as expected, sensitive to dust composition. When compared to ground silica, the sand material resulted in higher average EFs, which agrees with the trends seen with other test dusts (i.e., larger dusts result in higher EFs).
The metal dust had the darkest color and produced the highest EFs. The ground silica had the lightest color and its EFs were statistically similar to the calibration aerosol; though not identical, they are both lighter, smaller size dusts.
Because the data sets were logged individually on each instrument and then resampled and synchronized with a post-processing scheme, some small residual or artificial offsets between data sets are possible. The limitations of the environmental controller used, as well as ambient conditions during testing, caused humidity to be controlled within more limited boundaries than targeted. For example, when 90% RH was targeted, it was more realistic that 78% ± 6% was achieved. The dusts that were used were not particularly hygroscopic, which would consequently limit the absorption response of their particles and thus any humidity-related effect on EF.
4. Conclusions
Survey quality results are presented and discussed comparing the performance of three commercially available light scattering dust monitors to a reference monitor tested within a laboratory aerosol chamber. The resulting regressions and EFs show that even on a calibration test aerosol, averaging the 30% and 90% RH results, the instruments require significant correction, with multipliers of 0.859 and 1.513 for the AM520 and pDR-1500, respectively. The fact that calibration factors stray from unity on test dust suggests differences in the specific calibration practices of each manufacturer (aerosol testing chamber, charge neutralization, dust generation mechanism, specific calibration dust used, etc.). Across the six (6) different dusts tested, EFs ranged from 0.746 to 1.879.
The calibration of personal dust monitors must be completed for each “location” of their intended use. Here, location is used to define where dust composition and environment are consistent enough to not significantly change the EF required for instrument correction. It is not uncommon for changing strata to include different minerals that could then potentially change the optical properties of the dust and hence the performance of the light scattering instrument. Individual operators have the best sense on how varied their mine’s ore composition is and are advised to conduct gravimetric corrections of their light scattering instruments in each location until they have established confidence that the performance is consistent with the dust being sampled.
Personal dust monitors have great utility in helping safety personnel locate areas and tasks of overexposure. This work has shown that the monitor’s performance is tied (in part) to the physical properties of the dust being sampled. A controlled laboratory calibration such as the one provided here should allow operators to have an initial calibration factor for dusts similar to those tested. Further, the differences shown with material type should encourage mining operators to conduct their own gravimetric sampling in parallel with the personal dust monitors to develop their own correction scheme. The decision to employ various dust mitigation strategies (engineering, administrative, or otherwise) is driven by exposure monitoring data. When that data is generated from real-time light scattering instruments, operators should take reasonable precautions to ensure it is corrected with respect to their particular aerosol.
Acknowledgements
We are grateful to NIOSH researcher James Noll who helped to design and pilot studies in this area. We also appreciate the experience and expertise of NIOSH technicians Joe Archer and Jeanne Zimmer (both retired) for their execution of the tests in the Marple chamber and handling of the gravimetric filters. Finally, we thank Jarod Myers for conducting the bulk particle sizing.
Footnotes
Conflict of Interest The authors declare that they have no conflict of interest.
Publisher's Disclaimer: Disclaimer The findings and conclusions in this paper are those of the authors and do not necessarily represent the official position of the National Institute for Occupational Safety and Health, Centers for Disease Control and Prevention. Mention of any company or product does not constitute an endorsement by NIOSH.
Publisher’s Note Springer Nature remains neutral with regard to jurisdictional claims in published maps and institutional affiliations.
References
- 1.McWilliams LJ, Lenart PJ, Lancaster JL, Zeiner JR Jr (2012) National survey of the mining population part 1: employees. Office of Mine Safety and Health Research, Information Circular, IC, 9527, 2522. [Google Scholar]
- 2.MSHA (2017) MSHA Data Sets; Personal Health Samples. Retrieved from https://arlweb.msha.gov/OpenGovernmentData/OGIMSHA.asp [Google Scholar]
- 3.Cecala AB, O’Brien AD (2014) Here comes the Helmet-CAM: a recent advance in technology can improve how mine operators investigate and assess respirable dust. Rock Prod 117:26–30 [Google Scholar]
- 4.Haas EJ (2018) How health & safety professionals can use EVADE Software to assess worker exposure. (DHHS (NIOSH) Publication No. 2018–108d; ). Retrieved from https://www.youtube.com/watch?v=tQdaE9ronqg [Google Scholar]
- 5.NIOSH (1994) NIOSH, Manual of Analytical Methods: US Department of Health and Human Services, Public Health Service, Centers for Disease Control and Prevention, National Institute for Occupational Safety and Health, Division of Physical Sciences and Engineering [Google Scholar]
- 6.Reed WR, Potts JD, Cecala AB, Archer WJ (2012) Use of the 1500-pDR for gravimetric respirable dust measurements at mines SME Transactions [Google Scholar]
- 7.Chu B (2007) Laser light scattering: basic principles and practice: Courier Corporation [Google Scholar]
- 8.Mishchenko MI, Hovenier JW, Travis LD (1999) Light scattering by nonspherical particles: theory, measurements, and applications: Elsevier [Google Scholar]
- 9.Williams KL, Timko RJ (1984) Performance evaluation of a real-time aerosol monitor (Information Circular 8968; ) [Google Scholar]
- 10.Page SJ, Jankowski RA (1984) Correlations between measurements with RAM-land gravimetric samplers on longwall shearer faces. Am Ind Hyg Assoc J 45(9):610–616 [Google Scholar]
- 11.Thorpe A, Walsh PT (2002) Performance testing of three portable, direct-reading dust monitors. Ann Occup Hyg 46(2): 197–207 [DOI] [PubMed] [Google Scholar]
- 12.Thorpe A, Walsh PT (2007) Comparison of portable, real-time dust monitors sampling actively, with size-selective adaptors, and passively. Ann Occup Hyg 51(8):679–691 [DOI] [PubMed] [Google Scholar]
- 13.TSI (2015) Custom Cal Factor for Diesel Particulate Matter (DPM)
- 14.Peters TM, Volkwein JC (2003) Analysis of sampling line bias on respirable mass measurement. J Appl Occup Environ Hyg 18(6): 458–465 [DOI] [PubMed] [Google Scholar]
- 15.Scientific Corporation, Thermo Scientific (2013) Model pDR-1000AN/1200 personalDATARAM Instruction Manual
- 16.Marple VA, Rubow KL (1983) An aerosol chamber for instrument evaluation and calibration. Am Ind Hyg Assoc J 44(5):361–367 [Google Scholar]
- 17.Volkwein JC, Vinson RP, Page SJ, McWilliams LJ, Joy GJ, Mischler SE, Tuchman DP (2006) Laboratory and field performance of a continuously measuring personal respirable dust monitor
- 18.Kogut J, Tomb TF, Parobeck PS, Gero AJ, Suppers KL (1997) Measurement precision with the coal mine dust personal sampler. Appl Occup Environ Hyg 12(12):999–1006 [Google Scholar]
- 19.Listak JM, Checkan GJ, Colinet JF, Rider JP (2007) Performance of a light scattering dust monitor at various air velocities: results of sampling in the active versus the passive mode. Int J Miner Res Eng 12(1):35–47 [Google Scholar]
- 20.Neter J, Kutner MH, Nachtsheim CJ, Wasserman W (1996) Applied linear statistical models (Vol. 4): Irwin; Chicago [Google Scholar]
- 21.Natrella M (2012) NIST/SEMATECH e-handbook of statistical methods. http://www.itl.nist.gov/div898/handbook, 11/30/2018


