

SUMMARY
We found that exposure of adult animals to caloriedense foods rapidly abolished expression of mitofusin 2 (Mfn2), a gene promoting mitochondrial fusion and mitochondrion-endoplasmic reticulum interactions, in white and brown fat. Mfn2 mRN was also robustly lower in obese human subjects compared with lean controls. Adipocyte-specific knockdown of Mfn2 in adult mice led to increased food intake, adiposity, and impaired glucose metabolism on standard chow as well as on a diet with high calorie content. The body weight and adiposity of mature adipocyte-specific Mfn2 knockout mice on a standard diet were similar to those of control mice on a high-fat diet. The transcriptional profile of the adipose tissue in adipocyte-specific Mfn2 knockout mice was consistent with adipocyte proliferation, increased lipogenesis at the tissue level, and decreased glucose utilization at the systemic level. These observations suggest a possible crucial role for mitochondrial dynamics in adipocytes in initiating systemic metabolic dysregulation.
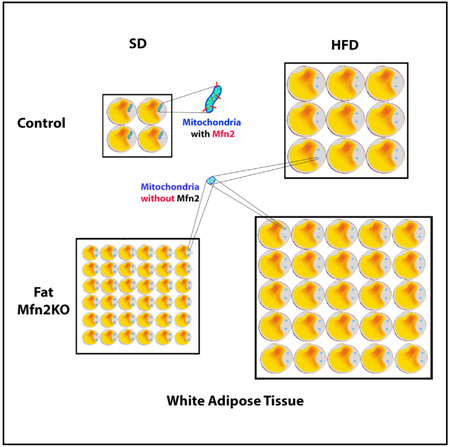
Graphical Abstract
In Brief
Mancini et al. find that the mitochondrial fusion protein Mfn2 is lower in adipose tissue of mice on a high-fat diet and that of obese humans and that this protein in the fat is important for systemic control of metabolism.
INTRODUCTION
Mitochondria are intracellular organelles discovered more than a century ago (Benda, 1898), and for a long time they were considered the static powerhouses of the cell by providing energy in the form of ATP (Gilkerson et al., 2003; Mitchell, 1961). Far from being static, mitochondrial architecture is determined by continuous events of fusion and fission, a process known as mitochondrial dynamics (Koning et al., 1993; Bereiter-Hahn and Vöth, 1994; Chen et al., 2003). In mammals, mitochondrial fusion of the outer membranes is mediated by mitofusins, including mitofusin 2 (mfn2) (Santel and Fuller, 2001; Santel et al., 2003; Rojo et al., 2002; Eura et al., 2003). Besides mediating fusion, mitofusin 2 has also been described as a player in the establishment of contacts between mitochondria and other organelles, such as the endoplasmic reticulum (ER) (de Brito and Scorrano, 2008; Schneeberger et al., 2013). Furthermore, several studies have highlighted the key role of mitochondrial dynamics in the ability of neuronal cells to adapt to fluctuations in nutrient availability (Baltzer et al., 2010; Parton et al., 2007; Mandl et al., 2009.; Youle and van der Bliek, 2012; Dietrich et al., 2013; Schneeberger et al., 2013).
White adipose tissue (WAT) and brown adipose tissue (BAT) are in the center of systemic metabolic control. The role of mitochondria in WAT physiology has been less well studied compared with those of BAT. There are few mitochondria in WAT, not only relative to BAT but also compared with other cell types of various tissues. This is in line with an important function of WAT, which is to store energy from fuel, such as glucose in the form of fat, rather than to burn fuel. Such aspects of adipocytes provide an excellent model system in which the putative role of mitochondrial fusion controlled by mitofusin 2 may be tested in vivo.
To interrogate these questions in vivo, we sought to analyze mitochondrial fusion processes in a metabolic tissue with more homogeneity in structure and function than hypothalamic neuronal circuits by generating an adipocyte-restricted conditional knockout mouse line. Our study gave impetus to our hypothesis that mitofusin 2-mediated mitochondrial dynamics in adipocytes play a key role in regulating cellular and systemic metabolism.
RESULTS
High-Fat Diet Exposure Affects the Expression Profile of Proteins Involved in Regulation of Mitochondrial Dynamics
BL6/N mice were divided into two groups homogeneous for body weight at the sixth week of age (Figure S1). Mice were exposed to either a standard diet (SD) or high-fat diet (HFD) for 12 weeks, and their body weight was monitored (Figure 1A). Three days of exposure to the HFD did not affect the body weight (Figure 1A) or mitofusin 2 gene expression profile in WAT compared with SD-fed mice (Figure 1B). 4 weeks of exposure to the HFD significantly increased the body weight (Figure 1A), and expression of mitofusin 2 mRNA showed a significant decline (Figure 1B). Body weight measurements at 6 and 12 weeks confirmed the increased body weight of mice exposed to the HFD compared with SD-fed mice (Figure 1A). The mitofusin 2 gene expression profile in WAT from HFD-fed mice showed significantly lower levels at these time points compared with mice on the SD (Figure 1B). Co-analysis of time exposure to diet treatment, mouse body weight, and gene expression profile of mitofusin 2 in WAT (Figure 1C) revealed the existence of an inverse relationship between body weight gain and mitofusin 2 gene expression in WAT. At the end of the 12 weeks of HFD exposure, we evaluated the gene expression profile of different genes involved in the regulation of mitochondrial dynamics, such as pro-fusion mitofusin 1 (mfn1), optic atrophy 1 protein (OPA1), and pro-fission dynamin-related protein-1 (Drp1). Mfn1 gene expression analysis was found to be significantly reduced in mice exposed to the HFD compared with controls receiving the SD (Figure 1D). Despite previous studies showing a negative effect of the HFD on gene expression of OPA1 (Lionetti et al., 2013, 2014), we could not observe significant reductions in OPA1 mRNA in WAT from HFD-fed mice compared with those receiving the SD (Figure 1D). Drp1 gene expression analysis revealed increased levels of mRNA in WAT from mice receiving the HFD compared with SD-fed controls (Figure 1D). Our data are in line with previous studies showing increased gene expression levels of Drp1 in pancreatic β cells and skeletal muscle from mice receiving an HFD (Gomes et al., 2011; Jheng et al., 2012; Rambold et al., 2011; Wikstrom et al., 2007, 2014; Fealy et al., 2014).
Figure 1. Effect of a High-Fat Diet on the Gene Expression of Factors Mediating Mitochondrial Dynamics.

(A)Body weight of wild-type (WT) mice receiving a standard diet (SD) or high-fat diet (HFD) for a total treatment time of 12 weeks. Mice receiving the SD, n = 10; mice on the HFD, n = 10.
(B)Inverse relationship between mitofusin 2 gene expression in epididymal fat and body weight gain in mice exposed to the HFD.
(C)Relative mitofusin 2 mRNA levels in epididymal fat (EF) at different time points during diet treatment. SD, n = 5–6; HFD, n = 4–6. Values were normalized to the SD.
(D)Gene expression analysis of different genes involved in the regulation of mitochondrial dynamics in white adipose tissue from the mice shown in (C) at the end of the 12 weeks of HFD treatment. Mfn1, mitofusin 1; opa, optic atrophy 1; drp1, pro-fission dynamin-related protein-1. Values were normalized to the SD.
(E and F) Relative mitofusin 2 mRNA levels in subcutaneous (E) and visceral (F) fat from lean (n = 17) and obese (n = 295) human subjects.
Data are mean ± SEM. Statistics: Student’s t test; *p < 0.05, **p < 0.01, ***p < 0.001 versus control. See also Figure S1.
Recent studies have shown that mutation in the mitofusin 2 gene is linked to increases in adipocyte hyperplasia and mitochondrial dysfunction in humans (Sawyer et al., 2015; Rocha et al., 2017). The gene expression profile of mitofusin 2 in subcutaneous and visceral adipose tissue from human subjects revealed a significant reduction of its expression in obese patients compared with lean controls (Figures 1E and 1F), providing further evidence of the involvement of mitofusin 2 in the pathophysiology of obesity.
Generation of Adult Adipocyte-Specific Mitofusin 2-Deficient Mice
To test whether declining adipose tissue expression of mitofusin 2 is a cause or consequence of body weight gain in adult mice on an HFD, we generated an adipocyte-specific mitofusin 2 knockout mouse line by crossing mitofusin 2 floxed mice (Chen et al., 2007) with AdipoqCreERT2tg/+ mice (Sassmann et al., 2010), which express Cre recombinase under the regulatory sequences of the adiponectin gene and ER (Figure S2A). Tamoxifen-induced recombination at 6 weeks of age led to adipocyte-specific mitofusin 2 knockout mice (Figures S2B–S2E). Mice receiving tamoxifen showed a strong reduction of mitofusin 2 mRNA levels in epididymal fat (EF; 70%–80%; Figure S2B), subcutaneous fat (SF; 70%–80%; Figure S2C), and BAT (70%–80%; Figure S2D) compared with vehicle-treated mice. Western blot analysis confirmed the lack of expression of mitofusin 2 in epididymal fat, subcutaneous fat, and BAT in AdipoqCreERT2tg/+/mfn2ff mice after tamoxifen treatment (Figure S2E). Tamoxifen treatment did not induce any mitofusin 2 gene ectopic deletion in AdipoqCreERT2 mice outside of the adipose tissue, as revealed by analysis of mitofusin 2 mRNA and protein in anatomical regions such as the prefrontal cortex (PrefC), hypothalamus, liver, and soleus muscle (Figures S2F and S2G). All cohorts of mice used in this study received tamoxifen treatment to avoid any possible confounding effects because of the tamoxifen treatment itself. Therefore, mice carrying the Cre recombinase (AdipoqCreERT2tg/+/mfn2 floxed) are referred to as Ati-mfn2-knockout (KO) and their littermates lacking its expression (AdipoqCreERT2+/+/mfn2 floxed) as controls or Ati-mfn2-control (CT). Prior to receiving the tamoxifen treatment, Ati-mfn2-KO mice and their CT littermates were sorted into groups homogeneous for body weight (Figure S3A). Mice received the SD or HFD for a total of 12 weeks. At the end of the diet treatment, metabolic parameters were analyzed, mice were culled, and organs were collected for further analysis.
Ati-mfn2-KO Mice Show an Obesogenic Phenotype and Altered Food Intake
We analyzed the effect of adipocyte-specific deletion of mitofusin 2 on body composition. Ati-mfn2-KO mice showed increased body weight compared with their CT littermates (Figures 2A and 2B) regardless of diet treatment (Figures 2A and 2B). Strikingly, the increased body weight of Ati-mfn2-KO mice on normal chow was similar to that of CT mice on the HFD (Figures 2A and 2B). Body weight analysis of Ati-mfn2-KO mice over the 12 weeks of diet treatment, expressed as body weight gain (as a percentage), confirmed the obesity-prone phenotype of the Ati-mfn2-KO mice compared with CTs (Figure 2C). We assessed the body composition of Ati-mfn2-KO mice and their CT litter-mates by MRI (Figures 2D and 2E). The higher body weight of the Ati-mfn2-KO mice was found to be due to increased adiposity in both SD- and HFD-fed Ati-mfn2-KO mice (Figures 2D and 2E). Surprisingly, although no differences were present in the lean mass of the HFD-fed Ati-mfn2-KO mice compared with CTs (Figure 2E), we observed increased lean mass in SD-fed Ati-mfn2-KO mice compared with their CT littermates (Figure 2D).
Figure 2. Body Weight, Adipose Tissue Proliferation, and Glucose Homeostasis Are Affected by Adipocyte Deletion of Mitofusin 2.

(A and B) Body weight analysis of Ati-mfn2-CT and Ati-mfn2-KO mice on the SD (A; controls, n = 16; KO, n = 12) and HFD (B; controls, n = 19; KO, n = 15) at 3, 7, and 12 weeks on the respective diets.
(C) Data from (A) and (B) presented as body weight gain (as a percentage) over the 12 weeks of diet treatment.
(D and E) MRI of Ati-mfn2-CT and Ati-mfn2-KO mice on SD (D) and HFD (E) correlated the increased body weight of the Ati-mfn2-KO compared with controls because of increased adiposity (the mice from A and B were used for evaluation of body composition by MRI).
(F–K) Plasma profile of adiponectin (F), leptin (G), and glucose (H) on standard diet, and adiponectin (I), leptin (J), and glucose (K) on high-fat diet of Ati-mfn2-CT (n = 5–6) and Ati-mfn2-KO (n = 6–7) mice.
(L–O) Glucose tolerance test (L and M) and insulin tolerance test (N and O) on Ati-mfn2-CT and Ati-mfn2-KO mice on the SD (controls, n = 5–6; KO, n = 6–8) and HFD (controls, n = 5–6; KO, n = 5–8).
Data are mean ± SEM. Statistics: (A), (B), and (D)–(K), Student’s t test; (E), one-way ANOVA; (L)–(O), cumulative quantification of blood glucose in mice during the respective experiments, derived as area under the curve (AUC) and statistically compared by Student’s t test. *p < 0.05, **p < 0.01, ***p < 0.001. See also Figures S2–S5.
Ati-mfn2-KO mice showed increased levels of daily caloric intake compared with their CT littermates regardless of diet treatment (Figures S3B and S3C). In line with this, gene expression analysis of hypothalamic neuropeptides from HFD-fed Ati-mfn2-KO mice showed decreased levels of the mRNA for expression of the anorexigenic peptide proopiomelanocortin (POMC) (Figure S3D) and increased levels of feeding-promoting neuropeptide Y (NPY) gene mRNA (Figure S3E) compared with CTs. A recent study has shown that deletion of mitofusin 2 in brown adipocytes dampens their thermogenic capacity, leading to increased fat accumulation in BAT (Boutant et al., 2017). In Ati-mfn2-KO mice, mitofusin 2 gene deletion was induced in both WAT and BAT. To evaluate the contribution of mitofusin 2 deletion in BAT to determining the obesogenic phenotype observed in Ati-mfn2-KO mice, we generated a brown adipocyte-specific mitofusin 2 KO mouse line by crossing mitofusin 2 floxed mice with UCP1-CreERT2tg/+ mice (Rosenwald et al., 2013), which express Cre recombinase under the regulatory sequences of the uncoupling protein 1 and ER (referred to as BAT-mfn2-KO). Tamoxifen-induced Mfn2 gene deletion in BAT was induced by the same protocol as applied for Ati-mfn2-KO mice. Seven weeks on the HFD did not induce significantly different body weight gains in BAT-mfn2-KO mice compared with the CT (Figure S3F). No differences were found in food intake (data not shown).
Adipocyte-Specific Deletion of Mitofusin 2 Alters the Expression of Factors Involved in the Regulation of Body Energy Metabolism
Analysis of plasma adiponectin levels showed significant differences between SD-fed Ati-mfn2-KO mice and their CT littermates (Figure 2F). Ati-mfn2-KO mice on the SD showed increased plasma leptin concentration (Figure 2G). SD-fed Ati-mfn2-KO mice showed increased levels of blood glucose compared with CT mice (Figure 2H). When challenged on the HFD, Ati-mfn2-KO mice showed reduced levels of plasma adiponectin (Figure 2I) and significantly increased levels of plasma leptin (Figure 2J) compared with their CT littermates. Similar to the SD-fed mice, Ati-mfn2-KO mice on the HFD showed impaired levels of blood glucose (Figure 2K). Adiponectin is an adipocyte-derived hormone with key insulin-sensitizing functions. Accordingly, SD- and HFD-fed Ati-mfn2-KO mice showed impaired glucose homeostasis during a glucose tolerance test (GTT; Figures 2L and 2M). Intraperitoneal administration of glucose to Ati-mfn2-KO mice resulted in higher levels of blood glucose for the entire time of the assay compared with their CT littermates (Figures 2L and 2M). When mice were analyzed for their insulin sensitivity using an insulin tolerance test (ITT), Ati-mfn2-KO mice on the SD did not show significant differences in insulin sensitivity compared with CTs (Figure 2N). HFD-fed mice showed reduced insulin sensitivity, as revealed by decreased efficiency in blood glucose clearance, compared with their CT littermates (Figure 2O). In line with the insulin resistance profile and the obesogenic phenotype, Ati-mfn2-KO showed higher levels of hepatic triglycerides compared with CTs, regardless of diet treatment (Figure S4).
Ati-mfn2-KO mice displayed an obesogenic phenotype, characterized by increased adiposity and plasma leptin levels, together with increased food intake. To distinguish the causes from the consequences when determining the obesogenic phenotype of Ati-mfn2-KO mice, we induced the mitofusin 2 gene deletion in adipocytes as described previously. Mice were divided into weight-matched groups receiving a 60% HFD for a total of 7 days (Figures S5A and S5B). At the end of the diet treatment, no body weight differences were present within groups (Figure S5B). Analysis of the cumulative food intake through the HFD treatment showed higher caloric intake in Ati-mfn2-KO mice compared with CTs (Figure S5C). In addition, Ati-mfn2-KO mice showed increased levels of plasma leptin (Figure S5D).
Ati-mfn2-KO Mice Have Impaired Energy Homeostasis
Analysis of energy expenditure (EE) performed at the end of the 12 weeks of diet treatment revealed significant reductions in energy expenditure of Ati-mfn2-KO mice compared with CTs (Figures 3A–3D). Next we analyzed the respiratory exchange ratio (RER) and found that Ati-mfn2-KO mice showed an average RER switched toward the lower point of 0.7, regardless of diet treatment, suggesting increased utilization of fatty acids as a source of energy (Figures 3E–3H). Mitochondria play a crucial role in overall cell energy metabolism by providing the source of the key node in the branching pathway of glucose, fatty acid, and amino acid metabolism. We measured the levels of acetyl-coenzyme A (CoA) carboxylase, the limiting enzyme in the conversion of acetyl-CoA to malonyl CoA in adipose tissue. When in its phosphorylated form (P-acetyl-CoA), acetyl-CoA carboxylase is inactive, and removal of the phospho group activates the enzyme. We found decreased levels of phospho-acetyl-CoA carboxylase (Figures S6A and S6B) in Ati-mfn2-KO mice compared with CTs, regardless of diet treatment. The described reduced levels of the inactive form of acetyl-CoA carboxylase (ACC) suggests an increased lipogenesis pathway. Formation of new lipids is made possible by the action of the transcriptionally regulated fatty acid synthase (FAS), which utilizes acetyl- CoA to synthetize palmitic acid, the first fatty acid produced and the precursor to longer-chain fatty acids. Gene expression analysis in the epididymal fat showed that, although no differences were present in FAS mRNA levels between Ati-mfn2-KO mice and their CTs receiving the SD (Figure S6C), we observed its significant increase in HFD-fed Ati-mfn2-KO mice compared with their CTs (Figure S6D).
Figure 3. Energy Homeostasis in Adipocyte-Specific Mitofusin 2 Knockout Mice.

Energy expenditure analysis (A–D) and respiratory exchange ratio (RER) (E–H) measured over 48 h in Ati-mfn2-CT (n = 8) and Ati-mfn2-KO (n = 8) mice on SD and HFD treatments. Data are mean ± SEM. Statistics: Student’s t test. *p < 0.05, **p < 0.01 versus controls. See also Figure S6.
Adipocyte-Specific Mitofusin 2-Deficient Mice Show Altered Mitochondrial Morphology and Decreased Cell Size in WAT
At the end of the 12 weeks of diet treatment, WAT and BAT from Ati-mfn2-KO mice and CTs were isolated and processed for electron microscopy (EM). Ultrastructure analysis of epididymal fat and BAT from SD-fed Ati-mfn2-KO mice did not show significance differences in mitochondrial size compared with CTs (Figures 4A and 4B; Figures S7A and S7B), whereas reduced mitochondrial coverage was found in both white and brown adipocytes from SD-fed Ati-mfn2-KO mice (Figure 4C; Figure S7C). When challenged on the HFD, Ati-mfn2-KO mice revealed a significant reduction in both mitochondrial size and mitochondrial coverage in epididymal fat and BAT compared with CTs (Figures 4D and 4E; Figures S7D and S7E). Systemic comparison of the mitochondrial area performed by normalization of the data by the CT group on the SD confirmed the altered size of mitochondria in Ati-mfn2-KO mice regardless of diet treatment (Figure 4F). We then asked whether mitofusin 2 gene deletion in brown adipocytes affected mitochondrial morphology. Analysis of the mitochondrial shape (scored from 1, perfect circle, to 0, progressively elongated shape) revealed that, regardless of diet treatment, the mitochondrial population in BAT from Ati-mfn2-KO mice showed an increased number of circularly shaped mitochondria in adipocytes compared with CTs (Figures S7F and S7G). Previous studies have highlighted the contact between mitochondria and lipid droplets in fat-oxidizing tissues (Benador et al., 2018; Zhang et al., 2011). Thus, we analyzed the interaction of mitochondria with lipid droplets in BAT. Ati-mfn2-KO mice showed a reduced mitochondrion-lipid droplet contact surface, regardless of diet treatment (Figures S7H and S7I). We also measured the gene expression pattern of key regulators of the BAT-mediated CT of energy metabolism. BAT from SD- and HFD-fed Ati-mfn2-KO mice displayed significant reductions in UCP-1 gene mRNA levels compared with the CT (Figures S7J and S7K), suggesting impaired thermogenic activity of BAT from Ati-mfn2-KO mice. Gene expression analysis of the mitochondrial transcription factor (Tfam) and deiodinase iodothyronine type 2 (Dio2) did not show significant differences between SD- and HFD-fed Ati-mfn2-KO mice compared with CTs (Figures S7J and S7K).
Figure 4. MFN2 Gene Inactivation in Adipose Tissue Leads to Modifications of Mitochondrial Morphology and Overall Adipose Tissue Histology.

(A) Electron microscopy presentation of epididymal fat from Ati-mfn2-KO mice and controls littermates (Ati-mfn2-CT) both on the SD and HFD. Scale bar, 1 μm.
(B–F) Quantification of mitochondria area (in square nanometers; B) and mitochondrial coverage (C) in adipocytes on SD and the same parameters on HFD
(D and E) of Ati-mfn2-KO mice and their controls littermates (Ati-mfn2-KO and controls receiving both the SD and HFD, n = 3).
(F)Relative change of mitochondrial area on HFD compared to SD values (100%) between Ati-mfn2-CT and Ati-mfn2-KO mice (n = 3 in all groups).
(G)Representative H&E staining of epididymal fat from SD- and HFD-fed Ati-mfn2-KO mice and controls. Scale bar, 30 üm.
(H and I) Adipocyte cell population distribution according to their cell area SD (H) and HFD (I) of Ati-mfn2-CT and Ati-mfn2-KO mice (n = 3 in all groups).
(J) Schematic depicting the time points for BrdU treatment and analysis of adipocyte nuclei by immunofluorescence.
(K and L) Quantification of BrdU-positive nuclei in epididymal fat from Ati-mfn2-KO mice and controls receiving either the SD (K) or HFD (L).
(M) Quantification of peroxisome proliferator-activated receptor γ (PPAR-γ) mRNA levels in epididymal fat from HFD-treated mice.
Data are mean ± SEM. In (F), data from (B)–(D) are presented as variation to control mice receiving the SD. In (K) and (L), data are expressed as percentage variation versus the control group. n = 3 mice for each group, 300–500 cells/group. Statistics: (B)–(E) and (K)–(M), Student’sttest; (F), one-way ANOVA; *p < 0.05, **p < 0.01, ***p < 0.001 versus controls. See also Figure S7.
Next we analyzed the morphology of epididymal fat from Ati-mfn2-KO mice. H&E staining and cell size quantification showed that, regardless of diet treatment, the majority of the adipocyte cell population in the epididymal fat from Ati-mfn2-KO mice had a reduced cell area compared with CTs (Figures 4G–4I). Ati-mfn2-KO mice showed reduced adipocyte cell size despite increased adiposity, suggesting that the increased body weight observed in Ati-mfn2-KO mice was a result of adipose tissue hyperplasia rather than adipocyte hypertrophy. To address this question, we next analyzed adipocyte cell proliferation. After inducing mitofusin 2 gene deletion in adipocytes by tamoxifen treatment, Ati-mfn2-KO mice and CTs were divided into their respective diet groups and received bromodeoxyuridine (BrdU; a synthetic nucleoside analog to thymidine) for a total of 1 week (Figure 4J). Mice were sacrificed 3 weeks after BrdU treatment, and the epididymal fat was collected (Figure 4J). Quantification of BrdU-positive adipocytes by immunohistochemistry revealed a significant increase in positive nuclei in Ati-mfn2-KO mice compared with their CTs, regardless of diet treatment (Figures 4K and 4L), providing evidence of increased cellularity in the epididymal fat of Ati-mfn2-KO mice. Peroxisome proliferator-activated receptor γ (PPAR-γ) has been shown to be one of the main regulators of adipogenesis (Rosen et al., 2002)by mediating cell differentiation and lipid accumulation (Wu et al., 1999; Rosen and Spiegelman, 2000). Accordingly, gene expression analysis in the epididymal fat from HFD-fed Ati-mfn2-KO mice showed increased levels of PPAR-γ mRNA (Figure 4M).
PPAR-γ CTs Adipocyte Mitofusin 2 Gene Expression
To study the possible link between mitofusin 2 and PPAR-γ in regulating adipocyte physiology, 6- to 8-week-old BL6 mice received a 60% HFD for 1 week. Then mice were divided into two different groups, receiving either 5 mg/kg GW9662 (a selective PPAR-γ antagonist) or vehicle daily for a total treatment time of 1 week (Figure 5A). Protein expression analysis of epididymal fat from mice receiving GW9662 showed increased levels of mitofusin 2 compared with vehicle-treated mice (Figures 5B and 5C). In addition, mice receiving 5 mg/kg GW9662 showed protection against diet-induced obesity (DIO) body weight gain and reduced adiposity compared with mice receiving vehicle treatment (Figures 5D and 5E).
Figure 5. Pharmacological Blocking of PPAR-γ during HFD Feeding Increases Mitofusin 2 Protein Expression in Epididymal Fat and Prevents Its Pathological Expansion.

(A) Schematic depicting the time points and diet of BL6/N mice receiving vehicle (n = 4) or 5 mg/kg GW9662 (n = 7).
(B and C) Representative western blot (B) of mitofusin 2 and protein expression quantification (C) in epididymal fat from BL6/N mice receiving vehicle or GW9662, respectively.
(D and E) Body weight analysis (D) and quantification of epididymal fat weight (E) from mice receiving vehicle or GW9662.
Data are mean ± SEM. In (B), shown is whole epididymal fat lysate from BL6/N mice receiving vehicle or 5 mg/kg GW9662 treatment, respectively. In (D), mitofusin 2 protein quantification of samples shown in (B) is presented as variation to controls (vehicle-treated mice). Student’s t test, **p < 0.01 versus controls.
DISCUSSION
Our results showed that diminished mitochondrial fusion and mitofusin 2 levels in adipocytes are associated with increasing fat deposition in WAT and BAT. This is supportive of the notion that fusion of mitochondria is associated with glucose utilization as fuel versus diminished fusion enabling the utilization of glucose for lipogenesis. The fact that selective knockdown of mitofusin 2 in adipocytes is able, on its own, to increase fat depots indicates that mitochondrial fusion is important for glucose oxidation. On the other hand, the diminishing ability of adipocyte mitochondria to fuse because of lack of mitofusin 2 enables more effective production of lipid storage in WAT and BAT despite no change in diet composition. In line with this, knocking out mitofusin 2 from adipocytes in adult mice resulted in a systemic metabolic phenotype on the standard chow diet that was similar to that of CT mice on the high fat diet. On the other hand, at the cellular level, knocking out mitofusin 2 from adipocytes decreased cell size while increasing fat mass. This, together with the observation of increased proliferation of adipocytes in response to mitofusin 2 knockdown, suggests that the overall effect of mitofusin 2 on adipose mass may also be related to cell proliferation. This is consistent with a previous demonstration of the ability of mitofusin 2 to suppress proliferation of stem and cancer cells (Chen et al., 2004, 2014; Cheng et al., 2013). Our results are in line with recent evidence from a human study for multiple symmetrical lipomatosis (MSL), in which Rocha et al. (2017) showed the causative link between a biallelic loss-of-function mutation in the mitofusin 2 gene and the upper-body adipose tissue hyperplasia typical of this pathology. Further, ultrastructure analysis of BAT from high-fat-diet-fed adipocyte-mitofusin 2 KO mice showed a drastic reduction in the contact surface between mitochondria and lipid droplets compared with CTs. BAT has a high rate of fatty acid oxidation through which it mediates adaptive non-shivering thermogenesis (Schwer et al., 2006). Our results are supportive of the notion that physical interaction between mitochondria and lipid droplets is necessary for efficient utilization of fatty acids and that mitofusin 2 is a molecular mediator of such an interaction. The contact between mitochondria and lipid droplets would facilitate the transfer of fatty acids from lipid droplets to mitochondria for β-oxidation, avoiding transfer of hydrophobic molecules through the hydrophilic cytosol. Our results suggest that diminished levels of mitofusin 2 expression in adipocytes may ultimately result in reduced transfer of fatty acids from lipid droplets to mitochondria for β-oxidation, favoring their storage. This is in line with previous data showing that interaction between lipid droplets and mitochondria is vital for efficient utilization of fatty acids in thermogenesis (Yu et al., 2015; Zhang et al., 2011; Wikstrom et al., 2014)). Further, our data are consistent with a recent study showing a critical role of mitofusin 2 in mediating BAT thermogenic function (Boutant et al., 2017). Furthermore, our results suggest a possible key role of mitofusin 2 in regulating adipocyte proliferation through suppression of the PPAR-γ and its protective role against pathological expansion of adipose tissue during conditions of excessive energy intake.
STAR★METHODS
Detailed methods are provided in the online version of this paper and include the following:
CONTACT FOR REAGENT AND RESOURCE SHARING
Further information and request for reagents maybe directed to and will be fulfilled by the Lead Contact, Tamas Horvath (tamas.horvath@yale.edu).
EXPERIMENTAL MODEL AND SUBJECT DETAILS
Study participants
Paired samples of subcutaneous (SC) and omental visceral adipose tissue were obtained from 318 individuals (214 women, 104 men). The age ranged from 16 to 93 years and the BMI from 18.9 to 76.1 kg/m2. Adipose tissue donors were further classified into groups of lean (BMI 21-25kg/m2, n = 17), cachectic (BMI < 21kg/m2, n = 6) and overweight/obese (BMI > 25kg/m2, n = 295). All adipose tissue samples were collected during laparoscopic abdominal surgery as described previously (Klöting et al., 2010). Adipose tissue was immediately frozen in liquid nitrogen and stored at −80°C. The study was approved by the Ethics Committee of the University of Leipzig (approval no: 159-12-21052012), and performed in accordance to the declaration of Helsinki. All subjects gave written informed consent before taking part in this study.
Measurement of body composition and metabolic parameters
BMI of patients was calculated by weight (kg) divided by square of height (m). WHR was calculated from measured waist and hip circumference. Computed tomography or MRI scans at level L4/5 were used to calculate abdominal subcutaneous and visceral fat area (cm2) and dual-energy X-ray absorptiometry (DEXA) or bioimpedance analyses (BIA) to measure body fat content (%). In a subgroup, insulin sensitivity was quantified with the glucose infusion rate (GIR) during an euglycemic-hyperinsulinemic clamp as described (Guiu-Jurado et al., 2016; Klöting et al., 2010). All baseline blood samples were collected between 8 and 10 am after an overnight fast. Plasma insulin was measured with an enzyme immunometric assay for the IMMULITE automated analyzer (Diagnostic Products Corporation, Los Angeles, CA, USA). Plasma glucose, HbA1c, HDL-, LDL-cholesterol, free fatty acids, and triglycerides were measured in an automated analyzer (Cobas 8000, Roche Diagnostics, Mannheim, Germany). Serum adiponectin was measured and mean subcutaneous and visceral adipocyte size was determined as previously described (Klöting et al., 2010).
Mouse model
All animal studies followed guidelines issued by Yale University’s Institutional Animal Care and Use Committee (IACUC). All mice used for these studies were on the C57BL/6J background. Mice were randomized based on body weight to achieve similar average weight in different groups. Unless otherwise noted, mice were males 6 weeks of age at the start of the experiments. In this study, epididymal fat refers to perigonadal visceral adipose tissue, subcutaneous fat refers to inguinal subcutaneous adipose tissue and BAT refers to interscapular BAT in mice. To generate adipocyte-specific tamoxifen-induced Mfn2 knock-out mice (Ati-mfn2-ko), AdipoqCreERT2tg/+ mice (Sassmann et al., 2010) were crossed with Mfn2loxP/loxP mice (Chen et al., 2007). Colonies were maintained by breeding AdipoqCreERT2tg/+ -Mfn2loxP/loxP mice with Mfn2loxp/loxp mice. Mice were maintained on a 12:12 hr light-dark cycle. Generally, 6 weeks-old male mice and their CTs received tamoxifen (1mg/mouse, stock solution in 100% ethanol, finally diluted 1:10 in corn oil; tamoxifen from Sigma-Aldrich, T5648; corn oil from Sigma-Aldrich, C8267) once a day by oral gavage for 5 consecutive days. At the end of the tamoxifen treatment, mice were single housed and sorted into their corresponding diet-specific group. Animals were provided with free access to water and standard chow (Harlan Research Laboratories) or high fat diet (45% Kcal fat, Research Diet) for 12 weeks, starting at 7 weeks of age.
METHOD DETAILS
Physiological measurements
Body weights were weekly determined over the 12 weeks of the experimental study. Food intake was measured daily from week 13 to week 14 of age. For Insulin sensitivity tests, mice were injected with Insulin (0.4 IU/kg) i.p. and blood glucose determined at the indicated time points. For the GTTs, D-glucose (2g/kg) was injected intraperitoneally (i.p.) and blood glucose determined at the indicated time points. Both assays were performed at the end of the 12 weeks of feeding study. Mice were fasted for 4 hours. Blood glucose was measured using an automated blood glucose reader Glucometer (OneTouch® Ultra® 2 Glucometer, Lifescan). For BrdU (US Biological, B2850) treatment, BrdU was administered in the drinking water at 0.4 mg ml−1 for one week, starting after completion of the tamoxifen treatment, when mice were 7 week of age. BrdU water was refreshed every two days. At the end of the BrdU treatment, mice were kept for three more weeks in their respective diet groups. Mice were then sacrificed and the organs collected for further analysis.
Body composition and indirect calorimetry
At the end of the 12 weeks of diet treatment, Ati-mfn2-ko and their CTs mice were scanned by using nuclear magnetic resonance imaging (EchoMRI) in order to determine the whole-body composition. Indirect calorimetry was assessed in both standard and high fat diet-fed Ati-mfn2-ko and CT mice. Experimental animals were individually housed in metabolic chambers (TSE systems GmbH), in which water and food intake, locomotor activity and gas exchanges can be monitored. Following 48 h of acclimation, O2 consumption, CO2 production and locomotor activity, together with food and water intake, were measured continually every 15 minutes for a total of 48 h to assess the gas exchange, respiratory quotient, and energy expenditure. Energy expenditure (in kcal/h) data were normalized by body weight.
RNA isolation and real time PCR analysis
RNA from human adipose tissue was extracted by using RNeasy Lipid tissue Mini Kit (QIAGEN, Hilden, Germany). Quantity and integrity of RNA was monitored with NanoVue plus Spectrophotometer (GE Healthcare, Freiburg, Germany). 1μg total RNA from SC and Vis adipose tissue (305 ng RNA from adipocytes and SVF) were reverse-transcribed with standard reagents (Life technologies, Darmstadt, Germany). cDNA was then processed for TaqMan probe-based quantitative real-time polymerase chain reaction (qPCR) using the QuantStudio 6 Flex Real-Time PCR System (Life technologies, Darmstadt, Germany).
Epididymal and BAT were isolated from Ati-mfn2-CT and Ati-mfn2-KO mice at the end of the 12 weeks feeing study (unless specified otherwise). For the gene expression analysis of hypothalamic neuropeptides, the hypothalamus was dissected by placing the brain ventral side up and a 2 mm-thick coronal slide was cut caudal to the optic chiasm. The slide was then dissected laterally up to the hypothalamic sulci and dorsally up to the mammillothalamic tract. Tissues were homogenized in Triazol (Sigma; Cat. Number: 12183-555), the aqueous phase was collected, and RNA isolated by QIAGEN RNA kit (QIAGEN, Cat. Number: 74106). cDNA was synthesized by using High Capacity RNA-to-cDNA kit (Applied Biosystems; Cat. Number: 4390778). Primers for Taqman® Gene Expression Assay were purchased from Applied Biosystems. Real time PCR analysis was carried out with the following primers (gene name: probe code): Mfn2: Mm00500120_m1; UCP-1: Mm01244861_m1; Tfam: Mm00447485_m1; DIO2: Mm00515664_m1; FAS: Mm00662319_m1: POMC: Mm00435874_m1; NPY: Mm00445771_m1. Quantitative real-time PCR was carried out using the Light Cycler 480II Roche. Gene expression was calculated by standard curve method and normalized to the expression of glyceraldehyde 3-phosphate dehydrogenase (GAPDH): Mm99999915_g1 as a housekeeping gene.
Hormone assays
Plasma adiponectin was measured by Mouse adiponectin ELISA kit (Millipore, EZMADP-60K). Leptin was measured by Mouse leptin ELISA kit (Millipore, EZML-82K). Liver triglycerides were measured by Triglyceride Assay Kit (Abcam, ab65336).
Electron microscopy and mitochondrial analysis
CT and Ati-mfn2-ko mice were transcardiacally perfused with 0.9% saline with heparine (10mg/L) followed by fixative solution (paraformaldehyde 4%, gluteraldehyde 0.1%, picric acid 15% in phosphate buffer [PB] 0.1 M [pH = 7.4]). Epididymal and BAT were removed and fixed overnight at 4°C with the same fixative without gluteraldehyde. Samples were washed vigorously with ice-cold PB 0.1 M, and sliced at 50 μm in a vibratome. Slices were put in osmium tetroxide (1%, 15 min) and then dehydrated in an ethanol gradient. Uranyl acetate (1%) was added to 70% ethanol to enhance ultrastructural contrast. Slices were then embedded in Durcupan, cut in an ultra-microtome and collected in grids for posterior analyzes. A Tecnai 12 Biotwin electron microscope was used to visualize the ultrastructure of the samples, and adipocytes were imaged at 48,000 x magnification for posterior offline analyzes. For mitochondria analyzes, random sections of adipocytes were analyzed. Most of these sections contained the nucleus. ImageJ software (ImageJ version 1.51, Yale software library, Yale University) was used to manually outline each individual mitochondrion in the digital images. All samples were checked twice for consistency of mitochondria labeling. We used mitochondria cross-sectional area as a measurement of mitochondria size, and mitochondria aspect ratio (AR) as an index of mitochondria shape. Mitochondria coverage was estimated by dividing the total area of mitochondria (sum of all mitochondria profiles in a given cell) by the cell area. The same images were used for mitochondria-lipid droplet contact surface analysis in the BAT. mitochondria-lipid droplet contact surface was calculated by dividing the total perimeter of mitochondria in a given cell by the total mitochondria/lipid droplet contact surface length. The investigator was blinded to the experimental groups during the entire procedure.
Histology and immunofluorescence
CTs and Ati-mfn2-ko mice were transcardiacally perfused with 0.9% saline/ heparine (10mg/L) followed by fixative solution (paraformaldehyde 4%, gluteraldehyde 0.1%, picric acid 15% in phosphate buffer [PB] 0.1 M [pH = 7.4]). Epididymal and BAT were collected and prepared as described for paraffin-embedding (Berry et al., 2014). Briefly, tissue was fixed with the same fixative used during transcardial perfusion without gluteraldehyde for 48 h at 4°C, then washed with PBS. Samples were then dehydrated in increasing concentrations of ethanol over 6 h, and embedded in paraffin wax. 5 μm sections of paraffin blocks were then deparaffinized and rehydrated. For histological analysis, rehydrated sections were stained with Shandon® Gill® 3 hematoxylin (Thermo Fisher Scientific, cat. num.: 6765010) followed by staining with Shandon® Eosin Y alcoholic (Thermo Fisher Scientific, cat. num.: 6766007). Cell size quantification was performed by analyzing sequential pictures of adipose tissue with ImageJ software (ImageJ version 1.51, Yale software library, Yale University). Cell size quantification was performed on adipocytes in which the nuclei was present. For immunofluorescence, sections were deparaffinized and rehydrated, followed by antigen retrieval in 10 mM sodium citrate, pH 6.0 under pressure in a 2100 Retriever (PickCell Laboratories). Sections were blocked and stained in 5% BSA/PBS. Sections were incubated in primary antibodies including rat anti-BrdU (Abcam no. ab6326, clone no. BU1/75 (ICR1) dilution 1:350) and rabbit anti-Caveolin-1 (Cell Signaling no. 3238, dilution 1:350) overnight at 4°C. Sections were then incubated with secondary antibodies including goat anti-rat-A488 (Jackson Immunoresearch, no. 112-545-167) and goat anti-rabbit rhodamine-X-red (Jackson Immunoresearch, no. 111-295-144), both used at 1:250, for 2 h at room temperature. Slides were mounted with DAPI Fluoromount-G mounting media (Southern Biotech) and imaged by Axioplan 2 Imaging microscope, Zeiss. Several images of each tissue section were acquired, and analyzed for the presence of BrdU and adipocyte nuclei.
Western blotting
Organs were harvested from CTs and Ati-mfn2-KO mice and homogenized on ice in RIPA buffer including 10% glycerol, 1% Triton X-100, 0.1%SDS and 0.5% sodium deoxycholate. protease inhibitors (Complete, EDTA-free protease inhibitor cocktail tablets, Roche, no. 11873580001) and PhosStop phosphatase inhibitors (Roche, no. 04906845001). Lysates were centrifuged at 4°C at 12,000 rpm for 20 min. and the lysate was transferred twice to remove lipids. Quantification of protein was performed using the Pierce BCA (bicinchoninic acid) Protein Assay kit (Thermo Fiscer Scientific, no. 23225). For protein expression analysis, 50 μg protein samples were diluted 1:3 with 4X Laemmli sample buffer (Biorad, cat. num.: 161-0774), β-mercaptoethanol was added to final concentration of 1%. Samples were denatured by heat at 70°C for 10 min. Lysates were run on 7.5% polyacrylamide gels (Mini-Protean TGX precast gels, Biorad, cat. num.: 546-1025) in 1x Tris/glycine/SDS buffer (10x stock solution, Biorad, cat. num.: 161-0732; final concentration 25 mM Tris, 192 mM glycin, 0.1% SDS, pH 8.3). Proteins were transferred to PVDF membrane (Immun-Blot PDVF membrane, Biorad, cat. num.: 162-0177) trough tank transfer in 1x Tris/glycine buffer (Biorad, cat. num.: 161-0734; final concentration 25 mM Tris, 192 mM glycine) in 20% methanol using Biorad Mini-PROTEAN tetra system. For p-ACC/ACC expression study, the Invitrgen nuPAGE analysis system was applied. Membranes were blocked in blocking buffer (tris-buffered saline with 0.1% Tween-20 5% BSA) for 1 hour and then incubated overnight at 4°C with primary antibodies. Rabbit anti-mitofusin2 was purchased from Sigma-Aldrich (no. M6444, used at 1:1,000). Primary antibodies were purchased from Millipore including rabbit anti-Acetyl CoA Carboxylase (no. 05-1098, clone 7D2.2, used at 1:1,000), mouse anti-phospho-Acetyl CoA Carboxylase (Ser79) (no. 05-673, clone BK102, used at 1:1,000), rabbit anti-glyceraldehyde 3-phosphate dehydrogenase (GAPDH) (no. ABS16, used at 1:1,000). Goat antiheat shock protein (HSP) (no. SC-1052, clone nN20, used at 1:1,000) was purchased from Santa Cruz Biotechnology. Antibodies were diluted in tris-buffered saline with 0.1% Tween-20 2% bovine serum albumin (BSA, Sigma, no. A9647). Goat anti-rabbit-HRP secondary antibody and goat anti-mouse-HRP were purchased from Millipore (no. 12-348 and 12-349, respectively) and used at 1:10,000. Rabbit anti-goat-HRP was purchased from Biorad (no. 172-1034) used at 1:10,000. Secondary antibodies were diluted in tris-buffered saline with 0.1% Tween-20. Blots were developed using the Pierce ECL western blotting substrate (Thermo Fiscer Scientific no. 32106). Detection of chemiluminescent signal was performed by exposing the blots to BioExcell autoradiographic films (World Wide Medical Products no. 41101002). Quantification of signal was performed using ImageJ software (National Institute of Health, Bethesda, MD). For experiments in which both phospho-ACC and total ACC were analyzed from the same blot, phospho-ACC was probed first. The blot was then stripped with Thermo Scientific Restore Plus Western Blot Stripping Buffer for 10 min, washed, and incubated with secondary antibody for 30 min. The blot was then developed to check that there was no residual signal from phospho-ACC antibodies. The blot was then washed, blocked for 1 hour in 5% BSA blocking buffer, and incubated with antibody to detect total ACC. Levels of phospho-ACC were normalized to total ACC protein. GAPDH was used as loading CT.
QUANTIFICATION AND STATISTICAL ANALYSIS
All data are represented as means ± SEM and p ≤ 0.05 value was considered significant and is denoted in figures as follows: *, p < 0.05; **, p < 0.01; ***, p < 0.001. Statistical parameters, significance, and sample sizes (N) are reported in the figure legends. Data were analyzed using GraphPad Prism 7 (Yale information technology services) and ImageJ (National Institute of Health, available online). Statistical significance was determined with unpaired two-tailed Student t test. Body weight gain analysis at the end of the diet treatment was performed by analysis of variance (ANOVA) with body weight as a factor for parametric data followed by Tukey multiple comparison test. No statistical methods were used to predetermine sample size.
Supplementary Material
KEY RESOURCES TABLE
| REAGENT or RESOURCE | SOURCE | IDENTIFIER |
|---|---|---|
| Antibodies | ||
| Mfn2 polyclonal antibody | Sigma-Aldrich | Cat# M6444, RRID:AB_477223 |
| HSP 60 (N-20) polyclonal antibody | Santa Crutz biotechnology | Cat# SC-1052, RRID:AB_631683 |
| BrDu monoclonal antibody | Abcam | Cat# ab6326, RRID:AB_305426 |
| ACC monoclonal antibody | Millipore | Cat# 05-1098, RRID:AB_10807015 |
| Phos-ACC polyclonal antibody | Millipore | Cat# 05-673, RRID:AB_309894 |
| GAPDH polyclonal antibody | Millipore | Cat# ABS16, RRID:AB_10806772 |
| Chemicals, Peptides, and Recombinant Proteins | ||
| Tamoxifen | Sigma-Aldrich | T5648 |
| Humilin, regular insulin human injection | Lilly | NDC 0002-8215-01 |
| GW9662 | Cayman Chemicals | 70785 |
| Critical Commercial Assays | ||
| Mouse adiponectin ELISA kit | Millipore | EZMADP-60K |
| Mouse leptin ELISA kit | Millipore | EZML-82K |
| RNeasy MinElute Cleanup Kit | QIAGEN | 74204 |
| Triglycerides Assay kit | Abcam | Ab65336 |
| Experimental Models: Organisms/Strains | ||
| Mfn2loxP | Mutant mouse resource and research center | 026525 |
| AdipoqCreERT2 | Sassmann et al., 2010 | N/A |
| UCP1-CreERT2 | Rosenwald et al., 2013 | N/A |
| Oligonucleotides for qPCR Gene Expression Analysis | ||
| Mfn2 | Applied Biosystems | Mm00500120_m1 |
| UCP-1 | Applied Biosystems | Mm01244861_m1 |
| Tfam | Applied Biosystems | Mm00447485_m1 |
| Dio2 | Applied Biosystems | Mm00515664_m1 |
| FAS | Applied Biosystems | Mm00662319_m1 |
| human Mfn1 | Life Technologies | Hs00966851_m1 |
| human Mfn2 | Life Technologies | Hs00208382_m1 |
| HPRT1 | Life Technologies | Hs01003267_m1 |
| Gapdh | Applied Biosystems | Mm99999915_g1 |
| POMC: | Applied Biosystems | Mm00435874_m1 |
| NPY: | Applied Biosystems | Mm00445771_m1. |
| Software and Algorithms | ||
| Prism 7 | Yale information technology services | N/A |
| ImageJ | National Insistute of Health, available online | N/A |
| Other | ||
| Rodent diet with 45% Kcal fat | Research Diet | D12451 |
| Rodent diet with 60% Kcal fat | Research Diet | D12492 |
Highlights.
Mfn2 is expressed in white adipose tissue of lean mice
Mfn2 diminishes in white adipose tissue of high-fat-diet-fed animals
Mfn2 expression is significantly lower in obese versus leaner human subjects
Knockdown of Mfn2 in adipose tissue of adult mice results in an obese phenotype
ACKNOWLEDGMENTS
This paper was supported by NIH grants AG052005, AG052986, AG051459, and DK111178 (to T.L.H.), DK090489 and DK110147 (to M.R.), and DK089098 and DK102648 (to X.Y.); grant NKFI-126998 from the Hungarian National Research, Development and Innovation Office (to T.L.H.); and Deutsche Forschungsgemeinschaft (DFG) grant SFB1052 “Obesity Mechanisms” (to M.B.).
Footnotes
SUPPLEMENTAL INFORMATION
Supplemental Information can be found with this article online athttps://doi.org/10.1016/j.celrep.2019.02.039.
DECLARATION OF INTERESTS
The authors declare no competing interests.
REFERENCES
- Baltzer C, Tiefenböck SK, and Frei C (2010). Mitochondria in response to nutrients and nutrient-sensitive pathways. Mitochondrion 10, 589–597. [DOI] [PubMed] [Google Scholar]
- Benador IY, Veliova M, Mahdaviani K, Petcherski A, Wikstrom JD, Assali EA, Acin-Perez R, Shum M, Oliveira MF, Cinti S, et al. (2018). Mitochondria bound to lipid droplets have unique bioenergetics, composition, and dynamics that support lipid droplet expansion. Cell Met 27, 869–885. [DOI] [PMC free article] [PubMed] [Google Scholar]
- Benda C (1898). Ueber die Spermatogenese der Vertebraten und höherer Evertebraten. II. Theil: Die Histiogenese der Spermien, Verh. Berl. Physiol. Ges, 393–398. [Google Scholar]
- Bereiter-Hahn J, and Vöth M (1994). Dynamics of mitochondria in living cells: shape changes, dislocations, fusion, and fission of mitochondria. Microsc. Res. Tech 27, 198–219. [DOI] [PubMed] [Google Scholar]
- Berry R, Church CD, Gericke MT, Jeffery E, Colman L, and Rodeheffer MS (2014). Imaging of adipose tissue. Methods Enzymol 537, 47–73. [DOI] [PMC free article] [PubMed] [Google Scholar]
- Boutant M, Kulkarni SS, Joffraud M, Ratajczak J, Valera-Alberni M, Combe R, Zorzano A, and Cantó C (2017). Mfn2 is critical for brown adipose tissue thermogenic function. EMBO J. 36, 1543–1558. [DOI] [PMC free article] [PubMed] [Google Scholar]
- Chen H, Detmer SA, Ewald AJ, Griffin EE, Fraser SE, and Chan DC (2003). Mitofusins Mfn1 and Mfn2 coordinately regulate mitochondrial fusion and are essential for embryonic development. J. Cell Biol 160, 189–200. [DOI] [PMC free article] [PubMed] [Google Scholar]
- Chen KH, Guo X, Ma D, Guo Y, Li Q, Yang D, Li P, Qiu X, Wen S, Xiao RP, and Tang J (2004). Dysregulation of HSG triggers vascular proliferative disorders. Nat. Cell Biol 6, 872–883. [DOI] [PubMed] [Google Scholar]
- Chen H, McCaffery JM, and Chan DC (2007). Mitochondrial fusion protects against neurodegeneration in the cerebellum. Cell 130, 548–562. [DOI] [PubMed] [Google Scholar]
- Chen KH, Dasgupta A, Ding J, Indig FE, Ghosh P, and Longo DL (2014). Role of mitofusin 2 (Mfn2) in controlling cellular proliferation. FASEB J. 28, 382–394. [DOI] [PMC free article] [PubMed] [Google Scholar]
- Cheng X, Zhou D, Wei J, and Lin J (2013). Cell-cycle arrest at G2/M and proliferation inhibition by adenovirus-expressed mitofusin-2 gene in human colorectal cancer cell lines. Neoplasma 60, 620–626. [DOI] [PubMed] [Google Scholar]
- de Brito OM, and Scorrano L (2008). Mitofusin 2 tethers endoplasmic reticulum to mitochondria. Nature 456, 605–610. [DOI] [PubMed] [Google Scholar]
- Dietrich MO, Liu ZW, and Horvath TL (2013). Mitochondrial dynamics controlled by mitofusins regulate Agrp neuronal activity and diet-induced obesity. Cell 155, 188–199. [DOI] [PMC free article] [PubMed] [Google Scholar]
- Eura Y, Ishihara N, Yokota S, and Mihara K (2003). Two mitofusin proteins, mammalian homologues of FZO, with distinct functions are both required for mitochondrial fusion. J. Biochem 134, 333–344. [DOI] [PubMed] [Google Scholar]
- Fealy CE, Mulya A, Lai N, and Kirwan JP (2014). Exercise training decreases activation of the mitochondrial fission protein dynamin-related protein-1 in insulin-resistant human skeletal muscle. J. Appl. Physiol 117, 239–245. [DOI] [PMC free article] [PubMed] [Google Scholar]
- Gilkerson RW, Selker JM, and Capaldi RA (2003). The cristal membrane of mitochondria is the principal site of oxidative phosphorylation. FEBS Lett. 546, 355–358. [DOI] [PubMed] [Google Scholar]
- Gomes LC, Di Benedetto G, and Scorrano L (2011). During autophagy mitochondria elongate, are spared from degradation and sustain cell viability. Nat. Cell Biol 13, 589–598. [DOI] [PMC free article] [PubMed] [Google Scholar]
- Guiu-Jurado E, Unthan M, Böhler N, Kern M, Landgraf K, Dietrich A, Schleinitz D, Ruschke K, Klöting N, Faßhauer M, et al. (2016). Bone morphogenetic protein 2 (BMP2) may contribute to partition of energy storage into visceral and subcutaneous fat depots. Obesity (Silver Spring) 24, 2092–2100. [DOI] [PubMed] [Google Scholar]
- Jheng HF, Tsai PJ, Guo SM, Kuo LH, Chang CS, Su IJ, Chang CR, and Tsai YS (2012). Mitochondrial fission contributes to mitochondrial dysfunction and insulin resistance in skeletal muscle. Mol. Cell. Biol 32, 309–319. [DOI] [PMC free article] [PubMed] [Google Scholar]
- Klöting N, Fasshauer M, Dietrich A, Kovacs P, Schön MR, Kern M, Stumvoll M, and Blüher M (2010). Insulin-sensitive obesity. Am. J. Physiol. Endocrinol. Metab 299, E506–E515. [DOI] [PubMed] [Google Scholar]
- Koning AJ, Lum PY, Williams JM, and Wright R (1993). DiOC6 staining reveals organelle structure and dynamics in living yeast cells. Cell Motil. Cytoskeleton 25, 111–128. [DOI] [PubMed] [Google Scholar]
- Lionetti L, Sica R, Mollica MP, and Putti R (2013). High-lard and high-fish oil diets differ in their effects on insulin resistance development, mitochondrial morphology and dynamic behaviour in rat skeletal muscle. Food Nutr. Sci 4, 105–112. [Google Scholar]
- Lionetti L, Mollica MP, Donizzetti I, Gifuni G, Sica R, Pignalosa A, Cavaliere G, Gaita M, De Filippo C, Zorzano A, and Putti R (2014). High-lard and high-fish-oil diets differ in their effects on function and dynamic behaviour of rat hepatic mitochondria. PLoS One 9, e92753. [DOI] [PMC free article] [PubMed] [Google Scholar]
- Mandl J, Mészáros T, Bánhegyi G, Hunyady L, and Csala M (2009). Endoplasmic reticulum: nutrient sensor in physiology and pathology. Trends Endocrinol. Metab 20, 194–201. [DOI] [PubMed] [Google Scholar]
- Mitchell P (1961). Coupling of phosphorylation to electron and hydrogen transfer by a chemi-osmotic type of mechanism. Nature 191, 144–148. [DOI] [PubMed] [Google Scholar]
- Parton LE, Ye CP, Coppari R, Enriori PJ, Choi B, Zhang CY, Xu C, Vianna CR, Balthasar N, Lee CE, et al. (2007). Glucose sensing by POMC neurons regulates glucose homeostasis and isimpaired in obesity. Nature 449, 228–232. [DOI] [PubMed] [Google Scholar]
- Rambold AS, Kostelecky B, Elia N, and Lippincott-Schwartz J (2011). Tubular network formation protects mitochondria from autophagosomal degradation during nutrient starvation. Proc. Natl. Acad. Sci. USA 108, 10190–10195. [DOI] [PMC free article] [PubMed] [Google Scholar]
- Rocha N, Bulger DA, Frontini A, Titheradge H, Gribsholt SB, Knox R, Page M, Harris J, Payne F, Adams C, et al. (2017). Human biallelic MFN2 mutations induce mitochondrial dysfunction, upper body adipose hyperplasia, and suppression of leptin expression. eLife 6, 6. [DOI] [PMC free article] [PubMed] [Google Scholar]
- Rojo M, Legros F, Chateau D, and Lombés A (2002). Membrane topology and mitochondrial targeting of mitofusins, ubiquitous mammalian homologs of the transmembrane GTPase Fzo. J. Cell Sci 115, 1663–1674. [DOI] [PubMed] [Google Scholar]
- Rosen ED, and Spiegelman BM (2000). Molecular regulation of adipogenesis. Annu. Rev. Cell Dev. Biol 16, 145–171. [DOI] [PubMed] [Google Scholar]
- Rosen ED, Hsu CH, Wang X, Sakai S, Freeman MW, Gonzalez FJ, and Spiegelman BM (2002). C/EBPalpha induces adipogenesis through PPARgamma: a unified pathway. Genes Dev. 16, 22–26. [DOI] [PMC free article] [PubMed] [Google Scholar]
- Rosenwald M, Perdikari A, Rülicke T, and Wolfrum C (2013). Bi-directional interconversion of brite and white adipocytes. Nat. Cell Biol 15, 659–667. [DOI] [PubMed] [Google Scholar]
- Santel A, and Fuller MT (2001). Control of mitochondrial morphology by a human mitofusin. J. Cell Sci 114, 867–874. [DOI] [PubMed] [Google Scholar]
- Santel A, Frank S, Gaume B, Herrler M, Youle RJ, and Fuller MT (2003). Mitofusin-1 protein is a generally expressed mediator of mitochondrial fusion in mammalian cells. J. Cell Sci 116, 2763–2774. [DOI] [PubMed] [Google Scholar]
- Sassmann A, Offermanns S, and Wettschureck N (2010). Tamoxifen-inducible Cre-mediated recombination in adipocytes. Genesis 48, 618–625. [DOI] [PubMed] [Google Scholar]
- Sawyer SL, Cheuk-Him Ng A, Innes AM, Wagner JD, Dyment DA, Tetreault M, Majewski J, Boycott KM, Screaton RA, and Nicholson G; Care4Rare Canada Consortium (2015). Homozygous mutations in MFN2 cause multiple symmetric lipomatosis associated with neuropathy. Hum. Mol. Genet 24, 5109–5114. [DOI] [PubMed] [Google Scholar]
- Schneeberger M, Dietrich MO, Sebastián D, Imbernón M, Castaño C, Garcia A, Esteban Y, Gonzalez-Franquesa A, Rodríguez IC, Bortolozzi A, et al. (2013). Mitofusin 2 in POMC neurons connects ER stress with leptin resistance and energy imbalance. Cell 155, 172–187. [DOI] [PMC free article] [PubMed] [Google Scholar]
- Schwer B, Bunkenborg J, Verdin RO, Andersen JS, and Verdin E (2006). Reversible lysine acetylation controls the activity of the mitochondrial enzyme acetyl-CoA synthetase 2. Proc. Natl. Acad. Sci. USA 103, 10224–10229. [DOI] [PMC free article] [PubMed] [Google Scholar]
- Wikstrom JD, Katzman SM, Mohamed H, Twig G, Graf SA, Heart E, Molina AJ, Corkey BE, deVargas LM, Danial NN, et al. (2007). beta-Cell mitochondria exhibit membrane potential heterogeneity that can be altered by stimulatory or toxic fuel levels. Diabetes 56, 2569–2578. [DOI] [PubMed] [Google Scholar]
- Wikstrom JD, Mahdaviani K, Liesa M, Sereda SB, Si Y, Las G, Twig G, Petrovic N, Zingaretti C, Graham A, et al. (2014). Hormone-induced mitochondrial fission is utilized by brown adipocytes as an amplification pathway for energy expenditure. EMBO J. 33, 418–436. [DOI] [PMC free article] [PubMed] [Google Scholar]
- Wu Z, Rosen ED, Brun R, Hauser S, Adelmant G, Troy AE, McKeon C, Darlington GJ, and Spiegelman BM (1999). Cross-regulation of C/EBP alpha and PPAR gamma controls the transcriptional pathway of adipogenesis and insulin sensitivity. Mol. Cell 3, 151–158. [DOI] [PubMed] [Google Scholar]
- Youle RJ, and van der Bliek AM (2012). Mitochondrial fission, fusion, and stress. Science 337, 1062–1065. [DOI] [PMC free article] [PubMed] [Google Scholar]
- Yu J, Zhang S, Cui L, Wang W, Na H, Zhu X, Li L, Xu G, Yang F, Christian M, and Liu P (2015). Lipid droplet remodeling and interaction with mitochondria in mouse brown adipose tissue during cold treatment. Biochim. Biophys. Acta 1853, 918–928. [DOI] [PubMed] [Google Scholar]
- Zhang H, Wang Y, Li J, Yu J, Pu J, Li L, Zhang H, Zhang S, Peng G, Yang F, and Liu P (2011). Proteome of skeletal muscle lipid droplet reveals association with mitochondria and apolipoprotein a-I. J. Proteome Res 10, 4757–4768. [DOI] [PubMed] [Google Scholar]
Associated Data
This section collects any data citations, data availability statements, or supplementary materials included in this article.