

Abstract
Objective:
To determine whether amyloid imaging with the positron emission tomography (PET) agent Pittsburgh compound B (PiB) can detect vascular β-amyloid (Aβ) in the essentially pure form of cerebral amyloid angiopathy associated with the Dutch-type hereditary cerebral amyloid angiopathy (D-CAA) mutation.
Methods:
PiB retention in a cortical composite of frontal, lateral, and retrosplenial regions (FLR) was measured by PiB-PET in 19 D-CAA mutation carriers (M+; 13 without neurologic symptoms, 6 with prior lobar intracerebral hemorrhage) and 17 mutation noncarriers (M−). Progression of PiB retention was analyzed in a subset of 18 serially imaged individuals (10 asymptomatic M+, 8 M−). We also analyzed associations between PiB retention and cerebrospinal fluid (CSF) Aβ concentrations in 17 M+ and 11 M− participants who underwent lumbar puncture and compared the findings to PiB-PET and CSF Ap in 37 autosomal dominant Alzheimer disease (ADAD) mutation carriers.
Results:
D-CAA M+ showed greater age-dependent FLR PiB retention (p < 0.001) than M−, and serially imaged asymptomatic M+ demonstrated greater longitudinal increases (p = 0.004). Among M+, greater FLR PiB retention associated with reduced CSF concentrations of Aβ40 (r = −0.55, p = 0.021) but not Aβ42 (r = 0.01, p = 0.991). Despite comparably low CSF Aβ40 and Aβ42, PiB retention was substantially less in D-CAA than ADAD (p < 0.001).
Interpretation:
Increased PiB retention in D-CAA and correlation with reduced CSF Aβ40 suggest this compound labels vascular amyloid, although to a lesser degree than amyloid deposits in ADAD. Progression in PiB signal over time suggests amyloid PET as a potential biomarker in trials of candidate agents for this untreatable cause of hemorrhagic stroke.
Growing evidence indicates that the amyloid ligands used for positron emission tomographic (PET) imaging, such as Pittsburgh compound B (PiB), detect not only the fibrillar β-amyloid (Aβ) in the senile plaques of Alzheimer disease (AD), but also the cerebrovascular Aβ deposits that characterize cerebral amyloid angiopathy (CAA). Nondemented individuals diagnosed with CAA demonstrate elevated global PiB signal in an occipital-predominant pattern1–3 as well as a tendency for greater focal PiB signal at the sites of current and future CAA-related hemorrhagic lesions.4,5 These data (along with studies of other amyloid imaging agents such as florbetapir6) suggest potential applications of amyloid-PET for detecting the presence and severity of sporadic CAA.
In AD, amyloid imaging of asymptomatic carriers of disease-associated mutations has implicated Aβ accumulation as an early step in the disease’s pathogenesis. PiB-PET in carriers of the early onset autosomal dominant AD (ADAD) mutations shows the onset of aberrant cerebral amyloid accumulation approximately 15 years before the expected age of AD symptom onset, parallel to reductions in cerebrospinal fluid (CSF) concentration of the longer Aβ42 amyloid species.7 These elevations in PiB-PET signal are associated with cognitive decline, even in asymptomatic carriers.8 The studies of early amyloid deposition in ADAD have been used as the basis for treatment trials aimed at early intervention.9
Hereditary autosomal dominant forms of CAA, in particular the most common form of Dutch-type hereditary CAA (D-CAA; also referred to in publications as hereditary cerebral hemorrhage with amyloidosis-Dutch type, HCHWA-D),10 offer the possibility of similar investigations of the early steps in the pathogenesis of CAA. D-CAA (like most other hereditary CAA syndromes11) is caused by an amino acid substitution within the Aβ peptide itself rather than in amyloid precursor protein (APP) Aβ-flanking regions and is characterized by severe CAA and a paucity of mature or neuritic parenchymal amyloid plaques, particularly in younger patients.12 Prior studies have implicated CSF reduction in both the Aβ40 and Aβ42 species13 and reduced cerebrovascular reactivity to visual stimulation14 as markers of presymptomatic D-CAA. Amyloid PET imaging has not yet been evaluated as a potential marker of presymptomatic or symptomatic D-CAA, however. If PiB-PET can detect CAA progression in presymptomatic D-CAA, it might serve as a biomarker for early intervention trials in this currently unpreventable disease.
Patients and Methods
Participants
Participants were drawn from 2 branches of the pedigree of families carrying the APP E693Q D-CAA mutation. One cohort of families (Cohort 1) was enrolled at the Leiden University Medical Center, the Netherlands as part of the Early Diagnosis of Amyloid Angiopathy Network (EDAN).14,15 A second branch of these families (Cohort 2) was enrolled by the Edith Cowan University in Perth, Western Australia as part of the Dominantly Inherited Alzheimer Network (DIAN).7 Participants were defined as symptomatic if they had previously experienced symptomatic intracerebral hemorrhage. Mutation status was confirmed in all participants by DNA testing.
Cohort 1 consisted of 9 mutation carriers (M+, 3 asymptomatic, 6 symptomatic) and 9 similar-aged mutation-negative (M−) controls drawn from the same families, friends, or spouses. Two individuals were excluded from Cohort 1: a mutation carrier with extensive infarcts and gross tissue loss that precluded measurement of PiB-PET signal, and an older (age = 62 years) mutation noncarrier who showed evidence of sporadic late onset preclinical AD and was therefore deemed an inappropriate control. Cohort 2 consisted of 10 M+ individuals (all asymptomatic), and 8 similar-aged M− controls from the same families. Mean age and sex was 46.6 ± 10.2 years, 8 females (F)/9 males (M) for the combined 17 M− controls, 45.4 ± 5.2 years, 10F/3M for the 13 asymptomatic M+, and 55.3 ± 1.8 years (age of first intracerebral hemorrhage = 49.0 ± 4.1 years), 4F/2M for the 6 symptomatic M+. We also performed comparison to a separate group of individuals (Cohort 3) carrying ADAD mutations drawn from the DIAN cohorts enrolled at Washington University and Massachusetts General Hospital. This cohort consisted of 37 asymptomatic ADAD mutation carriers (17 with mutations of the PSEN1 gene, 16 the PSEN2 gene, and 4 the APP gene, mean age and sex = 33.0 ± 8.7 years, 14F/23M, mean years to expected symptom onset = −14.6 ± 8.0) and 15 symptomatic ADAD mutation carriers (10 PSEN1, 2 PSEN2, 3 APP, mean age and sex = 48.7 ± 7.0, 6F/9M, mean years since symptom onset = 2.7 ± 5.2). Estimated years to expected symptom onset were determined as described.7
All study protocols were approved by human study ethics boards at Leiden University Medical Center, Edith Cowan University (Ramsay Health Care WA|SA Human Research Ethics Committee, previously known as Hollywood Private Hospital Human Research Ethics Committee), Washington University, and Massachusetts General Hospital. All participants provided written informed consent.
PiB-PET Imaging
All participants were assessed for fibrillar Aβ burden with PiB-PET imaging. PiB-PET imaging was performed as previously described for Cohort 116 using a Gemini TF 64 PET-CT (Philips Medical Systems, Cleveland, OH) and as previously described for Cohorts 2 and 37,17 using a GE Discovery PET/CT 710 (GE Healthcare, Chicago, IL). Briefly, data were attenuation corrected, scatter corrected, and decay corrected. Data were collected 50 to 70 minutes postinjection, and measurements were made as standardized uptake value ratio (SUVr) using a cerebellar gray matter reference region. As an additional sensitivity analysis, SUVr was also calculated using brainstem as the reference region. Postacquisition processing utilized a FreeSurfer (FS)-based processing stream where PiB-PET images were aligned to FS-processed T1–magnetic resonance images and measurements were made in regions of interest (ROIs) defined by the Desikan–Killany atlas,18 including partial volume correction with the geometric transform matrix approach19 as implemented in FS 6.20 ROIs containing gross structural damage from prior intracerebral hemorrhage were treated as missing to avoid biasing the PiB-PET analysis. We specified the aggregate ROI consisting of frontal, lateral temporal/parietal, and retrosplenial cortex (FLR; Fig 1A) as the primary ROI for analysis based on previous publications demonstrating increased PiB retention in this ROI in AD21–23 and sporadic CAA.1
Figure 1:

Brain regions of interest (ROIs) for Pittsburgh compound B (PiB) positron emission tomography analysis. (A) A composite frontolateral temporal/parietal–retrosplenial ROI was prespecified as the primary ROI for comparing carriers (M+) and noncarriers (M−) of the mutation for Dutch-type hereditary cerebral amyloid angiopathy. (B) Secondary analysis comparing PiB retention in individual ROIs showed a similar pattern of increased retention in M+ versus M−. Color coding indicates t statistics for the age-by-mutation interaction status; all colored values indicate p < 0.05.
Participants from Cohort 2 also had longitudinal PiB-PET imaging. Of the 10 Cohort 2 M+ individuals, 6 had 2 longitudinal PiB-PET scans, 2 had 3 scans, 1 had 4 scans, and 1 had 5 scans; of the 8 Cohort 2 M− individuals, 5 had 2 PiB-PET scans, 2 had 3 scans, and 1 had 4 scans. The mean interscan follow-up interval for all longitudinal PiB-PET scans was 1.6 ± 0.8 years, and mean total duration between first and last longitudinal scan was 2.7 ± 1.2 years. Longitudinal results on individual participants are displayed as least-square fits of the 2 to 5 PiB-PET scans per person to avoid the possibility of identifying individual D-CAA mutation carriers.
CSF Assay
Research lumbar puncture for CSF analysis was performed within 3 days of PiB-PET in 9 Cohort 1 M+ (3 asymptomatic, 6 symptomatic), 8 Cohort 2 M+ (all asymptomatic), 11 M− controls, and all 37 Cohort 3 ADAD mutation carriers. CSF was collected in Cohorts 1 to 3 as previously described7,13,24,25 using Quincke or Sprotte 22G–24G spinal needles. Cohort 1 samples were aliquoted into polypropylene tubes and stored at −80° C until analysis at Radboud University. Cohort 2 and 3 samples were flash-frozen on dry ice in polypropylene tubes, shipped to the DIAN Biomarker Core, thawed on wet ice, aliquoted into polypropylene aliquot tubes, and stored at −80° C until analysis. CSF Aβ40 and Aβ42 protein levels for Cohorts 1 to 3 were determined by Innotest enzyme-linked immunosorbent assay (Fujirebio, Malverne, PA) using previously published protocols.7,13,24,25
PiB Staining of Brain Tissue Sections
Fresh-frozen brain tissue (frontal cortex) from 1 D-CAA patient and 1 patient with advanced sporadic AD and CAA pathology was cut into serial 5μm-thick sections and mounted on coated glass slides (SuperFrost Plus; VWR, Radnor, PA). Sections were air-dried, fixed for 30 minutes (4% formalin, 0.1% triton), and incubated for 2 hours in blocking buffer (4% milk in 0.25% Tween 20, phosphate-buffered saline pH 7.4 [PBS-T]). Anti-Aβ antibody 4G8 (1/1,000 dilution in blocking buffer) was incubated overnight at 4° C. After 3 washes in PBS-T, secondary donkey antimouse Alexa Fluor 594 in 4% milk PBS was incubated for 1 hour at room temperature. Native PiB (6OH-BTA1; purchased from HuiChem [Shanghai, China] and resuspended in dimethylsulfoxide at 50mM) was diluted in 50% ethanol PBS to concentrations of 10, 1, and 0.1 μM. Sections were incubated for 1 hour at room temperature in PiB dilutions and rinsed twice in PBS before mounting with Aqua Poly mount. Pictures were taken with a Leica (Wetzlar, Germany) AF 6000 LX fluorescent microscope.
Analytical Strategy and Statistical Methods
PiB retention was analyzed with standard linear models for age-by-mutation status interaction for the analysis of M+ versus M− (based on prior studies demonstrating age as a good proxy marker of disease progression in mutation carriers15) and for group differences between asymptomatic versus symptomatic M+ and group differences between D-CAA and ADAD mutation carriers. Linear mixed effects models (MATLAB [MathWorks, Natick, MA] R2018b fitlme tool, default options) were used to evaluate longitudinal rate of amyloid accumulation in M− versus M+ D-CAA individuals with serial PiB-PET amyloid imaging (mutation × time as fixed effect, individual subject as random effect). We analyzed the relationships between CSF measures of AD pathology and PiB-PET measures of amyloid pathology using Pearson correlation coefficient (r).
To avoid the possibility of identifying individual D-CAA or ADAD study participants, age labels were omitted from figures displaying individual participants.
Results
PiB-PET in Asymptomatic and Symptomatic Carriers of the E693Q Hereditary CAA Mutation
We analyzed PiB retention in the predefined FLR cortical composite region of interest (see Fig 1A) in Dutch hereditary CAA M+ and M− as a function of increasing age, using the age-by-mutation interaction effect as primary marker of association. FLR PiB retention increased with age in both M+ and M (Fig 2A), with significantly greater increase with age in M+ versus M− (t36 = 4.34, p < 0.001 for the age-by-mutation interaction). Post hoc t tests comparing asymptomatic M+ to M− and symptomatic M+ (see Fig 2B, TABLE) showed that asymptomatic M+ individuals had intermediate levels of FLR PiB-PET signal that was greater than M− (t28 = 2.56, p = 0.016) and less than symptomatic M+ (t17 = 3.89, p = 0.001). Similar results were obtained in sensitivity analyses using brainstem rather than cerebellum as SUVr reference region (data not shown).
Figure 2:

Pittsburgh compound B (PiB) retention in frontolateral temporal/parietal-retrosplenial (FLR) region of interest of carriers of the Dutch-type hereditary cerebral amyloid angiopathy mutation. (A) Analysis of PiB retention according to age of participant showed an age-versus-mutation status difference between asymptomatic and symptomatic mutation carriers (aM+ and sM+) versus noncarriers (M−; p < 0.001). Age labels are omitted to avoid identifying individual study participants; tick-marks indicate 5-year increments. (B) Post hoc comparison of the 3 subgroups showed greater PiB retention in aM+ than M− (p = 0.016) and lower PiB retention than sM+ (p = 0.001). Lines in the box-and-whiskers plot indicate the median, highest, and lowest quartiles, and range of the data. SUVr = standardized uptake value ratio.
Table.
Pittsburgh Compound B Retention and Cerebrospinal Fluid β-Amyloid Peptide Concentration by Mutation Status
| PiB FLR SUVr | n | CSF Aβ40 | n | CSF Aβ42 | n | |
|---|---|---|---|---|---|---|
| D-CAA M− | 0.94 ± 0.09 | 17 | 8,991 ± 3,607 | 11 | 651 ± 170 | 11 |
| D-CAA M+ asymptomatic | 1.05 ±0.13 | 13 | 4,780 ± 1,976 | 11 | 317 ± 125 | 11 |
| D-CAA M+ symptomatic | 1.31 ± 0.15 | 6 | 1,422 ± 304 | 6 | 301 ± 72 | 6 |
| ADAD M− | 0.94 ± 0.09 | 50 | 9,007 ± 3,980 | 45 | 789 ± 307 | 46 |
| ADAD M+ asymptomatic | 1.55 ± 0.87 | 37 | 8,893 ± 4,377 | 37 | 704 ± 371 | 37 |
| ADAD M+ asymptomatic, eYO ≤ – 15 years | 1.11 ± 0.36 | 20 | 8,018 ± 3,232 | 20 | 814 ± 101 | 20 |
| ADAD M+ asymptomatic, eYO > – 15 years | 2.07 ± 1.01 | 17 | 9,923 ± 5,350 | 17 | 534 ± 294 | 17 |
| ADAD M+ symptomatic | 3.12 ± 1.15 | 15 | 8,071 ± 2,171 | 14 | 386 ± 178 | 14 |
ADAD = autosomal dominant Alzheimer disease; CSF Aβ40, CSF Aβ42 = cerebrospinal fluid concentrations of β-amyloid peptide 40, 42, presented as mean ± standard deviation (ng/l); D-CAA = Dutch-type hereditary cerebral amyloid angiopathy; eYO = estimated years from expected symptom onset; M−, = mutation noncarriers; M+ = mutation carriers; PiB FLR SUVr = Pittsburgh Compound B retention in the frontolateral temporal/parietal–retrosplenial region of interest, presented as mean ± standard deviation.
A secondary analysis was performed to determine whether individual regions show preferential PiB retention in M+ relative to M−. A map of all individual ROIs demonstrating age-by-mutation interaction terms with p < 0.05 is shown in Figure 1B. Notably, these individual ROIs substantially overlapped with the composite FLR mask (see Fig 1A; Dice coefficient of overlap = 0.82), suggesting that the predefined FLR composite used in our primary analyses was representative of regional patterns of amyloid deposition in D-CAA. PiB retention did not demonstrate occipital predominance, consistent with previous analyses of the distribution of cerebral microbleeds and hemorrhages in D-CAA.26
We assessed changes over time in FLR PiB retention in serially imaged M− and asymptomatic M+ individuals from Cohort 2 (Fig 3). The longitudinal data were analyzed for time-by-mutation interaction using a linear mixed effects model with subject as a random factor. The results demonstrated increased accumulation of amyloid over time in asymptomatic M+ relative to M− (time-by-mutation interaction t43 = 3.03, p = 0.004).
Figure 3:

Longitudinal accumulation of Pittsburgh compound B (PiB) in serially imaged asymptomatic carriers of the Dutch-type cerebral amyloid angiopathy mutation. Ten asymptomatic mutation carriers (M+) and 8 noncarriers (M−) underwent serial PiB imaging with mean interscan interval 2.7 years. (A) Individual participant results are shown as least-square fits of 2 to 5 longitudinal PiB positron emission tomography scans per person (see Patients and Methods), and age labels are omitted to avoid identifying individual study participants; tick-marks indicate 5-year increments. (B) Longitudinal mixed effects model of the mutation-by-time interaction demonstrates greater rate of PiB accumulation in the frontolateral temporal/parietal–retrosplenial (FLR) region of interest in M+ versus M− (p = 0.004). SUVr = standardized uptake value ratio.
Relation between PiB-PET and CSF Amyloid
Reductions in CSF Aβ have previously been identified as markers of D-CAA (both Aβ40 and Aβ42)13 and ADAD (primarily Aβ42).25 Among D-CAA M+ with available CSF and PiB-PET (n = 17), we observed that greater FLR PiB retention was associated with reduced CSF Aβ40 concentration (Fig 4A, 1), but not with CSF Aβ42 (see Fig 4B). The correlation coefficient with FLR PiB SUVr was r = −0.55 (p = 0.021) for Aβ40, r = 0.01 (p = 0.991) for Aβ42, and r = 0.60 (p = 0.012) for Aβ42/40 ratio. Including mutation noncarriers as well as carriers in the analysis, FLR PiB SUVr was associated with reduced CSF Aβ42 (r = −0.47, p = 0.016) as well as Aβ40 (r = −0.72, p < 0.001).
Figure 4:

Association between cerebrospinal fluid (CSF) concentration of β-amyloid peptide (Aβ) and Pittsburgh compound B (PiB) retention among carriers of the Dutch-type cerebral amyloid angiopathy mutation. CSF samples and PiB positron emission tomography scans were available for 17 mutation carriers (11 asymptomatic, 6 symptomatic). PiB retention in the frontolateral temporal/parietal–retrosplenial (FLR) region of interest correlated with CSF Aβ40 (r = −0.55, p = 0.021) but not Aβ42 (r = 0.01, p = 0.991). CSF concentrations are given as nanograms per liter. aM+ = asymptomatic mutation carriers; sM+ = symptomatic mutation carriers; SUVr = standardized uptake value ratio.
We compared mean PiB-PET labeling and CSF Aβ concentrations in D-CAA M+ to those obtained in carriers of ADAD mutations using linear regression models controlling for age as a covariate (Fig 5, 1). ADAD carriers had substantially higher FLR PiB SUVr than D-CAA carriers (t68 = 6.95, p < 0.001). In contrast, D-CAA carriers had lower CSF Aβ40 than ADAD carriers (t65 = 4.96, p < 0.001) and nonsignificantly lower CSF Aβ42 (t65 = 1.62, p = 0.11).
Figure 5:
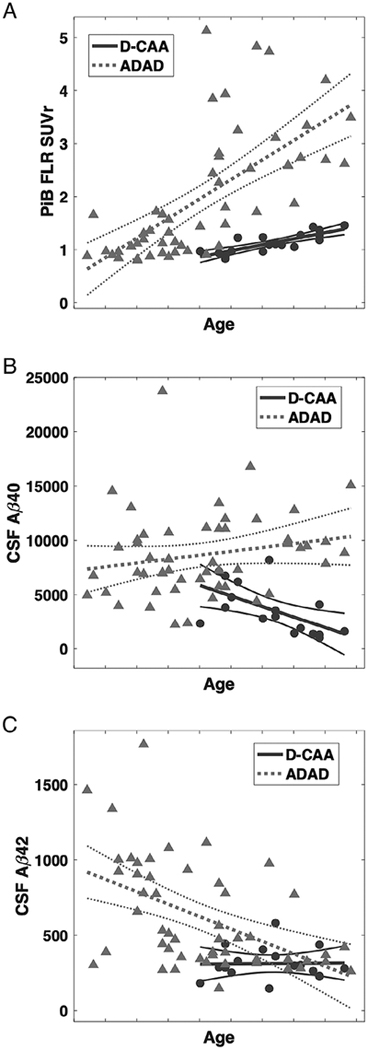
Pittsburgh compound B (PiB) retention and cerebrospinal fluid (CSF) concentration of β-amyloid (Aβ) peptide in autosomal dominant Alzheimer disease (ADAD) versus Dutch-type cerebral amyloid angiopathy (D-CAA). (A) PiB retention in the frontolateral temporal/parietal–retrosplenial (FLR) region of interest was greater in 37 carriers of ADAD mutations versus 19 carriers of D-CAA mutations (p < 0.001). (B, C) The concentration of CSF Aβ40 was reduced in D-CAA versus ADAD controlling for age (B; p < 0.001), and the concentration of CSF Aβ42 was nonsignificantly lower in D-CAA versus ADAD (C; p = 0.11). Among D-CAA mutation carriers, CSF Aβ40 (r = −0.59, p = 0.012) but not Aβ42 (r = 0.02, p = 0.94) decreased with higher age, whereas among ADAD mutation carriers CSF Aβ42 (r = −0.50, p < 0.001) but not Aβ40 (r = 0.20, p = 0.16) decreased with age. CSF concentrations are given as nanograms per liter. Age labels on all panels are omitted to avoid identifying individual study participants; tick-marks indicate 5-year increments. SUVr = standardized uptake value ratio.
PiB Staining in Tissue Sections
Because of the relatively low level of PiB retention in D-CAA M+ individuals, we tested the affinity of PiB for vascular amyloid in tissue sections from a postmortem D-CAA brain and a brain with sporadic AD and CAA pathology. Native PiB at a concentration of 10μM labeled amyloid-positive vessels in the D-CAA case to a similar extent as in the sporadic AD/CAA case (Fig 6). Staining for parenchymal plaque amyloid in the D-CAA brain, by either PiB or the anti-Aβ antibody 4G8, was negligible relative to that in sporadic AD/CAA. Preliminary analyses suggested that lower concentrations (0.1–1μM) of PiB detected amyloid-laden vessels in D-CAA less well than in AD/CAA (data not shown).
Figure 6:

Pittsburgh compound B (PiB) labeling of amyloid in brain tissue. Sections from postmortem brains from individuals with Dutch-type cerebral amyloid angiopathy (D-CAA; 53-year-old woman with large right parieto-occipital hemorrhage, severe CAA pathology) or sporadic Alzheimer disease plus cerebral amyloid angiopathy (sAD-CAA; 69-year-old woman with advanced dementia, severe AD and CAA pathology) were stained using fluorescent PiB (left) at a concentration of 10μM or the anti–β-amyloid (Aβ) antibody 4G8 (center) as described in Patients and Methods.
Discussion
We found that carriers of the D-CAA mutation demonstrate age-dependent increases in PiB-PET signal. Elevated PiB-PET signal was detected in presymptomatic carriers without either hemorrhagic stroke or detectable cognitive impairment15 as well as symptomatic carriers, indicating that amyloid deposition occurs early in the pathogenesis of CAA, as has also been observed in presymptomatic AD.7 Previous studies of presymptomatic D-CAA carriers have suggested reduced CSF Aβ40 and Aβ4213 and impaired cerebrovascular reactivity to visual stimulation14 as the earliest markers of the disease process, followed by some magnetic resonance imaging (MRI) evidence of clinically silent white matter lesions and microinfarcts and few or no silent hemorrhagic lesions such as microbleeds or cortical superficial siderosis.15 The current results indicate that increased PiB retention can be detected in presymptomatic M+ at an age (mean = 46.6 years old) when structural MRI markers are absent or first appearing.15
Although elevated, the magnitude of PiB retention in D-CAA was modest compared to ADAD (see Fig 5A) and to previous reports of preclinical sporadic AD21,27 or sporadic CAA.1,2 The basis for the lower magnitude of PiB retention in D-CAA relative to ADAD is unclear. One possibility is that D-CAA may entail lower total amyloid burden than ADAD. We note equal or greater reductions in CSF Aβ in D-CAA than ADAD (see Fig 5B, C), however, suggesting that the burden of amyloid deposition in D-CAA and ADAD may be comparable. Another possibility is that the FLR ROI used for these analyses optimally detects the spatial pattern of amyloid deposition in ADAD rather than D-CAA, but this explanation is not consistent with the high overlap between the FLR ROI and pattern of PiB retention in the D-CAA carriers (see Fig 1). Perhaps the likeliest explanation for the modest PiB signal in D-CAA is that the form of Aβ deposited in D-CAA, driven by a glutamine-for-glutamate substitution at Aβ position 22 and characterized by a high proportion of Aβ40 compared to Aβ42,28,29 may be labeled in vivo by PiB less efficiently than the native Aβ peptide with Aβ42 predominance in hereditary and sporadic AD. In vitro staining of postmortem brain indicated binding of PiB to Dutch-type Aβ deposits (see Fig 6), although possibly reduced affinity at lower PiB concentrations, an observation that will require confirmation in larger numbers of D-CAA brains. Molecular modeling studies of Dutch mutation–derived Aβ fibrils did not suggest reduced affinity for PiB relative to wild-type fibrils.30
The correlation of increasing PiB retention to reduced CSF Aβ40 but not Aβ42 in D-CAA contrasts with the correlations with CSF Aβ42 but not Aβ40 in ADAD,25 presumably reflecting the predominance of Aβ40 deposition in D-CAA.28,29 This pattern of correlation with Aβ40 rather than Aβ42 also supports the interpretation that the PiB signal in D-CAA primarily represents vascular rather than plaque Aβ.
The current data add further support to the idea that amyloid PET visualizes fibrillar Aβ in vessels as well as in senile plaques. The evidence from previous studies indicating PiB-PET visualization of CAA has been somewhat indirect, given possible contributions from accompanying AD pathology in patients diagnosed with sporadic CAA. Elevated PiB retention in nondemented CAA patients,1–3 for example, might be driven by accompanying senile plaques rather than CAA itself. Stronger evidence for a direct link to CAA came from studies showing spatial colocalization between PiB and current and future sites of CAA-related hemorrhage4,5 as well as the correlation between PiB burden and white matter lesions in CAA (but not AD).31 The current data provide perhaps the most direct evidence for specific in vivo PiB labeling of vascular amyloid, as D-CAA is characterized by little senile plaque pathology,12 particularly at the younger ages sampled among presymptomatic M+. A single previous report of an early symptomatic carrier of another hereditary CAA mutation, the Iowa asparagine-for-aspartate Aβ position 23 substitution, found selective occipital elevation in PiB-PET signal.32
The results here should be interpreted in the context of the study’s limitations. A potential weakness in our study design is the pooling of PiB-PET results across 2 sites (Leiden, the Netherlands and Perth, Australia), where the 2 largest branches of D-CAA families are centered. To harmonize data across these sites, PiB-PET analysis was performed by a single processing stream, a similar approach to that used in pooling across DIAN study sites.7 It is also notable that the pooled families are part of the same extended Dutch kindred, carrying the same APP mutation and similar overall genetic background and therefore presumably more genetically homogeneous than the range of mutation types enrolled in DIAN. All longitudinal PiB-PET scans were performed using the same scanner at baseline and follow-up to minimize potential interscanner variation. Finally, we note that the analysis of PiB retention in M+ benefited from the relatively young age (and accordingly low amyloid burdens) in the M− reference sample. Another potential limitation is that PiB retention was quantified using an SUVr tissue reference approach (like most studies of this agent) rather than an arterial reference approach, as full dynamic data with arterial sampling were not available for all subjects. Although SUVr in the 50- to 70-minute range for PiB has been found in AD to have high correlations with more quantitative methods,33 it remains possible that changes in blood–brain barrier permeability34 might elevate PiB retention. Direct comparison of PiB-PET and CSF Aβ results between D-CAA and ADAD mutation carriers is difficult, as the concept of estimated year of onset used to facilitate comparisons across different ADAD mutations7 is not well defined for D-CAA. We note that reduced PiB FLR SUVr as well as reduced CSF Aβ40 concentrations in D-CAA relative to ADAD carriers is present at essentially all ages (see Fig 5A, B), however, supporting the robustness of these comparisons to differences in disease stage.
Despite the substantially lower PiB-PET signal detected in these D-CAA mutation carriers relative to ADAD or sporadic CAA, the current data suggest that PiB-PET can detect both presence (see Fig 2) and progression (see Fig 3) of vascular Aβ deposition in presymptomatic as well as symptomatic individuals. This observation raises the possibility of applying PiB-PET as an outcome marker for potential future early intervention trials aimed at reducing Aβ accumulation in at-risk individuals. Given the close links between amyloid burden and CAA-related brain injury,4,5,31 trials of amyloid-lowering treatments are particularly attractive candidates for modifying this currently untreatable disorder.
Acknowledgment
This work was supported by the National Institute of Neurologic Diseases and Stroke (R01NS070834) and the Dominantly Inherited Alzheimer’s Network (UF1AG032438), which is funded by the National Institute on Aging, the German Center for Neurodegenerative Diseases, and the Raul Carrea Institute for Neurological Research, with partial support from the Research and Development Grants for Dementia from the Japan Agency for Medical Research and Development and the Korea Health Technology R&D Project through the Korea Health Industry Development Institute.
We thank E. McDade for advice on maintaining confidentiality and blinding to mutation status of D-CAA and ADAD study participants. We acknowledge the altruism of the participants and their families and contributions of the EDAN and DIAN research and support staff at each of the participating sites.
Footnotes
Potential Conflicts of Interest
Nothing to report.
References
- 1.Johnson KA, Gregas M, Becker JA, et al. Imaging of amyloid burden and distribution in cerebral amyloid angiopathy. Ann Neurol 2007; 62:229–234. [DOI] [PubMed] [Google Scholar]
- 2.Ly JV, Donnan GA, Villemagne VL, et al. 11C-PIB binding is increased in patients with cerebral amyloid angiopathy-related hemorrhage. Neurology 2010;74:487–493. [DOI] [PubMed] [Google Scholar]
- 3.Charidimou A, Farid K, Baron JC. Amyloid-PET in sporadic cerebral amyloid angiopathy: a diagnostic accuracy meta-analysis. Neurology 2017;89:1490–1498. [DOI] [PubMed] [Google Scholar]
- 4.Dierksen GA, Skehan ME, Khan MA, et al. Spatial relation between microbleeds and amyloid deposits in amyloid angiopathy. Ann Neurol 2010;68:545–548. [DOI] [PMC free article] [PubMed] [Google Scholar]
- 5.Gurol ME, Dierksen G, Betensky R, et al. Predicting sites of new hemorrhage with amyloid imaging in cerebral amyloid angiopathy. Neurology 2012;79:320–326. [DOI] [PMC free article] [PubMed] [Google Scholar]
- 6.Gurol ME, Becker JA, Fotiadis P, et al. Florbetapir-PET to diagnose cerebral amyloid angiopathy: a prospective study. Neurology 2016; 87:2043–2049. [DOI] [PMC free article] [PubMed] [Google Scholar]
- 7.Bateman RJ, Xiong C, Benzinger TL, et al. Clinical and biomarker changes in dominantly inherited Alzheimer’s disease. N Engl J Med 2012;367:795–804. [DOI] [PMC free article] [PubMed] [Google Scholar]
- 8.Wang F, Gordon BA, Ryman DC, et al. Cerebral amyloidosis associated with cognitive decline in autosomal dominant Alzheimer disease. Neurology 2015;85:790–798. [DOI] [PMC free article] [PubMed] [Google Scholar]
- 9.Bateman RJ, Benzinger TL, Berry S, et al. The DIAN-TU Next Generation Alzheimer’s prevention trial: Adaptive design and disease progression model. Alzheimers Dement 2017;13:8–19. [DOI] [PMC free article] [PubMed] [Google Scholar]
- 10.Wermer MJH, Greenberg SM. The growing clinical spectrum of cerebral amyloid angiopathy. Curr Opin Neurol 2018;31:28–35. [DOI] [PubMed] [Google Scholar]
- 11.Zhang-Nunes SX, Maat-Schieman ML, van Duinen SG, et al. The cerebral beta-amyloid angiopathies: hereditary and sporadic. Brain Pathol 2006;16:30–39. [DOI] [PMC free article] [PubMed] [Google Scholar]
- 12.Maat-Schieman ML, Radder CM, van Duinen SG, et al. Hereditary cerebral hemorrhage with amyloidosis (Dutch): a model for congophilic plaque formation without neurofibrillary pathology. Acta Neuropathol 1994;88:371–378. [DOI] [PubMed] [Google Scholar]
- 13.van Etten ES, Verbeek MM, van der Grond J, et al. beta-Amyloid in CSF: biomarker for preclinical cerebral amyloid angiopathy. Neurology 2017;88:169–176. [DOI] [PMC free article] [PubMed] [Google Scholar]
- 14.van Opstal AM, van Rooden S, van Harten T, et al. Cerebrovascular function in presymptomatic and symptomatic individuals with hereditary cerebral amyloid angiopathy: a case-control study. Lancet Neurol 2017;16:115–122. [DOI] [PMC free article] [PubMed] [Google Scholar]
- 15.van Rooden S, van Opstal AM, Labadie G, et al. Early magnetic resonance imaging and cognitive markers of hereditary cerebral amyloid angiopathy. Stroke 2016;47:3041–3044. [DOI] [PMC free article] [PubMed] [Google Scholar]
- 16.Zwan MD, Ossenkoppele R, Tolboom N, et al. Comparison of simplified parametric methods for visual interpretation of 11C-Pittsburgh compound-B PET images. J Nucl Med 2014;55:1305–1307. [DOI] [PubMed] [Google Scholar]
- 17.Benzinger TL, Blazey T, Jack CR Jr, et al. Regional variability of imaging biomarkers in autosomal dominant Alzheimer’s disease. Proc Natl Acad Sci U S A 2013;110:E4502–E4509. [DOI] [PMC free article] [PubMed] [Google Scholar]
- 18.Desikan RS, Segonne F, Fischl B, et al. An automated labeling system for subdividing the human cerebral cortex on MRI scans into gyral based regions of interest. Neuroimage 2006;31:968–980. [DOI] [PubMed] [Google Scholar]
- 19.Rousset OG, Ma Y, Evans AC. Correction for partial volume effects in PET: principle and validation. J Nucl Med 1998;39:904–911. [PubMed] [Google Scholar]
- 20.Greve DN, Salat DH, Bowen SL, et al. Different partial volume correction methods lead to different conclusions: an (18)F-FDG-PET study of aging. Neuroimage 2016;132:334–343. [DOI] [PMC free article] [PubMed] [Google Scholar]
- 21.Mormino EC, Betensky RA, Hedden T, et al. Synergistic effect of beta-amyloid and neurodegeneration on cognitive decline in clinically normal individuals. JAMA Neurol 2014;71:1379–1385. [DOI] [PMC free article] [PubMed] [Google Scholar]
- 22.Johnson KA, Schultz A, Betensky RA, et al. Tau positron emission tomographic imaging in aging and early Alzheimer disease. Ann Neurol 2016;79:110–119. [DOI] [PMC free article] [PubMed] [Google Scholar]
- 23.Chhatwal JP, Schultz AP, Marshall GA, et al. Temporal T807 binding correlates with CSF tau and phospho-tau in normal elderly. Neurology 2016;87:920–926. [DOI] [PMC free article] [PubMed] [Google Scholar]
- 24.Verbeek MM, Kremer BP, Rikkert MO, et al. Cerebrospinal fluid amyloid beta(40) is decreased in cerebral amyloid angiopathy. Ann Neurol 2009;66:245–249. [DOI] [PMC free article] [PubMed] [Google Scholar]
- 25.Fagan AM, Xiong C, Jasielec MS, et al. Longitudinal change in CSF biomarkers in autosomal-dominant Alzheimer’s disease. Sci Transl Med 2014;6:226ra230. [DOI] [PMC free article] [PubMed] [Google Scholar]
- 26.van Rooden S, van der Grond J, van den Boom R, et al. Descriptive analysis of the Boston criteria applied to a Dutch-type cerebral amyloid angiopathy population. Stroke 2009;40:3022–3027. [DOI] [PubMed] [Google Scholar]
- 27.Mormino EC, Betensky RA, Hedden T, et al. Amyloid and APOE epsilon4 interact to influence short-term decline in preclinical Alzheimer disease. Neurology 2014;82:1760–1767. [DOI] [PMC free article] [PubMed] [Google Scholar]
- 28.Castano EM, Prelli F, Soto C, et al. The length of amyloid-beta in hereditary cerebral hemorrhage with amyloidosis, Dutch type. Implications for the role of amyloid-beta 1–42 in Alzheimer’s disease. J Biol Chem 1996;271:32185–32191. [DOI] [PubMed] [Google Scholar]
- 29.Nishitsuji K, Tomiyama T, Ishibashi K, et al. Cerebral vascular accumulation of Dutch-type Abeta42, but not wild-type Abeta42, in hereditary cerebral hemorrhage with amyloidosis, Dutch type. J Neurosci Res 2007;85:2917–2923. [DOI] [PubMed] [Google Scholar]
- 30.Balamurugan K, Murugan NA, Langstrom B, et al. Effect of Alzheimer familial chromosomal mutations on the amyloid fibril interaction with different PET tracers: insight from molecular modeling studies. ACS Chem Neurosci 2017;8:2655–2666. [DOI] [PubMed] [Google Scholar]
- 31.Gurol ME, Viswanathan A, Gidicsin C, et al. Cerebral amyloid angiopathy burden associated with leukoaraiosis: a positron emission tomography/magnetic resonance imaging study. Ann Neurol 2013;73:529–536. [DOI] [PMC free article] [PubMed] [Google Scholar]
- 32.Greenberg SM, Grabowski T, Gurol ME, et al. Detection of isolated cerebrovascular beta-amyloid with Pittsburgh compound B. Ann Neurol 2008;64:587–591. [DOI] [PMC free article] [PubMed] [Google Scholar]
- 33.McNamee RL, Yee SH, Price JC, et al. Consideration of optimal time window for Pittsburgh compound B PET summed uptake measurements. J Nucl Med 2009;50:348–355. [DOI] [PMC free article] [PubMed] [Google Scholar]
- 34.Folkersma H, Boellaard R, Vandertop WP, et al. Reference tissue models and blood-brain barrier disruption: lessons from (R)-[11C] PK11195 in traumatic brain injury. J Nucl Med 2009;50:1975–1979. [DOI] [PubMed] [Google Scholar]