

Abstract
Folate-dependent one-carbon (C1) metabolism is compartmentalized in the mitochondria and cytosol and is a source of critical metabolites for proliferating tumors. Mitochondrial C1 metabolism including serine hydroxymethyltransferase 2 (SHMT2) generates glycine for de novo purine nucleotide and glutathione biosynthesis and is an important source of NADPH, ATP, and formate, which affords C1 units as 10-formyl-tetrahydrofolate and 5,10-methylene-tetrahydrofolate for nucleotide biosynthesis in the cytosol. We previously discovered novel first-in-class multitargeted pyrrolo[3,2-d]pyrimidine inhibitors of SHMT2 and de novo purine biosynthesis at glycinamide ribonucleotide formyltransferase and 5-aminoimidazole-4-carboxamide ribonucleotide formyltransferase with potent in vitro and in vivo antitumor efficacy toward pancreatic adenocarcinoma cells. In this report, we extend our findings to an expanded panel of pancreatic cancer models. We used our lead analog AGF347 [(4-(4-(2-amino-4-oxo-3,4-dihydro-5H-pyrrolo[3,2-d]pyrimidin-5-yl)butyl)-2-fluorobenzoyl)-l-glutamic acid] to characterize pharmacodynamic determinants of antitumor efficacy for this series and demonstrated plasma membrane transport into the cytosol, uptake from cytosol into mitochondria, and metabolism to AGF347 polyglutamates in both cytosol and mitochondria. Antitumor effects of AGF347 downstream of SHMT2 and purine biosynthesis included suppression of mammalian target of rapamycin signaling, and glutathione depletion with increased levels of reactive oxygen species. Our results provide important insights into the cellular pharmacology of novel pyrrolo[3,2-d]pyrimidine inhibitors as antitumor compounds and establish AGF347 as a unique agent for potential clinical application for pancreatic cancer, as well as other malignancies.
SIGNIFICANCE STATEMENT
This study establishes the antitumor efficacies of novel inhibitors of serine hydroxymethyltransferase 2 and of cytosolic targets toward a panel of clinically relevant pancreatic cancer cells and demonstrates the important roles of plasma membrane transport, mitochondrial accumulation, and metabolism to polyglutamates of the lead compound AGF347 to drug activity. We also establish that loss of serine catabolism and purine biosynthesis resulting from AGF347 treatment impacts mammalian target of rapamycin signaling, glutathione pools, and reactive oxygen species, contributing to antitumor efficacy.
Introduction
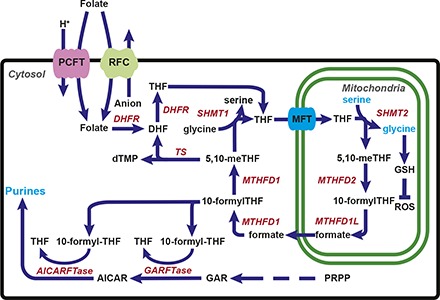
The malignant phenotype depends on reprogramming cellular metabolism, including the one-carbon (C1) metabolic pathway (Hanahan and Weinberg, 2011; Ducker and Rabinowitz, 2017; Newman and Maddocks, 2017). C1 metabolism is compartmentalized in the cytosol and mitochondria (Fig. 1) and generates amino acids and nucleotides essential for cell proliferation and tumor progression (Tibbetts and Appling, 2010; Yang and Vousden, 2016; Ducker and Rabinowitz, 2017). C1 pathways depend on tetrahydrofolate (THF) cofactors that mediate transfer of C1 units. In mammalian cells, folates are acquired from exogenous sources and are transported into cells by the reduced folate carrier (RFC) and the proton-coupled folate transporter (PCFT) (Fig. 1), and by folate receptors (not depicted) (Matherly et al., 2007; Zhao et al., 2011). Once internalized, folates are translocated from the cytosol into mitochondria by the mitochondrial folate transporter (MFT) (SLC25A32) (McCarthy et al., 2004). In both the cytosol and mitochondria, folates are polyglutamylated by folylpoly-γ-glutamate synthetase (FPGS), and these polyglutamyl metabolites do not exchange between compartments (Lawrence et al., 2014). Polyglutamylation of folates confers increased rates of C1 transfer, and polyglutamyl folate forms show enhanced cellular retention over monoglutamyl folates (Shane, 1989).
Fig. 1.

C1 metabolism is compartmentalized in the cytosol and the mitochondria. Folates (and folate analogs) enter the cell through plasma membrane folate transporters including PCFT and RFC. Folates then enter the mitochondria by MFT (SLC25A32). Serine catabolism occurs in the mitochondria beginning with SHMT2 to generate glycine and formate. Glycine is used for synthesis of proteins, purines, and GSH, whereas formate is critical for downstream cytosolic C1 metabolism following formation of 10-formyl-THF. 10-Formyl-THF serves as a C1 donor for the steps catalyzed by GARFTase and AICARFTase in de novo purine nucleotide biosynthesis. Formate is also converted to 5,10-methylene (me) THF by 5,10-me-THF dehydrogenase 1 (MTHFD1), which is the cofactor for thymidylate synthase (TS). Arrows indicate the net flux of C1 metabolism, but most reactions in the serine/glycine cycle are reversible. Also shown is the SHMT1 reaction in cytosol, which generates serine from glycine and 5,10-me-THF, and the inactivation of ROS by GSH. DHFR, dihydrofolate reductase; PRPP, phosphoribosyl pyrophosphate.
C1 metabolic enzymes in the mitochondria include serine hydroxymethyltransferase 2 (SHMT2), 5,10-methylene THF dehydrogenase 2 (MTHFD2), and 10-formyl THF synthetase (reverse) (MTHFD1L) (Fig. 1). The serine catabolic pathway is nearly universally activated in cancer, with SHMT2 and MTHFD2 among the most differentially expressed metabolic genes in all human cancers (Jain et al., 2012; Nilsson et al., 2014). The pathway for serine catabolism and glycine synthesis occurs in the mitochondria, and the 3-carbon of serine is the major C1 donor for de novo biosynthesis of purines and thymidylate in the cytosol (Tibbetts and Appling, 2010; Yang and Vousden, 2016; Ducker and Rabinowitz, 2017). Synthesis of 10-formyl THF from mitochondrial formate and THF in the cytosol stabilizes cytosolic THF from degradation (Zheng et al., 2018). The mitochondrial C1 pathway also generates critical reducing equivalents [as NAD(P)H] to sustain redox balance in hypoxic tumors (Ye et al., 2014; Zhang et al., 2016a) and is an important source of ATP (Meiser et al., 2016). Genetic deletion of SHMT2 in cultured cells results in defective mitochondrial respiration due to impaired synthesis of respiratory chain proteins (Minton et al., 2018; Morscher et al., 2018), accompanied by increased glycolytic flux (Morscher et al., 2018). Cells deficient in mitochondrial C1 metabolism or MFT transport are glycine auxotrophs (McCarthy et al., 2004; Tibbetts and Appling, 2010; Kim et al., 2015; Ducker and Rabinowitz, 2017).
Evidence of a critical role for serine catabolism as a source of C1 units for cytosolic anabolism (Yang and Vousden, 2016; Ducker and Rabinowitz, 2017; Newman and Maddocks, 2017), combined with the unique demands of tumor cells for glycine and redox balance versus those of normal tissues (Jain et al., 2012; Ducker et al., 2016; Loayza-Puch et al., 2016), suggests that SHMT2 could be an independent prognostic factor and potential therapeutic target for cancer. Elevated SHMT2 is associated with poor prognoses of breast cancers and gliomas (Zhang et al., 2016b; Wang et al., 2017; Wu et al., 2017). In patients who underwent surgical resection of pancreatic adenocarcinomas, elevated SHMT2 was associated with poor overall survival and disease-free survival compared with patients with low SHMT2 (Noguchi et al., 2018).
We recently described novel 5-substituted pyrrolo[3,2-d]pyrimidine compounds, AGF291 [(4-(3-(2-amino-4-oxo-3,4-dihydro-5H-pyrrolo[3,2-d]pyrimidin-5-yl)propyl)benzoyl)-l-glutamic acid], AGF320 [(5-(5-(2-amino-4-oxo-3,4-dihydro-5H-pyrrolo[3,2-d]pyrimidin-5-yl)pentyl)thiophene-2-carbonyl)-l-glutamic acid], and AGF347 [(4-(4-(2-amino-4-oxo-3,4-dihydro-5H-pyrrolo[3,2-d]pyrimidin-5-yl)butyl)-2-fluorobenzoyl)-l-glutamic acid], as anticancer agents (Dekhne et al., 2019). Direct inhibition of SHMT2 in mitochondria and targeting of SHMT1 and de novo purine biosynthesis [at glycinamide ribonucleotide and 5-aminoimidazole-4-carboxamide (AICA) ribonucleotide formyltransferases (GARFTase and AICARFTase, respectively)] in cytosol were established in colon and lung cancer cells, as well as in pancreatic cancer (PaC) models. For early and late-stage MIA PaCa-2 (an aggressive PaC model) tumor xenograft models treated with AGF347, impressive in vivo antitumor efficacy with curative potential was accompanied by minimal toxicity, and enzyme targets were validated by metabolomics analysis and in vitro enzyme assays (Dekhne et al., 2019).
In this report, we explore the cellular pharmacodynamics of this series with a focus on AGF347 (Fig. 2). Our studies establish broad-spectrum in vitro antitumor efficacy against a panel of PaC models and demonstrate the critical roles of plasma membrane transport, mitochondrial accumulation, and conversion to polyglutamates in both cytosol and mitochondria in effecting antitumor activity. We also explore mechanisms of antitumor activity of pyrrolo[3,2-d]pyrimidine compounds, including the impact of loss of serine catabolism and purine biosynthesis resulting from AGF347 (Dekhne et al., 2019) on AMP-activated protein kinase (AMPK) activation and mammalian target of rapamycin (mTOR) signaling, mitochondrial respiration, and glutathione pools and levels of reactive oxygen species (ROS). Collectively, our results underscore the unique pharmacology of this novel series and establish AGF347 as a promising new therapeutic for cancer.
Fig. 2.

In vitro antitumor efficacy and identification of targeted pathways and enzymes by AGF347 in BxPC-3 and HPAC tumor cells by proliferation assays and adenosine/glycine rescue. Dose-response growth inhibition curves are shown for AGF347 (structure shown) without additions, or in the presence of adenosine (60 μM) and/or glycine (130 μM). The results are mean ± S.D. values for three biologic replicates.
Materials and Methods
Chemicals.
[3H]AGF347 (9 Ci/mmol), [3H]methotrexate (MTX; 10–30 Ci/mmol), and [3H]folic acid (32.9 Ci/mmol) were purchased from Moravek Biochemicals (Brea, CA). Leucovorin [(6R,S) 5-formyl tetrahydrofolate] and MTX were provided by the Drug Development Branch, National Cancer Institute (Bethesda, MD). Pemetrexed (PMX) was purchased from LC Laboratories (Woburn, MA). Gemcitabine was obtained from Pfizer (New York, NY). PT523 [Nα-(4-amino-4-deoxypteroyl)-Nδ-hemiphthaloyl-l-ornithine] was a gift from Dr. Andre Rosowsky (Dana-Farber Cancer Institute, Boston, MA). Other chemicals were obtained from commercial sources in the highest available purities. AGF94 (N-((5-[(2-amino-4-oxo-4,7-dihydro-3H-pyrrolo[2,3-d]pyrimidin-6-yl)propyl]thiophen-2-yl)carbonyl)-l-glutamic acid), AGF291, AGF320, and AGF347 were synthesized as previously described (Wang et al., 2011; Dekhne et al., 2019).
Cell Culture.
The HCT116 cell lines, including the SHMT1 and SHMT2 knockout (KO) cells (Ducker et al., 2016; Ducker and Rabinowitz, 2017), were generously provided by G. S. Ducker and J. D. Rabinowitz (Princeton University). KB cells were purchased from the American Type Culture Collection (Manassas, VA) and were cultured as previously described (Deng et al., 2008). PaC cell lines, including AsPC-1 (Chen et al., 1982), BxPC-3 (Tan et al., 1986), CFPAC-1 (Schoumacher et al., 1990), HPAC (Gower et al., 1994), and MIA PaCa-2 (Wu et al., 1977), were generously provided by Dr. Yubin Ge (Karmanos Cancer Institute, Detroit, MI). Human pancreatic normal epithelial (HPNE) cells (Lee et al., 2003) were a gift from M. Oulette (University of Nebraska Medical Center, Omaha, NE). Cell lines were validated by short tandem repeat analysis by Genetica DNA Laboratories (Burlington, NC). MTXRIIOuaR2-4 (i.e., R2) CHO cells were provided by Dr. Wayne Flintoff (University of Western Ontario) (Flintoff et al., 1976). From the parental R2 cell line, human RFC and PCFT were individually transfected to generate the isogenic CHO cell lines designated PC43-10 (RFC) and R2/PCFT4 (PCFT) (Wong et al., 1995; Deng et al., 2008, 2009). glyB cells were a generous gift from Dr. Larry Chasin (Columbia University). glyBTII cells were derived from glyB cells by electroporation with human MFT cDNAs in a pcDNA3.1(−)/myc-His6 A–tagged vector. Transfectants were selected with G418, and colonies were isolated and expanded for screening by Western blot and real-time reverse-transcription polymerase chain reaction (RT-PCR) analyses.
The PaC cell lines were cultured in RPMI 1640 medium, supplemented with 10% FBS (Sigma-Aldrich, St. Louis, MO) and 1% penicillin/streptomycin (Life Technologies) at 37°C with 5% CO2. The R1-11 RFC- and PCFT-null HeLa subline was a gift from Dr. I. David Goldman (Albert Einstein School of Medicine, Bronx, NY) (Zhao et al., 2009). The R1-11 RFC2 cell line was developed in our laboratory by transfection of R1-11 cells with the pZeoSV2-RFC vector and clonal selection (Wang et al., 2015). For nontransport experiments, the aforementioned cell lines were maintained in folate-free RPMI 1640 (FFRPMI) supplemented with 10% dialyzed FBS (Sigma-Aldrich), 1% penicillin/streptomycin solution, 2 mM l-glutamine, and 25 nM leucovorin. Cell proliferation assays in CHO cells were performed as described in complete FFRPMI without glycine. Glycine/adenosine rescue experiments were performed in BxPC-3 and HPAC cells without additions, or in the presence of adenosine (60 µM) and/or glycine (130 µM) (Dekhne et al., 2019).
Cell lines were tested for Mycoplasma by PCR using a Mycoplasma testing kit (Venor GeM Mycoplasma Detection Kit; Sigma-Aldrich) (Test date: February 2018) and frozen in aliquots in liquid nitrogen. As warranted, cells were treated (Plasmocin; InvivoGen) and retested for Mycoplasma. To avoid cell line “drift,” fresh cultures were reconstituted no less than every month from the original freezer stocks (aforementioned).
For transport experiments (see Membrane Transport Assays), cells were maintained in RPMI 1640 supplemented with 10% FBS, 1% penicillin/streptomycin solution, and 2 mM l-glutamine. R1-11 cells were maintained under continuous selection with 500 µM MTX and 1 mg/ml G418. R1-11 RFC2 cells were maintained under continuous selection with 100 µg/ml Zeocin (Thermo Fisher). CHO cell lines were maintained in α-minimal essential medium (αMEM) supplemented with 10% bovine calf serum, 1% penicillin/streptomycin solution, and 2 mM l-glutamine in a humidified atmosphere at 37°C in the presence of 5% CO2 and 95% air. Additionally, the transfected CHO cell lines (i.e., R2/PCFT4 and glyBTII) were maintained under continuous selection with 1 mg/ml G418.
Generation of MIA PaCa-2 MFT Knockdown Cell Line.
MIA PaCa-2 cells were seeded (2 × 10⁵ cells/well) in 24-well plates containing 1 ml of culture medium (i.e., FFRPMI supplemented with 10% dialyzed FBS, 1% penicillin/streptomycin, 2 mM l-glutamine, and 25 nM leucovorin). Cells were treated with 4 μg/ml polybrene and 105 transducing units of MISSION Lentiviral particles (Sigma-Aldrich) containing short hairpin RNA targeting MFT (TRCN0000043091). After 24 hours, the medium was replaced with fresh complete FFRPMI medium including 2 μg/ml puromycin as a selection marker. Once cells were confluent, the cells were harvested, passaged three to four times, and then assayed by RT-PCR for MFT knockdown relative to nontargeted control (NTC) particle-transduced MIA PaCa-2 cells. To isolate single clones, cells were plated in 100-mm dishes (200 cells/dish) in the presence of 2 μg/ml puromycin. Colonies were isolated, expanded (in RPMI 1640 supplemented with 10% FBS, 1% penicillin/streptomycin, and 2 mM l-glutamine), and clonal cultures were assayed for MFT knockdown via RT-PCR.
Gel Electrophoresis and Western Blots.
glyB and glyBTII cells were cultured in two T150 flasks each and harvested when cells were ∼90% confluent. Mitochondrial fractions were isolated (see Subcellular Fractionation Assays of Cytosolic and Mitochondrial AGF347) and assayed for protein concentrations (Lowry et al., 1951). Equal amounts of protein (36 µg) from each sample were electrophoresed on 10% polyacrylamide gels with SDS (Laemmli, 1970) and transferred to polyvinylidene difluoride membranes (Thermo Fisher) (Matsudaira, 1987). To detect MFT (myc-his6) expression, the membranes were incubated for 24 hours with rabbit anti-myc primary antibody (MMS-150P; Covance Inc., Princeton, NJ), then with IRDye 800CW–conjugated goat anti-rabbit IgG secondary antibody (925-32211; LICOR Biosciences, Omaha, NE) for 90 minutes. The blots were scanned with an Odyssey infrared imaging system (LICOR Biosciences). The membrane was prestained with Coomassie Blue as a loading control.
For assays of AMPK and mTOR signaling, total and phospho-AMPK (P-AMPK) and total and phosphorylated S6K1 (P-p70- and P-p80-S6K1) were analyzed by Western blotting (Mitchell-Ryan et al., 2013). In brief, HPAC and BxPC-3 cells (1 million cells/dish for vehicle-treated samples, 1.5 million cells/dish for drug-treated samples) were seeded in 60-mm dishes in 5 ml of FFRPMI supplemented with 10% dialyzed FBS, 1% penicillin/streptomycin, 2 mM l-glutamine, and 25 nM leucovorin. Cells were allowed to adhere for 24 hours, after which 10 µM AGF347, 1 mM AICA ribonucleoside (AICAR), or a comparable volume of vehicle (DMSO) was added. Incubations were performed at 37°C with 5% CO2. After 48 hours, cells were harvested and disrupted by sonication; cell debris was removed by centrifugation (1800 rpm, 5 minutes, 4°C). The soluble cell fractions were assayed for protein concentration (Lowry et al., 1951), and equal protein (50 µg) from each sample was electrophoresed on 10% polyacrylamide gels with SDS and transferred to polyvinylidene difluoride membranes. To detect phospho- or total AMPK, or p70-S6K1/p85-S6K1, membranes were incubated for 24 hours with rabbit primary antibody [total AMPK, 5831S; P-AMPK, T172, 2535S; total p70-S6K1/p85-S6K1, 2708S; P-p70-S6K1/P-p80-S6K1 (T389/T412), 9234S; Cell Signaling Technology, Danvers, MA]. The blots were stripped (25 mM glycine, pH 2.0, 1% to 2% SDS) to remove bound antibodies between probing with different antibodies. The blots were developed by incubating in IRDye 800CW–conjugated goat anti-rabbit IgG secondary antibody (925-32211; LICOR Biosciences) for 90 minutes and scanned with an Odyssey infrared imaging system (LICOR Biosciences). Protein loading was normalized to β-actin using anti-β-actin mouse primary antibody (A2228; Sigma-Aldrich) and IRDye 800CW–conjugated goat anti-mouse IgG secondary antibody (926-32210; LICOR Biosciences). Densitometry used Image Studio Software (LICOR Biosciences). For densitometry of S6K1, both p70 and p85 bands were quantified. All blots were run at least in duplicate, and densitometry data are reported as average values plus/minus ranges.
Real-Time PCR.
Cells were harvested from either 60-mm dishes or T25 flasks at ∼80% confluence, and RNAs were extracted using TRIzol reagent (Invitrogen, Carlsbad, CA). cDNAs were synthesized with random hexamers, MuLV reverse transcriptase, and RNase inhibitor (Applied Biosystems, Waltham, MA) and purified with a QIAquick PCR Purification Kit (QIAGEN, Valencia, CA). Quantitative real-time RT-PCR used a Roche LightCycler 480 (Roche Diagnostics, Indianapolis, IN) with gene-specific primers and SYBR Green I dye. Transcript levels were normalized to β-actin and/or glyceraldehyde-3-phosphate dehydrogenase transcripts. Primer sequences are available upon request.
Membrane Transport Assays.
Plasma membrane transport measurements were performed at 37°C as previously described (Ravindra et al., 2018). Buffers used were MES [2-(N-morpholino)ethanesulfonic acid]–buffered saline at pH 5.5 (20 mM MES, 140 mM NaCl, 5 mM KCl, 2 mM MgCl2, and 5 mM glucose) and HEPES [4-(2-hydroxyethyl)-1-piperazineethanesulfonic acid]–buffered saline at pH 6.8 and pH 7.2 (20 mM HEPES, 140 mM NaCl, 5 mM KCl, 2 mM MgCl2, and 5 mM glucose). For some experiments, anion-free buffer at pH 7.2 (20 mM HEPES and 235 mM sucrose) was used. For standard transport experiments, cells were seeded in 60-mm dishes and assayed for uptake when cells were 75%–90% confluent with 0.5 µM [3H]MTX or [3H]AGF347 at 37°C over 2–5 minutes. For the PaC cell lines, uptake was measured at pH 5.5, 6.8, and 7.2 using MES-buffered (pH 5.5) and HEPES-buffered (pH 6.8 and 7.2) saline. Uptake assays in the presence of excess (10 µM) nonradioactive AGF94 (Wang et al., 2011) (blocks PCFT uptake) and/or PT523 (Rosowsky, 1999) (blocks RFC uptake) were performed to establish transport specificities. Calculations of Km and Vmax were performed with concentrations of [3H]AGF347 or [3H]MTX from 20 to 500 nM for R2/PCFT4 cells (at pH 5.5 in MES-buffered saline) or from 250 nM to 5 µM for R1-11 RFC2 cells (at pH 7.2 in anion-free buffer). Km and Vmax values were calculated by Lineweaver-Burk plots. Ki values for each of the drugs relative to 0.5 µM [3H]MTX were calculated from Dixon plots using concentrations of non-radioactive competitor (e.g., AGF347) from 0 to 500 nM (R2/PCFT4 at pH 5.5 in MES-buffered saline) or 0 to 1 µM (R1-11 RFC2 at pH 7.2 in anion-free buffer).
Subcellular Fractionation Assays of Cytosolic and Mitochondrial AGF347.
Cells were cultured in complete αMEM supplemented with 10% bovine calf serum (Thermo Fisher), 1% penicillin/streptomycin, and 2 mM l-glutamine (glyB and glyBTII CHO cell lines) or complete RPMI 1640 supplemented with 10% FBS, 1% penicillin/streptomycin, and 2 mM l-glutamine [MIA PaCa-2 NTC, MIA PaCa-2 MFT knockdown (KD), and HPAC]. Prior to incubation with radiolabeled compounds, cells were cultured in complete FFRPMI for 48 hours. Two T150 flasks per treatment condition were seeded with 6 (CHO) or 8 (MIA PaCa-2/HPAC) million cells in FFRPMI medium supplemented with 60 µM adenosine and 10 µM thymidine (30 ml per T150 flask). Unlabeled MTX or AGF347 (2 µM, final) and 9 µCi of either [3H]MTX or [3H]AGF347, as appropriate, were added. For [3H]folic acid incubations, folate-depleted cells were seeded in complete αMEM or complete RPMI 1640 medium (containing 2.26 µM folic acid), to which 9 µCi of [3H]folic acid was added. Cells were incubated with radiolabel for 48 hours; the cytosolic and mitochondrial fractions were separated by differential centrifugation (Clayton and Shadel, 2014). In brief, cells were trypsinized, washed once with Dulbecco’s phosphate-buffered saline, and resuspended in hypotonic resuspension buffer [10 mM NaCl, 1.5 mg MgCl2, 10 mM Tris (pH 7.5)] containing cOmplete Protease Inhibitor Cocktail (Sigma-Aldrich) for 15 minutes. Cells were lysed with 15 strokes of a B (i.e., “tight-fitting”) pestle in a 7-ml Dounce homogenizer. A 2.5× mannitol-sucrose (MS) buffer [5.5 mM mannitol, 175 mM sucrose, 12.5 mM Tris (pH 7.5), 2.5 mM EDTA] containing cOmplete Protease Inhibitor Cocktail (Sigma-Aldrich) was added to a final concentration of 1× MS, and an aliquot (i.e., “total” fraction containing both cytosol and mitochondria) was sampled for radioactivity measurement and protein assay (Lowry et al., 1951). The homogenized cell suspension was centrifuged (3100 rpm, 5 minutes) at 4°C in a Jouan CR4i centrifuge (Thermo Fisher) to pellet nuclei and unbroken cells. After collecting the supernatant (contains mitochondria), nuclei and the unbroken cell pellets were resuspended in 1× MS, homogenized with five additional strokes, and centrifuged at 3100 rpm. The supernatant was pooled with the previous supernatant and centrifuged at 11,900 rpm at 4°C for 15 minutes in a Sorvall SS34 rotor (Thermo Fisher) to collect the mitochondria. The supernatant (i.e., cytosol fraction) was collected, and aliquots were assayed for radioactivity and protein. The mitochondrial pellet was washed once with 1× MS, centrifuged at 11,900 rpm for 15 minutes, and solubilized in 0.5 N NaOH, after which aliquots were assayed for radioactivity and proteins (i.e., mitochondrial fraction). To assess purities and yields of the cytosolic and mitochondrial fractions, parallel incubations were performed with no inhibitor or radiolabel, and cells were harvested for mitochondria and cytosol fractionation, as described earlier, and assays of lactate dehydrogenase (LDH; cytosolic marker) and succinate dehydrogenase (SDH; mitochondrial marker). LDH was assayed (Royer et al., 1977) in sodium phosphate buffer (0.03 M, pH 7.4) with excess of sodium pyruvate (300 µM) and NADH (70 μM) by measuring the rate of decrease in absorbance at 340 nm. SDH was assayed (Kolaj-Robin et al., 2011) in potassium phosphate buffer (10 mM, pH 7.5 with 1 mM potassium cyanide) with excess sodium succinate (20 mM) and 2,6-dichlorophenolindophenol by measuring the rate of decrease in absorbance at 600 nm.
Measurements of AGF347 Polyglutamylation.
Synthesis of AGF347 polyglutamates was assayed in the cytosolic and mitochondrial fractions (aforementioned) from MIA PaCa-2 NTC cells, as previously described (Kugel Desmoulin et al., 2011) with modifications. In brief, the aforementioned protocol for subcellular fractionation was modified by addition of 18 µCi of [3H]AGF347 to each T150 flask (final concentration 2 µM). Following incubation (48 hours), the cytosolic and mitochondrial fractions were isolated, then boiled (10 minutes), cooled (4°C), and centrifuged (14,000 rpm) in a microcentrifuge (4°C for 15 minutes). The supernatant was fractionated on an Agilent Infinity II 1260 high performance liquid chromatography (HPLC) system (Agilent Technologies Inc., Woburn, MA) using a Waters 4-μm Nova-Pak C18 column (3.9 × 150 mm) with a Nova-Pak 4-μm C18 guard column (Waters Corporation, Milford, MA). A mobile phase of 100 mM sodium acetate, pH 5.5 (mobile phase A), and 100% acetonitrile (mobile phase B) was used; the gradient was 100% A from 0 to 5 minutes, followed by a linear increase from 100% A at 5 minutes to 75% A/25% B at 35 minutes. The flow rate was 1.6 ml/min. Fractions were collected every minute for the first 5 minutes, every 30 seconds for the next 5 minutes, and every 10 seconds thereafter. Radioactivity was measured with a scintillation counter, and the amounts of the individual polyglutamates were calculated from the percentage of total radioactivity in each peak and total pmol/mg [3H]AGF347 in each compartment (mitochondria and cytosol). To confirm the identities of the peaks as AGF347 polyglutamates, the MIA PaCa-2 cytosolic sample was treated overnight with a preparation of chicken pancreas conjugase (Matherly et al., 1985) in 0.5 ml of 0.1 M sodium borate, pH 7.8, containing 10 mM 2-mercaptoethanol at 32°C to hydrolyze all polyglutamates to the AGF347 monoglutamyl form. Samples were deproteinized by boiling (5 minutes), then reanalyzed by HPLC.
Determination of Oxygen Consumption Rate.
Oxygen consumption rate (OCR) measurements were made using a Seahorse XFe24 extracellular flux analyzer (Agilent Technologies). HCT116 wild-type (WT) and SHMT2 KO cells were grown in complete folate-free, glycine-replete RPMI 1640 supplemented with 10% dialyzed FBS, 1% penicillin/streptomycin, 25 nM leucovorin, 2 mM l-glutamine, and adenosine (60 µM) and treated with AGF347 (10 µM) or vehicle (DMSO) for 48 hours. Cells were then seeded into gelatin-coated XFe24 cell culture microplates in the same medium (containing drug) at a density of 130,000 cells per well (five replicate wells per condition) and allowed to adhere for 24 hours. OCRs were monitored at baseline and throughout sequential injections of oligomycin (1 μM), carbonyl cyanide-4-(trifluoromethoxy)phenylhydrazone (1 μM), and rotenone/antimycin A (1 μM each). OCRs were normalized to cell numbers in each well by solubilizing cells with 0.5 N NaOH and assaying proteins by the Folin-phenol method (Lowry et al., 1951).
Measurements of reduced glutathione and ROS.
HCT116 (WT, SHMT1 KO, and SHMT2 KO), HPAC, and BxPC-3 cells (25,000 cells per well in a 96-well plate), and MIA PaCa-2 cells (40,000 cells per well) were seeded for the ROS assays. For the reduced glutathione (GSH) assays, 20,000 cells per well were seeded. Cells were incubated (24 hours) in complete FFRPMI supplemented with 10% dialyzed FBS, 1% penicillin/streptomycin, 25 nM leucovorin, and 2 mM l-glutamine overnight under normoxic conditions (21% O2, 5% CO2), at which time the medium was replaced with FFRPMI without glycine, supplemented with 10% dialyzed FBS, 1% penicillin/streptomycin, 2 mM l-glutamine, 25 nM leucovorin, and 60 µM adenosine. The cells were treated with 10 µM AGF347 or an equivalent volume of vehicle (i.e., DMSO) for 24 hours under hypoxia (0.5% O2, 5% CO2) (Ye et al., 2014) in a Biospherix hypoxia chamber (Biospherix, Parish, NY); for the ROS assays, parallel incubations (24 hours) were also performed in normoxic conditions (21% O2, 5% CO2). Cells were then processed for ROS measurements (catalog number K936; Biovision, Milpitas, CA) by the 2′,7′-dichlorodihydrofluorescein diacetate (H2DCFDA) assay and for GSH measurements (catalog number V6911; Promega, Madison, WI) by a GSH S-transferase–based luminescence assay following the manufacturers’ protocols. To measure total glutathione pools—both reduced (i.e., GSH) and oxidized [glutathione disulfide (GSSG)] forms—cells were treated with 500 μM tris(2-carboxyethyl)phosphine to reduce GSSG to GSH just prior to GSH assay. For the ROS assays, a positive control (ROS inducer) was included in the ROS assay kit. For both ROS and GSH/GSSG levels, results were normalized to cell numbers in each well by solubilizing with 0.5 N NaOH and assaying proteins (Lowry et al., 1951). For the GSH/GSSG assays, protein normalization was based on protein concentrations for identically treated plates that were incubated in parallel with the experimental plate.
Statistics.
Sample sizes were predetermined before each experiment. All statistical comparisons were performed using a two-tailed unpaired t test corrected for unequal variance after data were transformed to meet normality assumptions, and no P value adjustments were made for multiple comparisons. A log10 transformation was used for data with positive values, and when data included zero values, a square root transformation was used instead. For depicting data in plots, all data were summarized with mean values and S.D. using data without transformation. Geometric mean values and their associated 95% confidence intervals were used to summarize IC50 and transport kinetics results using data without transformation in Tables 1 and 2. Experiments that were exploratory in character were descriptively summarized without statistical comparisons.
TABLE 1.
IC50 values for antiproliferative activities toward HCT116 colon cancer and pancreatic cancer cell line panel
Proliferation inhibition assays were performed using the HCT116 (colon cancer), MIA PaCa-2, HPAC, BxPC-3, CFPAC, and AsPC-1 (all PaC), and HPNE cell lines. Results are shown as geometric mean IC50 values (with 95% confidence interval), corresponding to the concentrations that inhibit growth by 50% relative to vehicle-treated control cells, from three biologic replicates.
| Compound | Proliferation Inhibition (IC50) | ||||||
|---|---|---|---|---|---|---|---|
| HCT116 | MIA PaCa-2 | HPAC | BxPC-3 | CFPAC | AsPC-1 | HPNE | |
| nM | nM | nM | nM | nM | nM | nM | |
| AGF291 | 2121 (1609–2795) | 2294 (2110–2493) | 309 (268–355) | 251 (229–274) | 419 (304–578) | 284 (261–310) | >5000 |
| AGF320 | 742 (486–1134) | 1540 (1503–1578) | 739 (606–901) | 632 (425–940) | 1912 (1621–2256) | 436 (419–453) | >5000 |
| AGF347 | 347 (301–400) | 639 (542–753) | 194 (157–239) | 80 (72–89) | 317 (284–354) | 203 (122–337) | >5000 |
TABLE 2.
Transport kinetics for 6-substituted pyrrolo[3,2-d]pyrimidine analogs compared with MTX, PMX, and AGF94
Transport assays were performed using engineered R2/PCFT4 (expresses PCFT only) and R1-11 RFC2 (expresses RFC only) cells. For determinations of Km and Vmax values by Lineweaver-Burk analysis, concentrations of [3H]AGF347 or [3H]MTX were from 0.02 to 0.5 μM for R2/PCFT4 (at pH 5.5) and from 0.25 to 5 µM for R1-11 RFC2 (at pH 7.2). Ki values for each of the drugs were determined by Dixon analysis over a range of concentrations of nonradioactive competitor from 0 to 500 nM (for R2/PCFT4 at pH 5.5) or 0 to 1 µM (for R1-11 RFC2 at pH 7.2) and 0.5 µM [3H]MTX. Results are presented as geometric mean values (with 95% confidence intervals) from three biologic replicates. Pairwise statistical comparisons were performed against MTX (Km and Vmax) and PMX (Ki) using two-sided, unpaired t test.
| Substrate | RFC (R1-11 RFC2), pH 7.2 | PCFT (R2/PCFT4), pH 5.5 | ||||||
|---|---|---|---|---|---|---|---|---|
| Km | Vmax | Vmax/Km | Ki | Km | Vmax | Vmax/Km | Ki | |
| µM | pmol/mg per minute | µM | µM | pmol/mg per minute | µM | |||
| MTX | 0.609 (0.597–0.622) | 80 (44–144) | 118 (110–126) | ND | 0.329 (0.245–0.441) | 404 (184–888) | 1230 (687–2204) | ND |
| PMX | ND | ND | ND | 0.583 (0.513–0.663) | ND | ND | ND | 0.056 (0.054–0.058) |
| AGF94 | ND | ND | ND | 1.614*** (1.423–1.830) | ND | ND | ND | 0.070ns (0.044–0.111) |
| AGF291 | ND | ND | ND | 0.276** (0.225–0.338) | ND | ND | ND | 0.163# (0.096–0.275) |
| AGF320 | ND | ND | ND | 0.200* (0.148–0.272) | ND | ND | ND | 0.142* (0.097–0.209) |
| AGF347 | 0.388ns (0.280–0.536) | 72ns (68–75) | 205 (156–270) | 0.247* (0.186–0.327) | 0.057* (0.038–0.086) | 184 (129–263) | 3227 (1499–6945) | 0.070*** (0.068–0.073) |
ND, not determined; ns, “no significant difference” when comparing parameters from MTX and AGF347.
P < 0.1; *P < 0.05; **P < 0.01; ***P < 0.001.
Results
Demonstration of Efficacy and Mechanism in a Pancreatic Cancer Cell Line Panel
Our earlier study (Dekhne et al., 2019) established in vitro antitumor efficacies of our pyrrolo[3,2-d]pyrimidine compounds AGF291, AGF320, and AGF347 toward H460 lung cancer, HCT116 colon cancer, and MIA PaCa-2 PaC cell line models. With the demonstrated activity of AGF347 in vivo against MIA PaCa-2 PaC xenografts (Dekhne et al., 2019), we extended our studies to include four additional PaC cell lines (HPAC, BxPC-3, CFPAC-1, AsPC-1) characterized by expression of RFC and PCFT, but not folate receptor α (Supplemental Fig. 1). Proliferation results with the PaC cell lines were compared with those for HPNE cells (Lee et al., 2003). For HPAC, BxPC-3, CFPAC-1, and AsPC-1 cells, the compounds showed increased (∼4- to 9-fold) inhibitory activity relative to MIA PaCa-2 cells (Table 1). AGF347 (Fig. 2) was consistently the most active of the series, with the lowest IC50 values recorded in the HPAC (194 nM) and BxPC-3 (80 nM) cells. In HPNE cells, the pyrrolo[3,2-d]pyrimidine analogs were inactive up to 5000 nM (Table 1).
To confirm the targeted pathways for AGF347 in HPAC and BxPC-3 cells, we performed “rescue” experiments in glycine- and nucleoside-free media (Dekhne et al., 2019) to assess the protective effects of supplemented glycine (130 µM) and/or adenosine (60 µM) (Fig. 2). Neither glycine nor adenosine alone rescued cell proliferation from the effects of AGF347, although the combination effected complete rescue. These results are entirely consistent with our earlier studies (Dekhne et al., 2019) that established the inhibition of mitochondrial C1 metabolism and de novo purine biosynthesis by AGF347 in MIA PaCa-2 cells.
Determination of Plasma Membrane Transport of AGF347
Previous studies of antiproliferative activities of AGF291, AGF320, and AGF347 toward isogenic CHO cells engineered to individually express RFC or PCFT suggested cellular uptake of this series by these facilitative transporters (Dekhne et al., 2019). To directly measure transport of AGF347 by these systems, we performed transport assays with [3H]AGF347 in cell lines engineered to individually express RFC [R1-11 RFC2 HeLa (Wang et al., 2015)] or PCFT [R2/PCFT4 CHO (Deng et al., 2009)]. Transport of [3H]AGF347 (0.5 µM) was measured over 5 minutes at pH 7.2 (RFC) or pH 5.5 (PCFT) (approximating the respective pH optima) at 37°C, and results were compared with those with [3H]MTX. For both [3H]MTX and [3H]AGF347, transport was substantial for both PCFT and RFC. Transport was effectively abolished (≥90%) by excess unlabeled substrates with specificity for PCFT [AGF94 (Wang et al., 2011)] and RFC [PT523 (Rosowsky, 1999)] (Fig. 3, A and B). Transport kinetics were determined for [3H]MTX and [3H]AGF347. For both PCFT and RFC, the differences in Vmax values for AGF347 versus MTX were not significant. The differences in Km values for MTX versus AGF347 with RFC were also insignificant, whereas AGF347 had a significant 5.8-fold decreased Km for PCFT (0.057 vs. 0.329 µM, respectively) compared with MTX (Table 2).
Fig. 3.

Plasma membrane uptake of AGF291, AGF320, and AGF347. (A and B) Inhibition of [3H]MTX and [3H]AGF347 uptake (both at 0.5 µM) in RFC-expressing R1-11 RFC2 HeLa cells at pH 7.2 (A) and PCFT-expressing R2/PCFT4 CHO cells at pH 5.5 (B). AGF94 and PT523 treatments (both at 10 µM) were used as PCFT- and RFC-specific inhibitor controls, respectively. Results (mean values ± S.D.) reflect three biologic replicates and are expressed as the fraction of [3H]MTX uptake relative to vehicle (i.e., DMSO)-treated cells. (C–E) Uptake of [3H]AGF347 in HCT116 WT (C) and PaC cells at pH 5.5 (C), pH 7.2 (D), and pH 6.8 (E), without additions or in the presence of 10 µM AGF94 and/or PT523. Results (mean values ± S.D.) reflect three biologic replicates and are expressed as pmol [3H]substrate per mg protein. #P < 0.10; *P < 0.05; **P < 0.01; ***P < 0.001. ns, not significant. Pairwise statistical comparisons were performed by two-sided unpaired t tests against R1-11 RFC2 (A), R2/PCFT4 (B), and none (C–E), unless otherwise specified by lines indicating pairs to be compared. Experimental details are in Materials and Methods.
Transporter binding for the pyrrolo[3,2-d]pyrimidine analogs AGF291, AGF320, and AGF347 (Dekhne et al., 2019) was further assessed by calculating Ki values by Dixon analysis with [3H]MTX in the PCFT and RFC engineered cell lines, using the calculated Km and Vmax values for [3H]MTX. The results were compared with those calculated for AGF94 and PMX (Table 2). By these analyses, Ki values for AGF291, AGF320, and AGF347 for RFC were essentially equivalent (range of 0.200–0.274 µM) and were 2- to 3-fold lower than that for PMX (0.583 µM). For PCFT, the Ki for AGF347 (0.070 µM) was 2- to 2.5-fold lower than those for AGF291 (0.163 µM) and AGF320 (0.142 µM) and was equivalent to that for AGF94 (0.070 µM); the Ki value for AGF347 was similar to that for PMX (0.056 µM), among the best PCFT substrates (Chattopadhyay et al., 2007; Unal et al., 2008; Wang et al., 2011).
To extend these transport analyses to the assorted PaC cell lines, we measured uptake of [3H]AGF347 at both pH 5.5 and pH 7.2 in the presence or absence of excess (10 µM) unlabeled AGF94 and/or PT523 to gauge the relative contributions of PCFT and RFC, respectively, to [3H]AGF347 uptake. Our experiments revealed substantial uptake of [3H]AGF347 by PCFT at pH 5.5 and by RFC at pH 7.2 (Fig. 3, C and D). At pH 5.5, PCFT uptake was blocked by AGF94, albeit incompletely (∼30%–90%); this suggests a contribution from a non-PCFT transporter in addition to PCFT. Analogous results were recorded at pH 7.2, although transport was blocked (∼65%–85%) by PT523, demonstrating principal involvement of RFC.
Experiments with the PaC cell lines were extended to pH 6.8, approximating the pH of the tumor microenvironment (Stubbs et al., 2000). At pH 6.8 (Fig. 3E), uptake of [3H]AGF347 was mediated by both PCFT and RFC such that the transport inhibition by both AGF94 and PT523 together was substantial and ranged from ∼70% to 90%. Uptake of [3H]AGF347 by RFC predominated at pH 6.8, as reflected in the generally greater decrease in net uptake for samples treated with PT523 compared with those treated with AGF94. Collectively, these studies establish important roles for both RFC and PCFT in the uptake of AGF347 by PaC cells.
Subcellular Compartmentation of AGF347 and Metabolism to Polyglutamates
Implicit to targeting of mitochondrial C1 metabolism by our pyrrolo[3,2-d]pyrimidine inhibitors (Dekhne et al., 2019) is their uptake and accumulation in the mitochondria. Further, as these molecules are negatively charged, they likely require facilitated uptake into mitochondria, possibly mediated by the MFT, the only known transporter of folates into the mitochondrial matrix (McCarthy et al., 2004; Lawrence et al., 2011).
We assessed mitochondrial accumulation of [3H]AGF347 by MIA PaCa-2 cells in comparison with [3H]folic acid and [3H]MTX. To determine whether MFT contributes to mitochondrial uptake of [3H]AGF347, we transfected human MFT (myc-His6–tagged) into MFT-null glyB CHO cells (McCarthy et al., 2004) to generate the glyBTII cell line (Supplemental Fig. 2A shows a Western blot of glyB and glyBTII cell extracts probed with Myc antibody, confirming ectopic MFT-myc-His6 expression). For MIA PaCa-2 cells, we generated NTC and MFT short hairpin RNA KD (MFT KD) cells to assess the transport role of MFT in a human tumor model (Supplemental Fig. 2B). We also measured mitochondrial uptake of [3H]AGF347 and [3H]MTX in HPAC cells.
The cell lines were cultured for 48 hours, after which [3H]folic acid (2.26 µM), [3H]MTX (2 µM), or [3H]AGF347 (2 µM) was added for an additional 48 hours [in the presence of 60 µM adenosine and 10 µM thymidine to abrogate any potential cytotoxic drug effects (Deng et al., 2008; Dekhne et al., 2019)]. Mitochondrial and cytosolic fractions were isolated by differential centrifugation (Clayton and Shadel, 2014), with the radioactivity in each fraction quantified (Fig. 4, A–C) and normalized to protein (Fig. 4, D–F). LDH (Lin et al., 1993) and SDH catalytic activities (Munujos et al., 1993) were used as measures of purity and cross-contamination between the cytosolic and mitochondrial fractions, respectively (Supplemental Table 1). Whereas the mitochondrial fractions were highly pure (<5% cytosolic contamination), cytosolic fractions were contaminated with lysed mitochondria.
Fig. 4.

Subcellular compartmentation of AGF347 relative to folic acid and MTX. (A–F) Relative distributions of [3H]folic acid (2.26 µM) (A), [3H]MTX (2 µM) (B), and [3H]AGF347 (2 µM) (C), as well as total cellular (D) and compartment-specific accumulations in the cytosol (E) and mitochondria (F) of glyB (MFT-null) and glyBTII (human MFT transfected) CHO cells and MIA PaCa-2 NTC (MFT WT) and MIA PaCa-2 MFT KD (MFT KD) PaC cells. Results (mean values ± S.D.) represent three biologic replicates and are expressed as a percentage (A–C) or pmol [3H]substrate per mg protein in each cellular fraction (mitochondrial and cytosol) (D–F). (G–I) HPLC analysis of [3H]AGF347 polyglutamyl derivatives in the cytosol (G) and mitochondria (H) of MIA PaCa-2 cells, along with a conjugase-treated aliquot of the cytosol (I). Results are expressed as counts per minute (CPM) eluted in a given time fraction (see Materials and Methods) and are representative of two biologic replicates. #P < 0.10; *P < 0.05; **P < 0.01; ***P < 0.001. ns, not significant. Pairwise statistical comparisons were performed by two-sided unpaired t tests, and each line indicates a pair to be compared in (D)–(F).
Substantial uptake of [3H]folic acid and [3H]AGF347 was detected in both cytosolic and mitochondrial fractions of the glyBTII CHO and MIA PaCa-2 NTC sublines, with the mitochondrial fraction comprising 20%–33% of the total accumulated [3H]folic acid and 14%–16% of the total [3H]AGF347 (Fig. 4, A–C) in cells. Cytosolic [3H]MTX accumulations were modest, and there were disproportionately low levels of [3H]MTX in mitochondria as previously reported (Lin et al., 1993). Analogous results were obtained for HPAC cells (Fig. 4, B and C). Thus, [3H]AGF347 accumulates significantly in the mitochondria.
Mitochondrial [3H]folic acid accumulations significantly decreased in the MIA PaCa-2 MFT KD (∼50%) and glyB (MFT-null) (∼90%) cell lines compared with their MFT-functional counterparts (Fig. 4F); this is consistent with MFT-mediated uptake of [3H]folic acid metabolites (McCarthy et al., 2004). Although the mitochondrial accumulation of [3H]AGF347 was likewise decreased (∼35%) in glyB cells, compared with glyBTII cells, the decrease was less than the corresponding decrease in mitochondrial accumulation of [3H]folic acid between the same two cell lines. Further, there was no difference in the mitochondrial uptake of [3H]AGF347 between the MIA PaCa-2 NTC and MFT KD sublines. Collectively, these results indicate that mitochondrial accumulation of [3H]AGF347 is at least partially mediated by MFT.
As FPGS is expressed as cytosolic and mitochondrial-specific isoforms, and polyglutamate folate cofactors are detected in both compartments (Lawrence et al., 2014), we assessed whether [3H]AGF347 polyglutamates could be identified in the cytosolic and mitochondrial fractions. The cytosolic and mitochondrial fractions from MIA PaCa-2 NTC cells incubated with [3H]AGF347 were fractionated by HPLC for detection of [3H]AGF347 polyglutamates and unmetabolized [3H]AGF347. In addition to the parent monoglutamyl [3H]AGF347, at least six metabolites (PG2–7) were resolved in the cytosolic extract (Fig. 4G), and three metabolites (labeled PG5–7 based on the elution times for the cytosolic extract) were detected in the corresponding mitochondrial extract (Fig. 4H). To confirm identities of the peaks as polyglutamyl metabolites of [3H]AGF347, aliquots of the MIA PaCa-2 NTC cytosolic fraction were treated with chicken pancreas conjugase (Kugel Desmoulin et al., 2011). The early-eluting metabolites quantitatively (>95%) reverted to parent [3H]AGF347 (Fig. 4I), confirming that these radiolabeled metabolites were polyglutamyl forms of [3H]AGF347. These results establish near-complete metabolism to [3H]AGF347 polyglutamates in both the cytosol and mitochondria of MIA PaCa-2 cells (Table 3), suggesting that AGF347 is an excellent substrate for FPGS in both compartments. In both the cytosol and the mitochondria, the pentaglutamyl and hexaglutamyl forms predominated.
TABLE 3.
Subcellular AGF347 metabolite distributions in MIA PaCa-2 cells
MIA PaCa-2 NTC cells were incubated with 2 µM [3H]AGF347 for 48 hours in the presence of adenosine (60 µM) and glycine (130 µM). Cytosolic and mitochondrial cellular fractions were isolated by differential centrifugation, and parent (PG1) and polyglutamyl (PG2–PG7) forms were fractionated by reverse-phase HPLC and quantified. Results are expressed in units of pmol/mg protein as the average ± range for biologic duplicate experiments and as the percentage of the total AGF347 forms in each cellular compartment (cytosol and mitochondria).
| AGF347 Form | AGF347 Metabolite | |
|---|---|---|
| Cytosol | Mitochondria | |
| pmol/mg (%) | pmol/mg (%) | |
| PG7 | 12.87 ± 3.52 (6.42) | 36.65 ± 4.03 (14.28) |
| PG6 | 68.03 ± 0.37 (33.94) | 115.53 ± 6.48 (45.01) |
| PG5 | 88.30 + 2.00 (44.05) | 71.26 ± 5.17 (27.76) |
| PG4 | 14.31 ± 2.08 (7.41) | 12.59+/2.42 (4.90) |
| PG3 | 7.45 ± 0.76 (3.72) | 8.91 ± 1.28 (3.47) |
| PG2 | 4.50 ± 0.40 (2.24) | 4.49 ± 1.95 (1.75) |
| PG1 (AGF347) | 4.00 + 0.89 (2.49) | 7.52 ± 2.43 (2.93) |
| Total AGF347 forms | 200.45 | 256.69 |
Downstream Effects of Targeting SHMT2 and De Novo Purine Biosynthesis by AGF347
We previously reported that the pyrrolo[3,2-d]pyrimidine compounds AGF291, AGF320, and AGF347 all targeted SHMT2 in the mitochondria, and SHMT1 and the purine biosynthetic enzymes GARFTase and/or AICARFTase in the cytosol (Dekhne et al., 2019). Inhibition of de novo purine biosynthesis was accompanied by elevation of AICA ribonucleotide and suppression of cellular purine nucleotide pools (Dekhne et al., 2019). We considered the possibility that downstream effects of these inhibitions could significantly contribute to the antitumor efficacy of AGF347 and related compounds in vitro and in vivo (Dekhne et al., 2019), including those involving: 1) mTOR signaling (Racanelli et al., 2009; Rothbart et al., 2010), 2) mitochondrial respiration (Minton et al., 2018; Morscher et al., 2018), and 3) elevated ROS due to decreased glycine synthesis and GSH pools (Ye et al., 2014).
Inhibition of mTOR Signaling.
Both elevated AICA ribonucleotide (via activation of AMPK) (Racanelli et al., 2009; Rothbart et al., 2010) and decreased purines (Hoxhaj et al., 2017) can suppress the prosurvival mTOR pathway (Lim et al., 2015). As Ras-ERK exhibits “cross-talk” with AMPK-mTOR signaling (Mendoza et al., 2011; Mann et al., 2016; Liang et al., 2019), we assessed the impact of AGF347 treatment (10 μM, 48 hours) on both BxPC-3 (KRAS WT) and HPAC (KRAS mutant) PaC cell lines by analyzing changes in phosphorylation of AMPK (P-AMPK) and the mTOR effectors p70- and p85-S6K1 (Magnuson et al., 2012) by Western blotting. Treatment with AICAR (1 mM) elevates AICA ribonucleotide levels and was used as a positive control (Mitchell-Ryan et al., 2013). Results are shown in Fig. 5.
Fig. 5.

Inhibition of mTOR signaling by AGF291, AGF320, and AGF347. Activation of AMPK and suppression of mTOR signaling via S6K1 (mTOR effector, p85 and p70 isoforms) in vehicle-, AICAR-, or drug-treated KRAS WT BxPC-3 and KRAS mutant HPAC cells. The cell lines were analyzed on the same gel with a single marker. AMPK activation is reflected in the hyperphosphorylation (P-AMPK) and S6K1 suppression is reflected in the hypophosphorylation of p85-S6K1 and p70-S6K1 (P-p85-S6K1 and P-p70-S6K1). Total AMPK and p85-S6K1 and p70-S6K1 are shown. β-Actin was used as a loading control. Blots are representative of two biologic replicates. Experimental details are in Materials and Methods.
AICAR treatment of both BxPC-3 and HPAC cells induced AMPK hyperphosphorylation [3.87-fold (±0.17) and 1.32-fold (±0.03), respectively] compared with untreated controls. This was accompanied by decreased phospho-S6K1 (p85- and p70-S6K1) in both BxPC-3 [0.16 (±0.02) compared with the control value of 1] and HPAC [0.20 (±0.01)] cells. AGF347 induced a modestly increased activation of AMPK in the BxPC-3 cells [1.93-fold (±0.09) increased P-AMPK] compared with HPAC cells [1.25-fold (±0.06)]. In BxPC-3 cells, AGF347 treatment induced hypophosphorylation of S6K1 [0.62 (±0.04)] but not HPAC cells [1.01 (±0.02)] compared with controls.
These results suggest that AMPK activation and loss of mTOR signaling may contribute to the antitumor efficacy of AGF347. However, the magnitude of these effects varied in different tumor models.
Effects on Mitochondrial Respiration.
As SHMT2 serves a critical role in respiratory chain protein synthesis via methylation of select mitochondrial transfer RNAs, with SHMT2 KO cells experiencing respiratory deficiencies (Lucas et al., 2018; Minton et al., 2018; Morscher et al., 2018), we examined whether suppression of SHMT2 by AGF347 resulted in an analogous effect on mitochondrial respiration. For these experiments, we used HCT116 WT and HCT116 SHMT2 KO cells (Morscher et al., 2018) from our prior study (Dekhne et al., 2019) to directly compare effects on the OCR resulting from inhibition of SHMT2 by AGF347 to those resulting from complete KO of SHMT2. HCT116 cells were pretreated with vehicle (DMSO; WT and SHMT2 KO) or 10 µM AGF347 (WT) for 48 hours as before (Dekhne et al., 2019). Cells were seeded, and the next day, they were subjected to a mitochondrial stress test (Fig. 6). As previously reported (Lucas et al., 2018; Minton et al., 2018; Morscher et al., 2018), the SHMT2 KO cells showed a substantially reduced respiratory capacity relative to WT cells. In spite of the confirmed inhibition of SHMT2 (Dekhne et al., 2019), AGF347 caused no repressive effect on basal respiration, ATP production (H+ leak), maximal respiration, or nonmitochondrial respiration compared with WT cells (Fig. 6).
Fig. 6.

Effects of AGF347 on mitochondrial respiration. OCR measurements of vehicle-treated HCT116 WT or SHMT2 KO cells and of AGF347-treated HCT116 WT cells during a mitochondrial stress test are shown. Experiments were performed with a Seahorse XFe24 analyzer with HCT116 cells pretreated with vehicle (DMSO; WT and SHMT2 KO) or 10 µM AGF347 (WT) for 48 hours in glycine-replete medium with 60 µM adenosine. Oligomycin (1 µM), carbonyl cyanide-4-(trifluoromethoxy)phenylhydrazone (1 µM), and rotenone/antimycin A (1 µM each) were sequentially added at the indicated time points to determine basal, maximal, and nonmitochondrial respiration, as well as H+ leak. Results (mean values ± S.E.) represent 12 technical replicates measured over two independent experiments. **P < 0.01. FCCP, carbonyl cyanide-4-(trifluoromethoxy)phenylhydrazone; Pairwise statistical comparisons were performed by two-sided unpaired t tests against WT. Experimental details are in Materials and Methods.
Impact of AGF347 on ROS and GSH Pools.
SHMT2 is critical for synthesis of glycine for generation of GSH (Ducker and Rabinowitz, 2017), and previous work has shown de novo GSH biosynthesis is more sensitive to glycine depletion than either de novo purine or protein biosynthesis (Ducker et al., 2017). GSH functions to scavenge ROS that are byproducts of oxidative phosphorylation, especially under hypoxic conditions that induce an “electron leak” from the electron transport chain (Chandel et al., 2000; Guzy et al., 2005).
To assess induction of ROS upon treatment with AGF347 (10 μM), we treated HCT116, BxPC-3, HPAC, and MIA PaCa-2 cells with inhibitor for 24 hours under normoxic (21% O2, 5% CO2) and hypoxic [0.5% O2, 5% CO2 (Ye et al., 2014)] conditions. As controls, we included HCT116 SHMT1 KO and SHMT2 KO cells. To prevent rescue of GSH pools by extracellular glycine, we performed these experiments in glycine-free medium supplemented with adenosine (60 µM) (isolates effects of SHMT2 inhibition from those resulting from de novo purine biosynthesis inhibition). Total cellular ROS was measured with an H2DCFDA reporter assay (Eruslanov and Kusmartsev, 2010). Functional induction of cellular hypoxia under 0.5% O2 was reflected in elevated transcripts for carbonic anhydrase IX (Fig. 7A), an established hypoxia marker (Benej et al., 2014). Under normoxic conditions (Fig. 7B), treatment with AGF347 induced no significant accumulation of ROS in any of the cell lines. Conversely, under hypoxia (Fig. 7C), significant accumulation of ROS occurred in HCT116 WT (∼2-fold) and HPAC cells (1.5-fold) treated with AGF347, although there was no increased ROS in BxPC-3 and MIA PaCA-2 cells treated with the inhibitor. HCT116 SHMT2 KO cells induced a 3-fold increase in ROS (under hypoxic conditions), whereas there was no significant increase in ROS in SHMT1 KO cells. Thus, complete loss of SHMT2 in HCT116 cells results in increased ROS. Further, the extent of ROS induction with AGF347 varies with different cell lines. These results suggest that ROS could be an important mediator of AGF347 antitumor effects in hypoxic tumors.
Fig. 7.

Effects of AGF347 on ROS and GSH and total (GSH + GSSG) glutathione pools. (A) Carbonic anhydrase IX (CA9) transcripts were measured as a biologic readout for hypoxia in HCT116 (WT, SHMT1 KO, and SHMT2 KO) and PaC (BxPC-3, HPAC, and MIA PaCa-2) cells incubated for 24 hours under normoxic (21% O2, 5% CO2) or hypoxic (0.5% O2, 5% CO2) conditions. (B and C) Data are shown for cellular ROS generation in vehicle- or AGF347-treated cells under normoxia (B) or hypoxia (C). (D) Data are shown for GSH and total glutathione (GSH + GSSG) in vehicle- or AGF347-treated cells under hypoxic conditions. CA9 experiments reflect three biologic replicates, GSH/GSSG experiments reflect eight technical replicates over two independent experiments, and ROS experiments represent 16 technical replicates over two independent experiments. GSH/GSSG and ROS results (mean values ± S.D.) were normalized to cellular proteins. #P < 0.10; *P < 0.05; **P < 0.01; ***P < 0.001. ns, not significant. Pairwise statistical comparisons were performed by two-sided unpaired t tests against normoxia samples in (A) and respective WTs in (B)–(D).
To assess the possibility that decreased GSH due to loss of glycine or redox potential resulting from loss of SHMT2 activity was causal in the increased ROS in certain cell lines, we assayed GSH in HCT116, BxPC-3, HPAC, and MIA PaCa-2 cells under hypoxic conditions. Consistent with the changes in ROS, both GSH and total glutathione (GSH + GSSG) pools were significantly decreased with AGF347 treatment in HCT116 and HPAC cell lines, paralleling changes in ROS (Fig. 7, C and D). Although decreases in GSH and total glutathione were also detected in MIA PaCa-2 cells, these were unchanged in BxPC-3 cells. Interestingly, HCT116 SHMT2 KO cells showed substantially elevated ROS yet unchanged GSH and total glutathione.
Collectively, these results suggest that suppression of de novo GSH biosynthesis and elevated ROS are potential mechanisms of in vivo cytotoxic activity by AGF347, although this varies with different tumor cells.
Discussion
Although targeting of C1 metabolism for cancer has shown clinical utility from the early days of chemotherapy to the present, the clinical effectiveness of drugs targeting these pathways is limited by their toxicities toward normal tissues. Therefore, agents targeting tumor-selective enzymes, such as those involved in mitochondrial C1 metabolism (Nilsson et al., 2014), would offer immense clinical utility.
In this study, we characterized the cellular pharmacodynamics of AGF347, a prototype and lead analog of a novel series of 5-substituted pyrrolo[3,2-d]pyrimidine compounds that inhibit mitochondrial C1 metabolism at SHMT2, with downstream inhibitions of cytosolic C1 targets including SHMT1 and the de novo purine biosynthetic enzymes GARFTase and AICARFTase (Dekhne et al., 2019). We focused on a series of five PaC cell lines (including those with different KRAS mutation status) based on our previous results that established substantial antitumor efficacy of AGF347 toward MIA PaCa-2, an aggressive PaC model with mutant KRAS (Dekhne et al., 2019). Whereas all of the analogs were active toward the PaC cell lines over an 11-fold range of growth inhibition, AGF347 was consistently the most active of the series. Further, tumor selectivity was strongly implied as the pyrrolo[3,2-d]pyrimidine inhibitors were inert toward HPNE cells.
We characterized the transport properties for [3H]AGF347, including transport kinetics compared with [3H]MTX with both RFC and PCFT, the major transport systems for folates and related compounds in the PaC cell lines. Transport of AGF347 by both RFC and PCFT was substantial. For the tumor-selective transporter PCFT, AGF347 showed a binding affinity approaching those of the best PCFT substrates, AGF94 and PMX (Desmoulin et al., 2012), and far exceeding that of MTX. In the PaC cell lines, transport of [3H]AGF347 by both PCFT and RFC was substantial at pH 6.8 (approximating pH conditions associated with the tumor microenvironment), although transport by RFC predominated.
As the pyrrolo[3,2-d]pyrimidine compounds target SHMT2 in the mitochondria (Dekhne et al., 2019), we assessed the mitochondrial accumulation of [3H]AGF347 in MIA PaCa-2 cells and in MFT-null glyB CHO cells transfected with human MFT. For both cell lines, significant [3H]AGF347 accumulated in both the cytosol and mitochondria at levels similar to those for [3H]folic acid metabolites and far in excess of [3H]MTX. As MFT is the only known mitochondrial transporter (McCarthy et al., 2004), the decreased mitochondrial accumulation of [3H]AGF347 in MFT-null glyB cells compared with glyBTII cells transfected with human MFT (albeit less than for [3H]folic acid) suggested that mitochondrial uptake of AGF347 must be at least partly mediated by MFT. However, partial (∼80%) MFT knockdown in MIA PaCa-2 cells had a nominal impact on mitochondrial accumulation of [3H]AGF347 in contrast to [3H]folic acid. This suggests that even a small amount of MFT is sufficient to mediate accumulation of AGF347 in the mitochondria, and/or that an additional mitochondrial transporter must also be involved in AGF347 uptake. Following uptake, AGF347 polyglutamates accumulated in the mitochondria, which likely contribute to sustained SHMT2 inhibition and in vivo antitumor activity of AGF347 (Dekhne et al., 2019). By analogy with pemetrexed, it is likely that the polyglutamyl derivatives that accumulate in the mitochondria and cytosol contribute to inhibition of cytosolic enzyme targets and are more potent enzyme inhibitors than the Ki values for the monoglutamate form would suggest (Dekhne et al., 2019). By analogy with folate polyglutamates (Lawrence et al., 2014), AGF347 polyglutamates are unlikely to be MFT substrates, and the accumulation of AGF347 polyglutamates in the cytosol may actually restrict drug accumulation in the mitochondria and SHMT2 inhibition.
We investigated mechanisms that directly or indirectly contribute to the antitumor effects of AGF347 secondary to targeting SHMT2 in mitochondria and de novo purine biosynthesis and SHMT1 in the cytosol (Dekhne et al., 2019). These include possible effects on AMPK and mTOR signaling, mitochondrial respiration, and GSH and GSSG levels and ROS scavenging. For BxPC-3 cells with WT KRAS, AGF347 increased AMPK phosphorylation and suppressed mTOR signaling, suggesting that loss of mTOR signaling plays a role in the antitumor efficacy of AGF347 in these cells. Inhibitor effects on AMPK and S6K1 were muted in KRAS-mutant HPAC cells, suggesting Ras-ERK cross-talk with AMPK-mTOR signaling could interfere with this mechanism (Mendoza et al., 2011). However, whether effects of AMPK phosphorylation and mTOR signaling might be related to KRAS status would require additional experiments in a wider range of KRAS WT and mutant cells to allow statistical analysis. There was no effect of AGF347 on mitochondrial respiration, in contrast to that resulting from genetic KO of SHMT2 in HCT116 cells. This suggests that the extent of SHMT2 inhibition by AGF347 is incomplete and likely insufficient to suppress mitochondrial respiration, consistent with the findings of Minton et al. (2018), who reported that impaired mitochondrial respiration requires complete suppression of SHMT2 activity. AGF347 effected decreased levels of GSH and total glutathione, likely reflecting the principal role of SHMT2 in the synthesis of glycine required for GSH and its impact on redox balance (Ducker and Rabinowitz, 2017). For HCT116 SHMT2 KO cells, GSH and total glutathione pools were unchanged, possibly due to a compensatory reversal of the SHMT1 reaction (Ducker et al., 2016), which results in restored glycine synthesis and the preservation of the GSH pools. As this was not seen with cells treated with AGF347, this likely reflects the dual inhibition of both SHMT1 and SHMT2 by this compound (Dekhne et al., 2019). Decreased total glutathione pools were accompanied by increased ROS (under hypoxic conditions) in some, but not all, cell lines, possibly reflecting (in part) reliance on alternate antioxidant pathways, such as thioredoxin (Birben et al., 2012).
In conclusion, the results described herein underscore the biologic novelty and multifaceted mechanisms of action for the 5-substituted pyrrolo[3,2-d]pyrimidine compounds typified by AGF347 and are entirely consistent with its substantial in vivo antitumor potency and nominal and reversible toxicity (Dekhne et al., 2019). Tumor specificity for this series of compounds is broad and likely reflects a selective reliance on mitochondrial C1 metabolism (Jain et al., 2012; Nilsson et al., 2014) and de novo purine biosynthesis over purine salvage (Subhi et al., 2004) in cancer cells, with downstream inhibition of mTOR signaling, decreased GSH pools, and increased ROS. This series of compounds affords an exciting new platform for broad-spectrum anticancer drug development.
Acknowledgments
We thank Dr. Izabela Podgorski, Mackenzie Herroon, and Erandi Rajagurubandara (Wayne State University) for their assistance with the hypoxia experiments.
Abbreviations
- AGF291
(4-(3-(2-amino-4-oxo-3,4-dihydro-5H-pyrrolo[3,2-d]pyrimidin-5-yl)propyl)benzoyl)-l-glutamic acid
- AGF320
(5-(5-(2-amino-4-oxo-3,4-dihydro-5H-pyrrolo[3,2-d]pyrimidin-5-yl)pentyl)thiophene-2-carbonyl)-l-glutamic acid
- AGF347
(4-(4-(2-amino-4-oxo-3,4-dihydro-5H-pyrrolo[3,2-d]pyrimidin-5-yl)butyl)-2-fluorobenzoyl)-l-glutamic acid
- AGF94
N-((5-[(2-amino-4-oxo-4,7-dihydro-3H-pyrrolo[2,3-d]pyrimidin-6-yl)propyl]thiophen-2-yl)carbonyl)-l-glutamic acid
- AICA
5-aminoimidazole-4-carboxamide
- AICAR
5-aminoimidazole-4-carboxamide ribonucleoside
- AICARFTase
AICA ribonucleotide formyltransferase
- AMPK
AMP-activated protein kinase
- C1
one-carbon
- FFRPMI
folate-free RPMI 1640
- FPGS
folylpoly-γ-glutamate synthetase
- GARFTase
glycinamide ribonucleotide formyltransferase
- GSH
reduced glutathione
- GSSG
glutathione disulfide
- H2DCFDA
2′,7′-dichlorodihydrofluorescein diacetate
- HPLC
high performance liquid chromatography
- HPNE
human pancreas normal epithelial
- KD
knockdown
- KO
knockout
- LDH
lactate dehydrogenase
- αMEM
α-minimal essential medium
- MES
2-(N-morpholino)ethanesulfonic acid
- MFT
mitochondrial folate transporter
- MS
mannitol-sucrose
- MTHFD
5,10-methylene THF dehydrogenase
- mTOR
mammalian target of rapamycin
- MTX
methotrexate
- NTC
nontargeted control
- OCR
oxygen consumption rate
- PaC
pancreatic cancer
- P-AMPK
phospho-AMPK
- PCFT
proton-coupled folate transporter
- PMX
pemetrexed
- PT523
Nα-(4-amino-4-deoxypteroyl)-Nδ-hemiphthaloyl-l-ornithine
- R2
MTXRIIOuaR2-4
- RFC
reduced folate carrier
- ROS
reactive oxygen species
- RT-PCR
reverse-transcription polymerase chain reaction
- SDH
succinate dehydrogenase
- SHMT
serine hydroxymethyltransferase
- THF
tetrahydrofolate
- WT
wild-type
Authorship Contributions
Participated in research design: Dekhne, Ning, Kalpage, Hou, Hüttemann, Matherly.
Conducted experiments: Dekhne, Ning, Kalpage, Frühauf, Wallace-Povirk, O’Connor.
Contributed new reagents or analytic tools: Nayeen, Shah, Gangjee.
Performed data analysis: Dekhne, Ning, Frühauf, Kim, Matherly.
Wrote or contributed to the writing of the manuscript: Dekhne, Hou, Gangjee, Matherly.
Footnotes
This work was supported in part by the National Institutes of Health [R01 CA53535 (L.H.M. and Z.H.), R01 CA152316 (L.H.M. and A.G.), R01 CA166711 (A.G. and L.H.M.), T32 CA009531 (A.S.D. and A.W.-P.), F30 CA228221 (A.S.D.), F31 CA022453 (A.W.-P.), and P30 CA022453 (S.K.)], a pilot Small Molecule Drug Discovery Grant from the Karmanos Cancer Institute (Z.H. and L.H.M.), the Eunice and Milton Ring Endowed Chair for Cancer Research (L.H.M.), and the Duquesne University Adrian Van Kaam Chair in Scholarly Excellence (A.G.).
 This article has supplemental material available at molpharm.aspetjournals.org.
References
- Benej M, Pastorekova S, Pastorek J. (2014) Carbonic anhydrase IX: regulation and role in cancer. Subcell Biochem 75:199–219. [DOI] [PubMed] [Google Scholar]
- Birben E, Sahiner UM, Sackesen C, Erzurum S, Kalayci O. (2012) Oxidative stress and antioxidant defense. World Allergy Organ J 5:9–19. [DOI] [PMC free article] [PubMed] [Google Scholar]
- Chandel NS, McClintock DS, Feliciano CE, Wood TM, Melendez JA, Rodriguez AM, Schumacker PT. (2000) Reactive oxygen species generated at mitochondrial complex III stabilize hypoxia-inducible factor-1alpha during hypoxia: a mechanism of O2 sensing. J Biol Chem 275:25130–25138. [DOI] [PubMed] [Google Scholar]
- Chattopadhyay S, Moran RG, Goldman ID. (2007) Pemetrexed: biochemical and cellular pharmacology, mechanisms, and clinical applications. Mol Cancer Ther 6:404–417. [DOI] [PubMed] [Google Scholar]
- Chen WH, Horoszewicz JS, Leong SS, Shimano T, Penetrante R, Sanders WH, Berjian R, Douglass HO, Martin EW, Chu TM. (1982) Human pancreatic adenocarcinoma: in vitro and in vivo morphology of a new tumor line established from ascites. In Vitro 18:24–34. [DOI] [PubMed] [Google Scholar]
- Clayton DA, Shadel GS. (2014) Isolation of mitochondria from tissue culture cells. Cold Spring Harbor Protocols 2014 (10):pdb.prot080002. [DOI] [PubMed] [Google Scholar]
- Dekhne AS, Shah K, Ducker GS, Katinas JM, Wong-Roushar J, Nayeen MJ, Doshi A, Ning C, Bao X, Frühauf J, et al. (2019) Novel pyrrolo[3,2-d]pyrimidine compounds target mitochondrial and cytosolic one-carbon metabolism with broad-spectrum antitumor efficacy. Mol Cancer Ther 18:1787–1799. [DOI] [PMC free article] [PubMed] [Google Scholar]
- Deng Y, Wang Y, Cherian C, Hou Z, Buck SA, Matherly LH, Gangjee A. (2008) Synthesis and discovery of high affinity folate receptor-specific glycinamide ribonucleotide formyltransferase inhibitors with antitumor activity. J Med Chem 51:5052–5063. [DOI] [PMC free article] [PubMed] [Google Scholar]
- Deng Y, Zhou X, Kugel Desmoulin S, Wu J, Cherian C, Hou Z, Matherly LH, Gangjee A. (2009) Synthesis and biological activity of a novel series of 6-substituted thieno[2,3-d]pyrimidine antifolate inhibitors of purine biosynthesis with selectivity for high affinity folate receptors over the reduced folate carrier and proton-coupled folate transporter for cellular entry. J Med Chem 52:2940–2951. [DOI] [PMC free article] [PubMed] [Google Scholar]
- Desmoulin SK, Hou Z, Gangjee A, Matherly LH. (2012) The human proton-coupled folate transporter: biology and therapeutic applications to cancer. Cancer Biol Ther 13:1355–1373. [DOI] [PMC free article] [PubMed] [Google Scholar]
- Ducker GS, Chen L, Morscher RJ, Ghergurovich JM, Esposito M, Teng X, Kang Y, Rabinowitz JD. (2016) Reversal of cytosolic one-carbon flux compensates for loss of the mitochondrial folate pathway. Cell Metab 24:640–641. [DOI] [PubMed] [Google Scholar]
- Ducker GS, Ghergurovich JM, Mainolfi N, Suri V, Jeong SK, Hsin-Jung Li S, Friedman A, Manfredi MG, Gitai Z, Kim H, et al. (2017) Human SHMT inhibitors reveal defective glycine import as a targetable metabolic vulnerability of diffuse large B-cell lymphoma. Proc Natl Acad Sci USA 114:11404–11409. [DOI] [PMC free article] [PubMed] [Google Scholar]
- Ducker GS, Rabinowitz JD. (2017) One-carbon metabolism in health and disease. Cell Metab 25:27–42. [DOI] [PMC free article] [PubMed] [Google Scholar]
- Eruslanov E, Kusmartsev S. (2010) Identification of ROS using oxidized DCFDA and flow-cytometry, in Advanced Protocols in Oxidative Stress II (Armstrong D. ed) pp 57–72, Humana Press, Totowa, NJ. [DOI] [PubMed] [Google Scholar]
- Flintoff WF, Davidson SV, Siminovitch L. (1976) Isolation and partial characterization of three methotrexate-resistant phenotypes from Chinese hamster ovary cells. Somatic Cell Genet 2:245–261. [DOI] [PubMed] [Google Scholar]
- Gower WR, Jr, Risch RM, Godellas CV, Fabri PJ. (1994) HPAC, a new human glucocorticoid-sensitive pancreatic ductal adenocarcinoma cell line. In Vitro Cell Dev Biol Anim 30A:151–161. [DOI] [PubMed] [Google Scholar]
- Guzy RD, Hoyos B, Robin E, Chen H, Liu L, Mansfield KD, Simon MC, Hammerling U, Schumacker PT. (2005) Mitochondrial complex III is required for hypoxia-induced ROS production and cellular oxygen sensing. Cell Metab 1:401–408. [DOI] [PubMed] [Google Scholar]
- Hanahan D, Weinberg RA. (2011) Hallmarks of cancer: the next generation. Cell 144:646–674. [DOI] [PubMed] [Google Scholar]
- Hoxhaj G, Hughes-Hallett J, Timson RC, Ilagan E, Yuan M, Asara JM, Ben-Sahra I, Manning BD. (2017) The mTORC1 signaling network senses changes in cellular purine nucleotide levels. Cell Rep 21:1331–1346. [DOI] [PMC free article] [PubMed] [Google Scholar]
- Jain M, Nilsson R, Sharma S, Madhusudhan N, Kitami T, Souza AL, Kafri R, Kirschner MW, Clish CB, Mootha VK. (2012) Metabolite profiling identifies a key role for glycine in rapid cancer cell proliferation. Science 336:1040–1044. [DOI] [PMC free article] [PubMed] [Google Scholar]
- Kim D, Fiske BP, Birsoy K, Freinkman E, Kami K, Possemato R, Chudnovsky Y, Pacold ME, Chen WW, Cantor JR, et al. (2015) SHMT2 drives glioma cell survival in the tumor microenvironment but imposes a dependence on glycine clearance. Nature 520:363–367. [DOI] [PMC free article] [PubMed] [Google Scholar]
- Kolaj-Robin O, O’Kane SR, Nitschke W, Léger C, Baymann F, Soulimane T. (2011) Biochemical and biophysical characterization of succinate: quinone reductase from Thermus thermophilus. Biochim Biophys Acta 1807:68–79. [DOI] [PubMed] [Google Scholar]
- Kugel Desmoulin S, Wang L, Hales E, Polin L, White K, Kushner J, Stout M, Hou Z, Cherian C, Gangjee A, et al. (2011) Therapeutic targeting of a novel 6-substituted pyrrolo [2,3-d]pyrimidine thienoyl antifolate to human solid tumors based on selective uptake by the proton-coupled folate transporter. Mol Pharmacol 80:1096–1107. [DOI] [PMC free article] [PubMed] [Google Scholar]
- Laemmli UK. (1970) Cleavage of structural proteins during the assembly of the head of bacteriophage T4. Nature 227:680–685. [DOI] [PubMed] [Google Scholar]
- Lawrence SA, Hackett JC, Moran RG. (2011) Tetrahydrofolate recognition by the mitochondrial folate transporter. J Biol Chem 286:31480–31489. [DOI] [PMC free article] [PubMed] [Google Scholar]
- Lawrence SA, Titus SA, Ferguson J, Heineman AL, Taylor SM, Moran RG. (2014) Mammalian mitochondrial and cytosolic folylpolyglutamate synthetase maintain the subcellular compartmentalization of folates. J Biol Chem 289:29386–29396. [DOI] [PMC free article] [PubMed] [Google Scholar]
- Lee KM, Nguyen C, Ulrich AB, Pour PM, Ouellette MM. (2003) Immortalization with telomerase of the Nestin-positive cells of the human pancreas. Biochem Biophys Res Commun 301:1038–1044. [DOI] [PubMed] [Google Scholar]
- Liang S-Q, Bührer ED, Berezowska S, Marti TM, Xu D, Froment L, Yang H, Hall SRR, Vassella E, Yang Z, et al. (2019) mTOR mediates a mechanism of resistance to chemotherapy and defines a rational combination strategy to treat KRAS-mutant lung cancer. Oncogene 38:622–636. [DOI] [PubMed] [Google Scholar]
- Lim HJ, Crowe P, Yang JL. (2015) Current clinical regulation of PI3K/PTEN/Akt/mTOR signalling in treatment of human cancer. J Cancer Res Clin Oncol 141:671–689. [DOI] [PubMed] [Google Scholar]
- Lin BF, Huang RF, Shane B. (1993) Regulation of folate and one-carbon metabolism in mammalian cells. III. Role of mitochondrial folylpoly-gamma-glutamate synthetase. J Biol Chem 268:21674–21679. [PubMed] [Google Scholar]
- Loayza-Puch F, Rooijers K, Buil LC, Zijlstra J, Oude Vrielink JF, Lopes R, Ugalde AP, van Breugel P, Hofland I, Wesseling J, et al. (2016) Tumour-specific proline vulnerability uncovered by differential ribosome codon reading. Nature 530:490–494. [DOI] [PubMed] [Google Scholar]
- Lowry OH, Rosebrough NJ, Farr AL, Randall RJ. (1951) Protein measurement with the Folin phenol reagent. J Biol Chem 193:265–275. [PubMed] [Google Scholar]
- Lucas S, Chen G, Aras S, Wang J. (2018) Serine catabolism is essential to maintain mitochondrial respiration in mammalian cells. Life Sci Alliance 1:e201800036. [DOI] [PMC free article] [PubMed] [Google Scholar]
- Magnuson B, Ekim B, Fingar DC. (2012) Regulation and function of ribosomal protein S6 kinase (S6K) within mTOR signalling networks. Biochem J 441:1–21. [DOI] [PubMed] [Google Scholar]
- Mann KM, Ying H, Juan J, Jenkins NA, Copeland NG. (2016) KRAS-related proteins in pancreatic cancer. Pharmacol Ther 168:29–42. [DOI] [PubMed] [Google Scholar]
- Matherly LH, Hou Z, Deng Y. (2007) Human reduced folate carrier: translation of basic biology to cancer etiology and therapy. Cancer Metastasis Rev 26:111–128. [DOI] [PubMed] [Google Scholar]
- Matherly LH, Voss MK, Anderson LA, Fry DW, Goldman ID. (1985) Enhanced polyglutamylation of aminopterin relative to methotrexate in the Ehrlich ascites tumor cell in vitro. Cancer Res 45:1073–1078. [PubMed] [Google Scholar]
- Matsudaira P. (1987) Sequence from picomole quantities of proteins electroblotted onto polyvinylidene difluoride membranes. J Biol Chem 262:10035–10038. [PubMed] [Google Scholar]
- McCarthy EA, Titus SA, Taylor SM, Jackson-Cook C, Moran RG. (2004) A mutation inactivating the mitochondrial inner membrane folate transporter creates a glycine requirement for survival of Chinese hamster cells. J Biol Chem 279:33829–33836. [DOI] [PubMed] [Google Scholar]
- Meiser J, Tumanov S, Maddocks O, Labuschagne CF, Athineos D, Van Den Broek N, Mackay GM, Gottlieb E, Blyth K, Vousden K, et al. (2016) Serine one-carbon catabolism with formate overflow. Sci Adv 2:e1601273. [DOI] [PMC free article] [PubMed] [Google Scholar]
- Mendoza MC, Er EE, Blenis J. (2011) The Ras-ERK and PI3K-mTOR pathways: cross-talk and compensation. Trends Biochem Sci 36:320–328. [DOI] [PMC free article] [PubMed] [Google Scholar]
- Minton DR, Nam M, McLaughlin DJ, Shin J, Bayraktar EC, Alvarez SW, Sviderskiy VO, Papagiannakopoulos T, Sabatini DM, Birsoy K, et al. (2018) Serine catabolism by SHMT2 is required for proper mitochondrial translation initiation and maintenance of formylmethionyl-tRNAs. Mol Cell 69:610–621.e5. [DOI] [PMC free article] [PubMed] [Google Scholar]
- Mitchell-Ryan S, Wang Y, Raghavan S, Ravindra MP, Hales E, Orr S, Cherian C, Hou Z, Matherly LH, Gangjee A. (2013) Discovery of 5-substituted pyrrolo[2,3-d]pyrimidine antifolates as dual-acting inhibitors of glycinamide ribonucleotide formyltransferase and 5-aminoimidazole-4-carboxamide ribonucleotide formyltransferase in de novo purine nucleotide biosynthesis: implications of inhibiting 5-aminoimidazole-4-carboxamide ribonucleotide formyltransferase to ampk activation and antitumor activity. J Med Chem 56:10016–10032. [DOI] [PMC free article] [PubMed] [Google Scholar]
- Morscher RJ, Ducker GS, Li SH, Mayer JA, Gitai Z, Sperl W, Rabinowitz JD. (2018) Mitochondrial translation requires folate-dependent tRNA methylation. Nature 554:128–132. [DOI] [PMC free article] [PubMed] [Google Scholar]
- Munujos P, Coll-Cantí J, González-Sastre F, Gella FJ. (1993) Assay of succinate dehydrogenase activity by a colorimetric-continuous method using iodonitrotetrazolium chloride as electron acceptor. Anal Biochem 212:506–509. [DOI] [PubMed] [Google Scholar]
- Newman AC, Maddocks ODK. (2017) Serine and functional metabolites in cancer. Trends Cell Biol 27:645–657. [DOI] [PubMed] [Google Scholar]
- Nilsson R, Jain M, Madhusudhan N, Sheppard NG, Strittmatter L, Kampf C, Huang J, Asplund A, Mootha VK. (2014) Metabolic enzyme expression highlights a key role for MTHFD2 and the mitochondrial folate pathway in cancer. Nat Commun 5:3128. [DOI] [PMC free article] [PubMed] [Google Scholar]
- Noguchi K, Konno M, Koseki J, Nishida N, Kawamoto K, Yamada D, Asaoka T, Noda T, Wada H, Gotoh K, et al. (2018) The mitochondrial one-carbon metabolic pathway is associated with patient survival in pancreatic cancer. Oncol Lett 16:1827–1834. [DOI] [PMC free article] [PubMed] [Google Scholar]
- Racanelli AC, Rothbart SB, Heyer CL, Moran RG. (2009) Therapeutics by cytotoxic metabolite accumulation: pemetrexed causes ZMP accumulation, AMPK activation, and mammalian target of rapamycin inhibition. Cancer Res 69:5467–5474. [DOI] [PMC free article] [PubMed] [Google Scholar]
- Ravindra M, Wilson MR, Tong N, O’Connor C, Karim M, Polin L, Wallace-Povirk A, White K, Kushner J, Hou Z, et al. (2018) Fluorine-substituted pyrrolo[2,3- d]pyrimidine analogues with tumor targeting via cellular uptake by folate receptor α and the proton-coupled folate transporter and inhibition of de novo purine nucleotide biosynthesis. J Med Chem 61:4228–4248. [DOI] [PMC free article] [PubMed] [Google Scholar]
- Rosowsky A. (1999) PT523 and other aminopterin analogs with a hemiphthaloyl-L-ornithine side chain: exceptionally tight-binding inhibitors of dihydrofolate reductase which are transported by the reduced folate carrier but cannot form polyglutamates. Curr Med Chem 6:329–352. [PubMed] [Google Scholar]
- Rothbart SB, Racanelli AC, Moran RG. (2010) Pemetrexed indirectly activates the metabolic kinase AMPK in human carcinomas. Cancer Res 70:10299–10309. [DOI] [PMC free article] [PubMed] [Google Scholar]
- Royer GP, Ikeda SI, Lee TK. (1977) Substrate-induced conformational changes in lactate dehydrogenase. Proteolysis of the immobilized enzyme in the presence of specific substrates. J Biol Chem 252:8775–8777. [PubMed] [Google Scholar]
- Schoumacher RA, Ram J, Iannuzzi MC, Bradbury NA, Wallace RW, Hon CT, Kelly DR, Schmid SM, Gelder FB, Rado TA, et al. (1990) A cystic fibrosis pancreatic adenocarcinoma cell line. Proc Natl Acad Sci USA 87:4012–4016. [DOI] [PMC free article] [PubMed] [Google Scholar]
- Shane B. (1989) Folylpolyglutamate synthesis and role in the regulation of one-carbon metabolism. Vitam Horm 45:263–335. [DOI] [PubMed] [Google Scholar]
- Stubbs M, McSheehy PMJ, Griffiths JR, Bashford CL. (2000) Causes and consequences of tumour acidity and implications for treatment. Mol Med Today 6:15–19. [DOI] [PubMed] [Google Scholar]
- Subhi AL, Tang B, Balsara BR, Altomare DA, Testa JR, Cooper HS, Hoffman JP, Meropol NJ, Kruger WD. (2004) Loss of methylthioadenosine phosphorylase and elevated ornithine decarboxylase is common in pancreatic cancer. Clin Cancer Res 10:7290–7296. [DOI] [PubMed] [Google Scholar]
- Tan MH, Nowak NJ, Loor R, Ochi H, Sandberg AA, Lopez C, Pickren JW, Berjian R, Douglass HO, Jr, Chu TM. (1986) Characterization of a new primary human pancreatic tumor line. Cancer Invest 4:15–23. [DOI] [PubMed] [Google Scholar]
- Tibbetts AS, Appling DR. (2010) Compartmentalization of Mammalian folate-mediated one-carbon metabolism. Annu Rev Nutr 30:57–81. [DOI] [PubMed] [Google Scholar]
- Unal ES, Zhao R, Qiu A, Goldman ID. (2008) N-linked glycosylation and its impact on the electrophoretic mobility and function of the human proton-coupled folate transporter (HsPCFT). Biochim Biophys Acta 1778:1407–1414. [DOI] [PMC free article] [PubMed] [Google Scholar]
- Wang B, Wang W, Zhu Z, Zhang X, Tang F, Wang D, Liu X, Yan X, Zhuang H. (2017) Mitochondrial serine hydroxymethyltransferase 2 is a potential diagnostic and prognostic biomarker for human glioma. Clin Neurol Neurosurg 154:28–33. [DOI] [PubMed] [Google Scholar]
- Wang L, Desmoulin SK, Cherian C, Polin L, White K, Kushner J, Fulterer A, Chang M-H, Mitchell-Ryan S, Stout M, et al. (2011) Synthesis, biological, and antitumor activity of a highly potent 6-substituted pyrrolo[2,3-d]pyrimidine thienoyl antifolate inhibitor with proton-coupled folate transporter and folate receptor selectivity over the reduced folate carrier that inhibits β-glycinamide ribonucleotide formyltransferase. J Med Chem 54:7150–7164. [DOI] [PMC free article] [PubMed] [Google Scholar]
- Wang L, Wallace A, Raghavan S, Deis SM, Wilson MR, Yang S, Polin L, White K, Kushner J, Orr S, et al. (2015) 6-Substituted pyrrolo[2,3-d]pyrimidine thienoyl regioisomers as targeted antifolates for folate receptor α and the proton-coupled folate transporter in human tumors. J Med Chem 58:6938–6959. [DOI] [PMC free article] [PubMed] [Google Scholar]
- Wong SC, Proefke SA, Bhushan A, Matherly LH. (1995) Isolation of human cDNAs that restore methotrexate sensitivity and reduced folate carrier activity in methotrexate transport-defective Chinese hamster ovary cells. J Biol Chem 270:17468–17475. [DOI] [PubMed] [Google Scholar]
- Wu M, Arimura GK, Yunis AA. (1977) Purification and characterization of a plasminogen activator secreted by cultured human pancreatic carcinoma cells. Biochemistry 16:1908–1913. [DOI] [PubMed] [Google Scholar]
- Wu M, Wanggou S, Li X, Liu Q, Xie Y. (2017) Overexpression of mitochondrial serine hydroxyl-methyltransferase 2 is associated with poor prognosis and promotes cell proliferation and invasion in gliomas. OncoTargets Ther 10:3781–3788. [DOI] [PMC free article] [PubMed] [Google Scholar]
- Yang M, Vousden KH. (2016) Serine and one-carbon metabolism in cancer. Nat Rev Cancer 16:650–662. [DOI] [PubMed] [Google Scholar]
- Ye J, Fan J, Venneti S, Wan YW, Pawel BR, Zhang J, Finley LW, Lu C, Lindsten T, Cross JR, et al. (2014) Serine catabolism regulates mitochondrial redox control during hypoxia. Cancer Discov 4:1406–1417. [DOI] [PMC free article] [PubMed] [Google Scholar]
- Zhang C, Samanta D, Lu H, Bullen JW, Zhang H, Chen I, He X, Semenza GL. (2016a) Hypoxia induces the breast cancer stem cell phenotype by HIF-dependent and ALKBH5-mediated m6A-demethylation of NANOG mRNA. Proc Natl Acad Sci USA 113:E2047–E2056. [DOI] [PMC free article] [PubMed] [Google Scholar]
- Zhang L, Chen Z, Xue D, Zhang Q, Liu X, Luh F, Hong L, Zhang H, Pan F, Liu Y, et al. (2016b) Prognostic and therapeutic value of mitochondrial serine hydroxyl-methyltransferase 2 as a breast cancer biomarker. Oncol Rep 36:2489–2500. [DOI] [PMC free article] [PubMed] [Google Scholar]
- Zhao R, Diop-Bove N, Visentin M, Goldman ID. (2011) Mechanisms of membrane transport of folates into cells and across epithelia. Annu Rev Nutr 31:177–201. [DOI] [PMC free article] [PubMed] [Google Scholar]
- Zhao R, Min SH, Wang Y, Campanella E, Low PS, Goldman ID. (2009) A role for the proton-coupled folate transporter (PCFT-SLC46A1) in folate receptor-mediated endocytosis. J Biol Chem 284 (7):4267–4274. [DOI] [PMC free article] [PubMed] [Google Scholar]
- Zheng Y, Lin TY, Lee G, Paddock MN, Momb J, Cheng Z, Li Q, Fei DL, Stein BD, Ramsamooj S, et al. (2018) Mitochondrial one-carbon pathway supports cytosolic folate integrity in cancer cells. Cell 175 (6):1546–1560.e17. [DOI] [PMC free article] [PubMed] [Google Scholar]