Abstract
Knowledge of the distribution of the aspect ratios (ARs) in a chemically-synthesized colloidal solution of Gold Nano Rods (GNRs) is an important measure in determining the quality of synthesis, and consequently the performance of the GNRs generated for various applications. In this work, an algorithm has been developed based on the Bellman Principle of Optimality to readily determine the AR distribution of synthesized GNRs in colloidal solutions. This is achieved by theoretically fitting the longitudinal plasmon resonance of GNRs obtained by UV-visible spectroscopy. The AR distribution obtained from the use of the algorithm developed have shown good agreement with those theoretically generated one as well as with the previously reported results. After bench-marking, the algorithm has been applied to determine the mean and standard deviation of the AR distribution of two GNRs solutions synthesized and examined in this work. The comparison with experimentally derived results from the use of expensive Transmission Electron Microscopic images and Dynamic Light Scattering technique shows that the algorithm developed offers a fast and thus potentially cost-effective solution to determine the quality of the synthesized GNRs specifically needed for many potential applications for the advanced sensor systems.
Subject terms: Characterization and analytical techniques, Optical spectroscopy
Introduction
Gold Nano Rods (GNRs), due to their asymmetric structure and unlike other symmetrical Gold Nanoparticles (GNPs) such as spheres, shells, cages and cubes exhibit two plasmonic resonances1. The plasmonic resonance corresponding to the shorter wavelength (around 520 nm), known as the Transverse Resonance (TR), arises due to the collective oscillation of free electrons in the presence of an external electromagnetic field along the transverse dimension of the GNRs whereas, the resonance at the longer wavelength, known as Longitudinal Resonance (LR), is due to the oscillation of free electrons along the longitudinal dimension. Due to the dependence of the position of the LR on their Aspect Ratio (the length (L) divided by the width (W) and designated here by AR) and the external refractive index, supported by well understood surface chemistry2–5, GNRs have found applications in a wide variety of fields which are as diverse as biomedical sciences6–9, sensor development10–12, imaging13,14 and electronics-based applications such as LEDs15 and solar cells16 development.
‘Bottom-up’ synthesis methods such as the seeded method17, the electrochemical reduction method18 or photochemical reduction19 of GNRs generally produce poly-dispersed solutions with various ARs of the GNRs. Therefore, knowing the distribution of the ARs in the synthesized colloidal solution is important as it reveals the quality of the solution and hence its potential to be used in many possible applications. For example, it is important to have a narrow size distribution in solution for uniform and long self-assemblies of GNRs20. In this regard, Transmission Electron Microscopy (TEM) provides a very effective means for determining the actual size of the GNRs but obtaining a statistically accurate size distribution of the colloidal solution is difficult because of the limited numbers of GNRs spanning over a few selected images which are used to calculate the average AR. Further, GNRs tend to ‘self-sort’ based on their sizes and shapes while drying on the TEM grid and therefore the selection of the position for imaging become important21. The measurement of even hundreds of GNRs from TEM images is an onerous process and most importantly, TEM devices are not readily accessible to all research groups. In recent years, use of Dynamic Light Scattering (DLS) techniques have been introduced to determine the size distribution of nanoparticles but this approach is limited to spherical particles and it cannot be used for anisotropic particles, such as GNRs.
In previous work, Eustis & Sayed22 have demonstrated that Mie-Gans theory could be used to determine the distribution of ARs in a given solution, by theoretically fitting the inhomogeneously-broadened LR absorption spectrum obtained using UV-Visible spectrometer. However, the fitting technique used was manual and therefore very cumbersome. Further, all the fittings employed were based on the assumption that the solvent used was pure deionized water and therefore the effect of contamination or impurities in the solvent were ignored. In this work, these important drawbacks are addressed by developing an algorithm based on the Bellman Principle of Optimality, to automate the curve-fitting process. The effect of the external medium was considered by taking into account the dielectric constant, , of the solvent, while the fitting process was undertaken.
Background theory and Algorithm formulation
According to the modified Gans Model23, the absorption coefficient () of the GNRs in the colloidal solution considered is given by Eq. 1.
| 1 |
where,
| 2 |
| 3 |
and
| 4 |
In the above equations, , and are dependent on the shape of the GNRs as they also depend on the variable, , which in turn is an inverse function of the AR, i.e. the ratio of the length (L) to width (W). N is number of GNRs per unit volume, V is the volume per particle, is the wavelength, is the dielectric constant of the surrounding medium and and represent respectively the real and imaginary parts of the permittivity for the gold used.
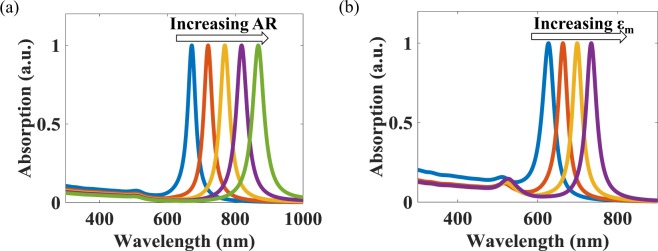
In this work, the permittivity of the gold used was calculated by interpolating the data given by Johnson & Cristy24. Using an approach that is similar to that seen in the previous work, as reported by Eustis & Sayed. in22, V is considered as a constant, as, the average volume of the GNRs remains constant across the ARs in most of the seed synthesis methods. Figure 1(a,b) show the modelled dependence of the AR and respectively on the LR, obtained by using Eq. 1 for arbitrary chosen value of and AR. In Fig. 1(a), while studying the effect of AR, was kept constant at 1.77. Similarly, in Fig. 1(b), the effect of was observed for a fixed value of AR = 2.5. It can be seen from both figures that, with the increase in the AR and , LR shows a significant red wavelength shift.
Figure 1.
Self-normalized modelled absorption spectra showing the red shift in the Longitudinal Plasmon Resonance due to an increase in (a) the Aspect Ratio (AR) and (b) the Permittivity of the surrounding medium ().
The first step in automating the theoretical fitting to the experimentally obtained value of LR is to rearrange and thus represent the absorption coefficient seen in Eq. 1, as the product of two variables, as shown in Eq. 5. The first variable (), contains all the size and frequency dependent terms (as shown in Eq. 6), whereas the second variable () is the number of particles per unit volume of a given AR.
| 5 |
where,
| 6 |
In the self-normalized absorption spectrum of a poly-disperse colloidal solution, the value of varies from 0 and 1, thus indicating the contribution of GNRs of a particular AR in the total absorption. The equal to 0 shows that the solution is devoid of GNRs of a given AR, whereas equal to 1 indicates the mono-dispersed GNRs solution. Therefore, for a poly-dispersed colloidal solution having “” varieties of ARs, the resultant absorption, at a given wavelength, say (), is the cumulative effect of the contribution of the individual ARs. Mathematically, this can be represented as shown by Eq. 7:
| 7 |
where, is the absorption of the AR at , assuming is 1, i.e. the absorption of a mono-dispersed GNRs solution with respect to the AR GNRs. This is calculated using Eq. 6, for given at = 1.77. is the actual contribution of a AR, and, unknown in the present case. is the experimentally obtained value of the absorption at , obtained using an analysis of UV-Vis spectrum of a chemically-synthesized colloidal solution.
Spanning over the entire LR wavelength range i.e. 615 nm, in steps will constitute an over-determined set of linear equations (with variables, equations; where ). This set of over-determined equations in the matrix notation can then be expressed as:
| 8 |
Equation 8, being over-determined in nature, cannot be solved to find the exact values of . Nevertheless, the value closest to the solution, represented by , can be found by using a Least Squares Approximation (LSA), employing Eq. 9, where () and () represent respectively the transpose and inverse of the matrix 25.
| 9 |
However, the LSA may result in non-physical values of , such as negative values and/or those greater than unity. Therefore their optimal physical values i.e. those lying between 0 and 1, are found using Bellman’s dynamic programming Principle of Optimality (BPO)26.
Using BPO, whatever the value of a given element of , say , is chosen, the calculated values of the remaining elements of will be optimal with respect to the chosen value of . This ensures that each set of values (for every ) is optimized and therefore, out of all the chosen values of , the value that yields the least fitting error will be the optimal value. Mathematically, to find the optimal value of lying between 0 and 1, it is varied between 0 to 1, using a step size of 0.001. For each step value, is multiplied by the first row of in Eq. 8 and shifted to the right-hand side, represented by in Eq. 10. This operation modifies Eq. 8 to give Eq. 11, where , and are the truncated versions of , and respectively.
| 10 |
| 11 |
In shorthand notation, the truncated matrices of Eq. 11 can be written as,
| 12 |
The closest unconstrained optimal values of using the LSA, the corresponding Error () and Summed Square Error (SSE) are found using the following set of equations:
| 13 |
| 14 |
| 15 |
The SSE can be calculated for all the step values of and among them, the one which gives the least SSE is taken as the optimized value of , represented by . Since, in calculating , all the unconstrained possibilities of to are considered, there is no need to recalculate the value of while calculating their optimal values. For example, to calculate the optimal value of , it is varied between 0 to 1 with a step size of 0.001. Since, has already been calculated in the previous step, for each step value of , the first row of A (in Eq. 8) is multiplied by , the second row is multiplied by and shifted to the right-hand side, i.e. subtracted from , as shown in Eq. 16. This operation will reduce the matrices , , in Eq. 8 to , , respectively, as shown in Eq. 17.
| 16 |
| 17 |
The unconstrained value of using the LSA, and the SSE corresponding to each step is found following the steps taken and shown in Eqs 13–15 and the resultant value that then gives a minimum value of the SSE is selected as the optimal value of . Similarly, in calculating , and are kept equal to the optimal values found from the previous step. Likewise, after calculating all the values of , i.e. to , the final resultant (fitted) curve is obtained by post multiplying it by , as per Eq. 8.
In order to determine the effect of the solvent on the process, the fitted curve for taking values from 1.77 to 2.3 with a step size of 0.05 is generated following the above procedure. The error and SSE values determined from the experimental and the fitted curve ( = ; SSE = ) are calculated for all the step values of and among them, the value of giving the minimum SSE is selected to generate the final fitted curve. The value of corresponding to the final fitted curve is taken as the contribution of the individual ARs.
The algorithm was coded in MATLAB27 and the source-code is provided in the Supplementary Material.
Results and Discussions
Comparison with TEM measurement
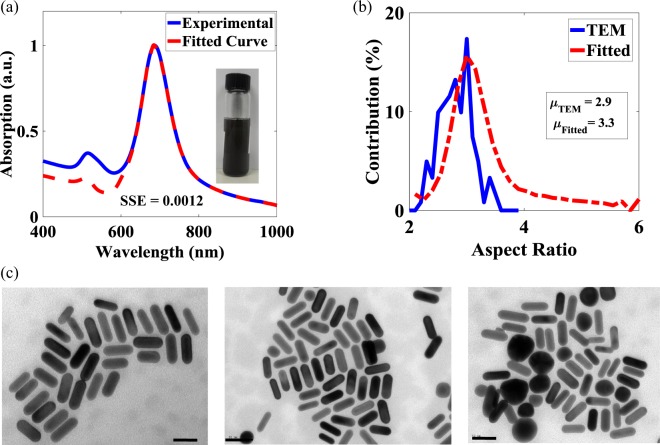
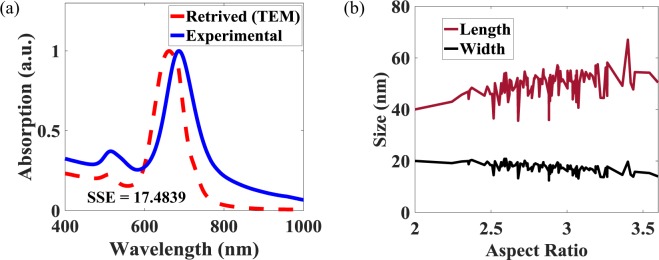
The experimental validation of the algorithm developed was performed by comparing the AR distribution obtained from the use of the algorithm with that obtained by by manually measuring 121 GNRs from TEM images captured at three different places on the TEM grid. Figure 2(a) shows an experimentally-obtained UV-Vis spectrum and the absorption spectrum obtained by fitting an experimental data points in the LR region. As it can be seen from the figure, both graphs match well (SSE = 0.0012) in the LR region. Further, a picture of the actual synthesized colloidal solution is shown in the inset. The black color of the solution indicates the presence of a low number of GNPs. Figure 2(b) shows the distribution of the ARs obtained by measuring GNRs from TEM images and those obtained from the use of algorithm whereas, Fig. 2(c) shows the corresponding TEM images used for the ARs measurements. It can be seen in Fig. 2(b) that, the algorithm used correctly predicted the most probable AR, the value of which is 3. However, the overall AR distribution obtained from the TEM images is shifted towards lower ARs and consequently, the mean value of the distribution obtained by the use of TEM is lower than that of the obtained from developed algorithm ( = 2.9; = 3.3). This mismatch is due to the inability of the TEM to examine the macroscopic volume in comparison to using longitudinal plasmon resonance of UV-Vis spectrum, which is very much sensitive to the macroscopic ARs distribution seen in the colloidal solution. To corroborate the above claim, the UV-Vis spectrum was reconstructed by substituting the contribution obtained from TEM measurement in Eq. 8, matching it with the experimentally-obtained UV-Vis spectrum. As shown in Fig. 3(a), UV-Vis spectrum retrieved using the TEM measurements deviates significantly from the experimental UV-Vis spectrum ( = 17.4839 is much larger than the value obtained from the algorithm = 0.0012). The inability to obtain a statistically accurate AR distribution from the TEM measurement was also reported by Eustis & Sayed22 for 5 different samples, showing longitudinal resonance around 630 nm, 700 nm, 850 nm, 900 nm & 1000 nm. In this work, these UV-Vis spectra have been reconstructed after extracting data using a Webplot digitizer28, followed by the use of the algorithm developed to calculate the AR distribution. (As shown in the Supplementary Fig. 1, there is good agreement between the AR distributions obtained by Eustis & Sayed22 and that of this work. This further validate the reliability of the developed algorithm).
Figure 2.
(a) The UV-Vis absorption spectrum of the chemically synthesized sample (solid line) and the spectrum obtained by fitting the longitudinal resonance (dash line). Inset is shown a photograph of the GNRs solution (b) AR distributions curve obtained through the measurement with the TEM images measurement (solid line) and fitting of The UV-Vis spectrum (dashed line). The legend shows the mean value for both graphs. (c) TEM images taken at three different places on the TEM grid. The scale bar represents 50 nm.
Figure 3.
(a) The UV-Vis absorption spectrum of the chemically synthesized sample (solid line) compared with spectrum retrieved from AR distribution obtained from TEM measurement (dashed line). (b) Dependence of length and width of GNRs on AR obtained from TEM measurement.
It is important to note that due to the growth kinematics of seed-based synthesis, an AR cannot have a limitless combination of length and width, because of the same average volume of GNRs for a given colloidal solution4,22. Therefore, any increase in the AR is caused by an increase in length and a correlated decrease in the width, as can be seen from the TEM measurements of the GNRs described in Fig. 3(b).
Comparison with DLS measurement
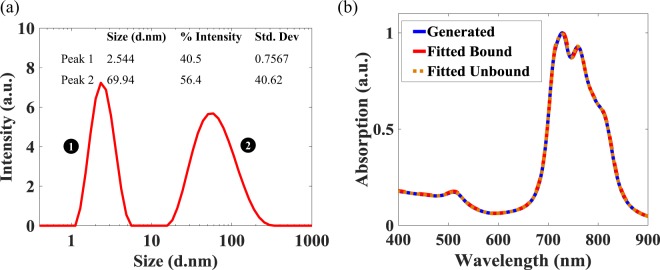
The size distribution of the chemically synthesized sample obtained from DLS measurement is shown in Fig. 4(a). It can be seen from the graph that the DLS measurement reports two peaks centered around 2.544 nm and 69.94 nm. The first peak can be attributed to seed GNPs which could not grow due to insufficient amount of gold in the growth solution, whereas second peak accounts for fully developed GNRs and GNPs. Since, DLS gives the size distribution with respect to the hydrodynamic radius, i.e. the radius of an equivalent sphere having same diffusion coefficient, it is difficult to obtained the AR distribution from the graph shown, especially when spherical and cubic gold impurities are present in the colloidal solution. For example, few spherical GNPs impurities can be seen in right-hand TEM image, shown in Fig. 2(c). The inability of DLS to distinguish shape makes it unsuitable to measure the AR distribution. In contrast to the DLS measurement, the algorithm developed here is unaffected by the presence of large spherical GNPs impurities, because they do not exhibit a LR.
Figure 4.
(a) Size Distribution of chemically synthesized GNRs obtained by using the DLS technique (b) Quality of the fitting of the Absorption spectra generated by the test program, obtained by fitting the generated curve with the bounded and the unbounded coefficients.
The algorithm developed was further benchmarked with the results of a numerical technique, as described in the next subsection, to circumvent the limitations discussed above and associated with the TEM and DLS measurements.
Theoretical bench-marking of the Algorithm
For the effective theoretical bench-marking of the algorithm developed, the absorption spectrum, resembling that of a chemically synthesized poly-dispersed colloidal solution, was generated numerically from the combination of 11 GNRs samples having AR values ranging between 3 and 4 (with a regular interval of 0.1), using Eq. 8. In Eq. 8, was randomly generated by the use of an in-built random function generator on MATLAB27 and was generated from Eq. 6 over the wavelength range from 400 to 900 nm, with a step size of 1 nm, at = 2.1.
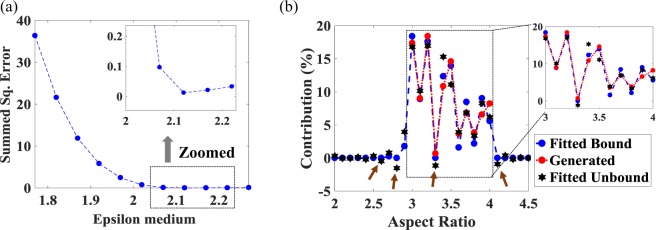
The spectrum generated was input to the algorithm developed to retrieve the value of and the corresponding (bounded) values of . Further, to validate the point mentioned in the previous section i.e. solving the over-determined set of linear equations without any constrain may result in non-physical values, the LSA technique was used to obtained the unbounded values of . Both the unbounded and bounded values of were cross-compared with the known input (randomly generated) values of to determine the accuracy of the methods used. Figure 4(b) shows the generated and retrieved absorption spectra. It can be seen from this that all three spectra i.e. the generated spectrum and the spectra obtained using the developed algorithm and LSA match very closely at = 2.12. The value of = 2.12 was obtained by analyzing the variation of the values of the SSE with respect to , as shown in Fig. 5(a). The minimum SSE value was obtained at = 2.12 (and this is shown in the inset). It matches very well with the value of = 2.1 used for generating the input spectrum.
Figure 5.
(a) Fitted SSE as function of for the bounded coefficients. Inset shows the obtained minimum SSE for = 2.12. (b) Left: the figure compares the generated (test) AR contribution with that generated by the algorithm for the bounded and unbounded coefficients. Right: ‘Zooming in’ on the 3 AR 4 region from the main (Left) figure.
Figure 5(b) shows the input and retrieved values (i.e the contribution), of , represented as a percentage, for different values of AR. The blue solid spheres shows the value of the contribution obtained from the developed (bounded) algorithm. It can be seen from the figure that, outside the input regime i.e. AR 3 & AR 4, the developed algorithm correctly predicted the absence of any GNRs (i.e. a zero contribution) whereas for 3 AR 4, the values obtained from the algorithm are in good agreement with the input values (represented by the red solid spheres), as shown in zoomed right-hand figure and from Table 1. However, if the contributions obtained from the LSE is considered (shown by black stars in the main and the zoomed figure), it gives a negatives contribution for some values of the AR, as indicated by brown arrows in Fig. 5(b). Moreover, as given in Table 1, the SSE obtained from the Fitted Bound is much lower than the SSE obtained from Fitted Unbound situation ( = 1.833; = 7.59).This result shows that the algorithm which has been developed is capable of correctly retrieving the contribution from the UV-Vis absorption spectrum of the poly-dispersed colloidal solution.
Table 1.
AR and corresponding contribution obtained from Generated, Fitted Bound, & Fitted Unbound techniques
| AR | Generated | Fitted Bound | Error | Fitted Unbound | Error |
|---|---|---|---|---|---|
| 3 | 17.17 | 18.39 | 0.059 | 16.8 | |
| 3.1 | 9.008 | 8.9 | 10.14 | 0.1257 | |
| 3.2 | 18.41 | 17.6 | 16.98 | ||
| 3.3 | 0.6756 | 0 | |||
| 3.4 | 10.84 | 12.34 | 0.138 | 15.3 | 0.4114 |
| 3.5 | 14.59 | 13.92 | 11.11 | ||
| 3.6 | 3.651 | 1.582 | 3.916 | 0.0726 | |
| 3.7 | 6.852 | 8.465 | 0.235 | 6.849 | |
| 3.8 | 3.822 | 2.176 | 3.375 | ||
| 3.9 | 6.555 | 9.019 | 0.376 | 8.284 | 0.2638 |
| 4 | 8.223 | 5.578 | 6.184 | ||
| SSE | 1.833 | 7.59 | |||
Application on additional synthesized samples
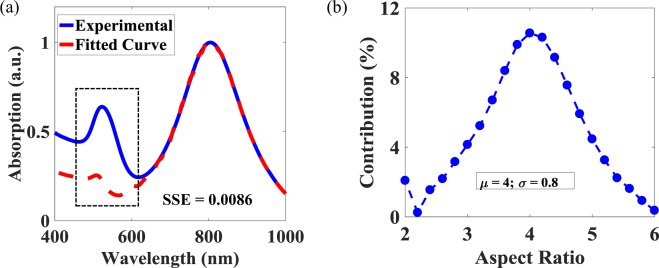
After benchmarking, the bounded technique was used to determine the AR distributions in two further chemically-synthesized samples. Figure 6(a) shows the LR fitting used in the case of a sample having well-separated LR and TR peaks. As can be seen from the figure, in the LR regime i.e. where the wavelength is 615 nm, the fitted curve matches closely the experimentally-obtained absorption spectrum (SSE = 0.0086). Since, only the LR is used to obtain the contribution (as a percentage) of the individual ARs, extending the fitted spectrum to the TR spectral region (which is less than the wavelength of 615 nm) will give the ideal spectrum, i.e. the spectrum obtained in the absence of the GNPs (1 AR 2). Therefore, the mismatch in the TR regime between the fitted and the experimental curves can be used to visualize quantitatively the magnitude of the GNPs present in the colloidal solution, as shown as the dotted region in Fig. 6(a). This can be described as, in the absence of any GNPs, the experimental and the fitted curves would be matched closely around the TR as well. From the mismatch at the TR in Fig. 6(a), it can be concluded that a significant number of GNPs are present in the solution. Figure 6(b) shows the contribution (again as a percentage) of the AR present, where the calculated mean () AR of the solution is 4, with a standard deviation () of 0.8.
Figure 6.
(a) The absorption spectra of chemically-synthesized sample (solid line), juxtaposed with the spectra obtained by fitting the longitudinal resonance (dashed line). The dotted section highlights the mismatch around transverse resonance. (b) AR distributions curve. The legend shows mean value and standard deviation. For both graphs, was used.
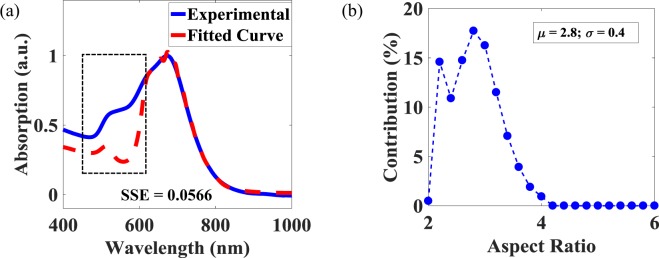
Figure 7(a) shows the quality of the curve fitting in the case of a solution where the TR and the LR cannot readily be distinguished. It can be seen that for a wavelength 615 nm, the theoretical curve fits well to the experimentally obtained spectrum. The mismatch between the fitted and the experimental curves around the TR, as illustrated by the dotted section on the graph, shows the presence of the large amount of GNPs. Figure 7(b) shows the AR contributions and, as expected, by comparison to an analysis of the previous colloidal solution, this solution has an abundance of less elongated GNRs ( = 2.8; = 0.4) and the amount of GNRs seen with an AR value greater than 4.2 is almost zero.
Figure 7.
(a) Measured (solid line) and fitted (dashed line) absorption spectra, for a low AR sample. Dotted section qualitatively highlights the amount of particles having AR 2. (b) Contribution of various AR values to obtain the fitted curve in (a). The SSE was a minimum for .
Conclusion
The research carried out has shown that the algorithm developed in this paper using Bellman’s dynamic technique is an effective approach for the rapid determination of the AR distribution of a synthesized GNRs colloidal solution by theoretically fitting the LR regime of the absorption spectrum. The developed algorithm, after numerical and experimental benchmarking, was applied additionally to two in-house synthesized solutions to determine the mean and standard deviations of the ARs. This technique has been shown to give both a cost-effective and rapid way to determine the quality of the synthesized solution as it avoids the need for more expensive TEM analysis of all of the samples synthesized .
Methods
Chemical synthesis
GNRs were synthesized by using the seed-mediated method reported by Jie Cao et al.29. In brief, the seed solution was prepared by reducing a solution containing 5 mL of 0.2 M Cetyltrimethylammonium Bromide (CTAB) and 5 mL of 0.5 mM , with 600 L of 0.01 M ice-cold . After stirring the solution for an additional 2 minutes at 900 rpm, the seed solution was left undisturbed for 3 hours.
The growth solution was prepared by mixing a known amount of 20 mM solution, 30 mL of 0.2 M CTAB solution and 30 mL of 1 mM in the same sequence. To the mixed solution, 420 L of 0.0788 M ascorbic acid solution was added, while stirring at 350 rpm. This step will change the colour of solution from bright yellow to colorless. Further, 100 L of seed solution was added to the growth solution and the resulting solution was left undisturbed for 12 hours. Since CTAB is insoluble in deionized (DI) water at room temperature, all the synthesis steps were performed in a water bath maintained at a constant temperature of .
The excess of CTAB present in the GNR solution was removed by using two rounds of centrifugation at 3700g for 20 min for each round. After each round, the supernatant was decanted and the GNRs deposited at the bottom of the centrifuge tube were re-dispersed in the same quantity of DI water.
Characterization
The absorption spectra of the GNRs solutions were measured by using a LAMBDA 35 UV-Vis spectrometer (Perkin Elmer Inc.) monitoring over the wavelength range from 400 nm to 1000 nm, in steps of 1 nm. The TEM images were taken from JEOL at accelerating voltages of 80kV and yielding 400k magnification. The dimensions of the GNRs from the TEM images were measure using ImageJ, which is an open source image processing software inspired by NIH image30. The DLS measurement was performed using a ZetaSizer Nano ZEN 3600 (Malvern Instrument).
Supplementary information
Acknowledgements
The authors thank the Center for Nanoscale Biophotonics, Australia for useful technical discussions and Mark Turmaine of University College London for undertaking TEM characterization. Kenneth TV Grattan acknowledges the support of the George Daniels Educational Trust and both he and Tong Sun acknowledge funding from the Royal Academy of Engineering.
Author contributions
R.K. did the modelling, synthesis, UV-Vis characterization and wrote the manuscript. T.H.N. assisted in synthesis of gold nano rods. L.B. & L.A. performed DLS measurement. A.A. helped in algorithm development. T.S. and K.G. supervised the research. All authors discussed the results and reviewed the manuscript.
Data availability
Data will be provided on reasonable request. MATLAB source-code is given in the Supplementary Information.
Competing interests
Authors declare no competing interests.
Footnotes
Publisher’s note Springer Nature remains neutral with regard to jurisdictional claims in published maps and institutional affiliations.
Supplementary information
is available for this paper at 10.1038/s41598-019-53621-4.
References
- 1.Hu M, et al. Gold nanostructures: engineering their plasmonic properties for biomedical applications. Chemical Society Reviews. 2006;35:1084–1094. doi: 10.1039/b517615h. [DOI] [PubMed] [Google Scholar]
- 2.Burrows ND, et al. Surface chemistry of gold nanorods. Langmuir. 2016;32:9905–9921. doi: 10.1021/acs.langmuir.6b02706. [DOI] [PubMed] [Google Scholar]
- 3.Pérez-Juste J, Pastoriza-Santos I, Liz-Marzán LM, Mulvaney P. Gold nanorods: synthesis, characterization and applications. Coordination Chemistry Reviews. 2005;249:1870–1901. doi: 10.1016/j.ccr.2005.01.030. [DOI] [Google Scholar]
- 4.Park K, et al. Growth mechanism of gold nanorods. Chemistry of Materials. 2013;25:555–563. doi: 10.1021/cm303659q. [DOI] [Google Scholar]
- 5.Kitamura T, Niidome Y. Colloidal dispersion of gold nanorods and gold-silver core-shell nanorods in polar organic solvents. Bulletin of the Chemical Society of Japan. 2017;90:161–168. doi: 10.1246/bcsj.20160297. [DOI] [Google Scholar]
- 6.Jang B, Park J-Y, Tung C-H, Kim I-H, Choi Y. Gold nanorod- photosensitizer complex for near-infrared fluorescence imaging and photodynamic/photothermal therapy in vivo. ACS nano. 2011;5:1086–1094. doi: 10.1021/nn102722z. [DOI] [PubMed] [Google Scholar]
- 7.Abadeer NS, Murphy CJ. Recent progress in cancer thermal therapy using gold nanoparticles. The Journal of Physical Chemistry C. 2016;120:4691–4716. doi: 10.1021/acs.jpcc.5b11232. [DOI] [Google Scholar]
- 8.Elahi N, Kamali M, Baghersad MH. Recent biomedical applications of gold nanoparticles: A review. Talanta. 2018;184:537–556. doi: 10.1016/j.talanta.2018.02.088. [DOI] [PubMed] [Google Scholar]
- 9.Murphy, C. J. et al. Virus-sized gold nanorods: Plasmonic particles for biology. Accounts of chemical research (2019). [DOI] [PMC free article] [PubMed]
- 10.Cao J, Galbraith EK, Sun T, Grattan KT. Cross-comparison of surface plasmon resonance-based optical fiber sensors with different coating structures. IEEE Sensors Journal. 2012;12:2355–2361. doi: 10.1109/JSEN.2012.2188713. [DOI] [Google Scholar]
- 11.Lu X, Tao L, Song D, Li Y, Gao F. Bimetallic pd@ au nanorods based ultrasensitive acetylcholinesterase biosensor for determination of organophosphate pesticides. Sensors and Actuators B: Chemical. 2018;255:2575–2581. doi: 10.1016/j.snb.2017.09.063. [DOI] [Google Scholar]
- 12.Martín-Sánchez C, et al. Monodisperse gold nanorods for high-pressure refractive index sensing. The journal of physical chemistry letters. 2019;10:1587–1593. doi: 10.1021/acs.jpclett.9b00636. [DOI] [PubMed] [Google Scholar]
- 13.Durr NJ, et al. Two-photon luminescence imaging of cancer cells using molecularly targeted gold nanorods. Nano letters. 2007;7:941–945. doi: 10.1021/nl062962v. [DOI] [PMC free article] [PubMed] [Google Scholar]
- 14.Chen Y-S, Zhao Y, Yoon SJ, Gambhir SS, Emelianov S. Miniature gold nanorods for photoacoustic molecular imaging in the second near-infrared optical window. Nature nanotechnology. 2019;14:465. doi: 10.1038/s41565-019-0392-3. [DOI] [PMC free article] [PubMed] [Google Scholar]
- 15.Rizzo A, et al. Polarized light emitting diode by long-range nanorod self-assembling on a water surface. Acs Nano. 2009;3:1506–1512. doi: 10.1021/nn900063m. [DOI] [PubMed] [Google Scholar]
- 16.Mubeen S, et al. On the plasmonic photovoltaic. ACS nano. 2014;8:6066–6073. doi: 10.1021/nn501379r. [DOI] [PubMed] [Google Scholar]
- 17.Nikoobakht B, El-Sayed MA. Preparation and growth mechanism of gold nanorods (nrs) using seed-mediated growth method. Chemistry of Materials. 2003;15:1957–1962. doi: 10.1021/cm020732l. [DOI] [Google Scholar]
- 18.Ji C, Searson PC. Synthesis and characterization of nanoporous gold nanowires. The Journal of Physical Chemistry B. 2003;107:4494–4499. doi: 10.1021/jp0222200. [DOI] [Google Scholar]
- 19.Esumi K, Matsuhisa K, Torigoe K. Preparation of rodlike gold particles by uv irradiation using cationic micelles as a template. Langmuir. 1995;11:3285–3287. doi: 10.1021/la00009a002. [DOI] [Google Scholar]
- 20.Nikoobakht B, Wang Z, El-Sayed M. Self-assembly of gold nanorods. The Journal of Physical Chemistry B. 2000;104:8635–8640. doi: 10.1021/jp001287p. [DOI] [Google Scholar]
- 21.Scarabelli, L., Sánchez-Iglesias, A., Pérez-Juste, J. & Liz-Marzán, L. M. A “tips and tricks” practical guide to the synthesis of gold nanorods (2015). [DOI] [PubMed]
- 22.Eustis S, El-Sayed MA. Determination of the aspect ratio statistical distribution of gold nanorods in solution from a theoretical fit of the observed inhomogeneously broadened longitudinal plasmon resonance absorption spectrum. Journal of Applied Physics. 2006;100:044324. doi: 10.1063/1.2244520. [DOI] [Google Scholar]
- 23.Link S, El-Sayed M. Simulation of the optical absorption spectra of gold nanorods as a function of their aspect ratio and the effect of the medium dielectric constant. The Journal of Physical Chemistry B. 2005;109:10531–10532. doi: 10.1021/jp058091f. [DOI] [Google Scholar]
- 24.Johnson PB, Christy R-W. Optical constants of the noble metals. Physical review B. 1972;6:4370. doi: 10.1103/PhysRevB.6.4370. [DOI] [Google Scholar]
- 25.Williams G. Overdetermined systems of linear equations. The American Mathematical Monthly. 1990;97:511–513. doi: 10.1080/00029890.1990.11995638. [DOI] [Google Scholar]
- 26.Das, S. Binary solutions for overdetermined systems of linear equations. arXiv preprint arXiv:1101.3056 (2011).
- 27.The Mathworks, Inc., Natick, Massachusetts. MATLAB version 9.1.0.441655 (R2016b) (2016).
- 28.Rohatgi, A. Webplotdigitizer, Version 4.2 (2019). https://automeris.io/WebPlotDigitizer (Accessed: August 2019).
- 29.Cao J, Galbraith EK, Sun T, Grattan KT. Effective surface modification of gold nanorods for localized surface plasmon resonance-based biosensors. Sensors and Actuators B: Chemical. 2012;169:360–367. doi: 10.1016/j.snb.2012.05.019. [DOI] [Google Scholar]
- 30.Rasband, W. Imagej, US National Institutes of Health, Bethesda, Maryland, USA (1997–2018), https://imagej.nih.gov/ij/ (Accessed: November 2018).
Associated Data
This section collects any data citations, data availability statements, or supplementary materials included in this article.
Supplementary Materials
Data Availability Statement
Data will be provided on reasonable request. MATLAB source-code is given in the Supplementary Information.


