

Correction to: Nature Communications, 10.1038/ncomms13700; published online 19 January 2017.
In this Article, there are errors in the presentation of western blots experiments affecting the different controls (GAPDH, tubulin, β-actin) in Figs. 2b, 5i, Supplementary Figs. 1d, 6d, e. In Supplementary Fig. 1d the Western blot bands of different days were inadvertently switched, and there is unrelated raw data in Supplementary Fig. 10. However, the raw data of all the control bands were correctly labeled in Supplementary Fig. 10 and the raw data for Supplementary Fig. 1d were correctly labeled in Supplementary Fig. 10. In detail, in Fig. 2b, the endogenous control lanes in the right panel were inadvertently mislabeled as GAPDH rather than β-actin. In Fig. 5i and Supplementary Fig. 6d, and its quantification in Supplementary Fig. 6e, the endogenous control lanes were inadvertently mislabeled as GAPDH rather than tubulin. In Supplementary Fig. 1d, Day 2 β-actin bands were inadvertently switched with Day 3 β-actin bands, and Day 5 β-actin bands were inadvertently used for Day 4 β-actin bands. The three leftmost bands in the raw data for Fig. 4m in Supplementary Fig. 10 are not for Fig. 4m or any other data in this article, and the IκB and p-IκB bands in the raw data for Supplementary Fig. 7b in Supplementary Fig. 10 are not for Supplementary Fig. 7b or any other data in this article. The corrected versions of Figs. 2, 5, Supplementary Figs. 1, 6, and 10 appear below as correction Figs. 1–5, respectively. The corrections do not affect our original scientific findings and conclusions. The errors have not been corrected in the PDF or HTML versions of the Article.
Fig. 3.

Bone density was decreased in osteoclast-lineage cell specific Gna13 deficient mice
Fig. 4.
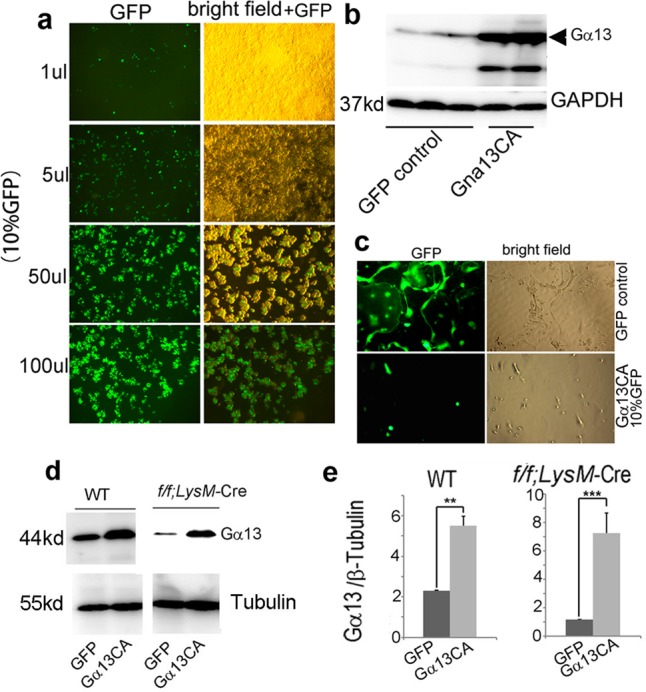
Analysis of the titer and expression of Gα13 overexpression lentivirus
Fig. 5.

Uncropped images for western blots
Fig. 1.

Osteoclast-specific Gna13-CKO mice displayed osteoporosis
Fig. 2.

Ga13 gain-of-function inhibits osteoclast formation and function in vitro
Contributor Information
Wei Chen, Email: wechen@uab.edu.
Yi-Ping Li, Email: ypli@uab.edu.