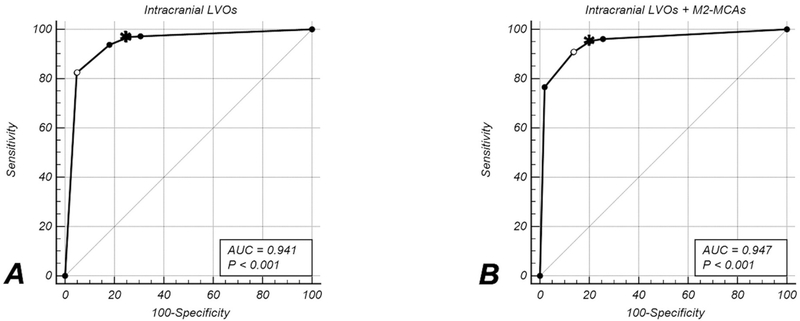
Figure 3 – ROC Analysis.
ROC curves for detection of all intracranial LVOs (A) and all intracranial LVOs and proximal M2-MCA segment occlusions (B). Dots on the ROC curve indicate individual threshold levels; the one with the lowest sensitivity and highest specifity is the <45% threshold whereas the highest sensitivity and lowest specificity were at the <80%–75% threshold. The open circle indicates the maximum Youden index. The asterisks indicate the threshold at with the ≥95% sensitivity target was reached with the highest specificity. The significance level in the legend indicates the p-value of the z-statistic derived from the DeLong algorithm.

