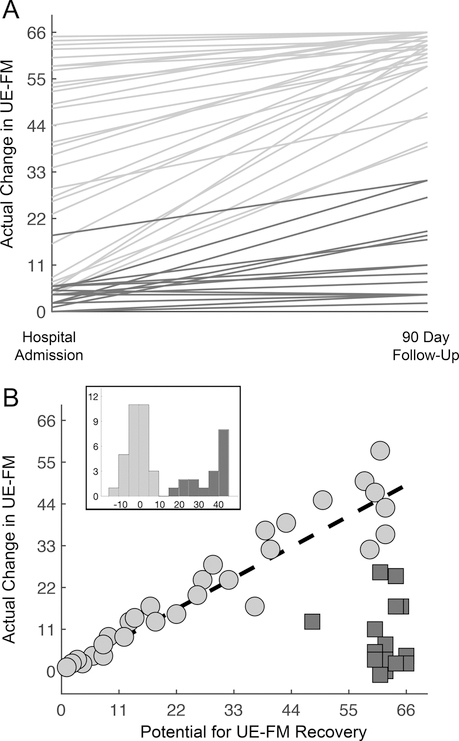
Figure 3.
Proportional and limited recoverers. (A) Upper extremity Fugl-Meyer (FM) recovery curves between hospital admission and 3-month follow-up for 48 patients with stroke. Note that in severe patients (FMInit < 22) there is a group with limited recovery (dark gray lines). (B) Potential for (66 – FMInit) versus actual (FM3mo – FMInit) recovery of upper extremity impairment. The line (black-dashed) represents the amount of recovery as predicted by the proportional recovery model (FMPredicted = 0.7 × FMPotential). Limited recoverers (dark gray squares) are distinguished from proportional recoverers by a model residual of greater than 10 from their 70% predicted recovery. The histogram inset shows the model residuals of proportional recoverers (light gray) and limited recoverers (dark gray).

