

Abstract
Introduction
The optimal time to initiate venous thromboembolism (VTE) chemoprophylaxis in blunt solid organ injury (BSOI) patients is debated. We hypothesize that 1) BSOI patients are hypercoagulable within 12 hours of injury and 2) hypercoagulability dominates in patients who develop clot complications (CC).
Material and methods
This is a prospective study of BSOI patients admitted to two Level-1 Trauma Centers’ trauma intensive care units (ICU). Serial kaolin thrombelastography (TEG) and tissue plasminogen activator (tPA)-challenge TEGs were performed. CC included VTE and cerebrovascular accidents.
Results
On ICU admission, all patients (n=95) were hypercoagulable, 58% were in fibrinolysis shutdown, and 50% of patients were tPA-resistant. Twelve patients (13%) developed CC. Compared to those without CC, they demonstrated decreased fibrinolysis at 12 hours and higher clot strength at 48 hours.
Conclusions
BSOI patients are universally hypercoagulable upon ICU admission. VTE chemoprophylaxis should be started immediately in BSOI patients with hypercoagulability on TEG.
Keywords: Blunt solid organ injury, thrombelastography, thrombosis, hypercoagulability
Summary
Blunt solid organ injury (BSOI) patients are universally hypercoagulable upon admission to the intensive care unit. Patients who develop thrombotic complications have significantly decreased fibrinolysis at 12 hours and increased clot strength at 48 hours. VTE chemoprophylaxis should be started immediately in BSOI patients with hypercoagulability on thrombelastography.
Introduction
Trauma-induced coagulopathy (TIC) is one of the leading causes of early preventable death following severe injury1. Characterized by multiple phenotypes, TIC is a dynamic process, with the majority of severely injured patients transitioning from an initial hypocoagulable state to a hypercoagulable state. This latter phenotype is marked by an increased risk of thrombotic morbidity2, with venous thromboembolism (VTE; including deep venous thrombosis [DVT] and pulmonary emboli [PE]) occurring in up to 50% of trauma patients without chemoprophylaxis3–5. However, the optimal time to initiate venous thromboembolism (VTE) chemoprophylaxis is an ongoing point of contention in the management of severely injured patients, particularly those with non-operatively managed blunt solid organ injury (BSOI). The benefit of mitigating thrombotic risk must be balanced against the risk of exacerbation of intracranial or intraabdominal hemorrhage leading to failed nonoperative management.
Both the timing of transition to hypercoagulability and the optimal timing of VTE chemoprophylaxis in BSOI patients remains to be agreed upon in the literature. Results of a Southwestern Surgical Congress Multicenter trial indicate that there is considerable variation in VTE chemoprophylaxis strategies across trauma centers6. Ideally, the decision to initiate VTE chemoprophylaxis should be based upon objective measurements of each patient’s coagulation status. Currently, thrombelastography (TEG) is the only whole blood point-of-care clinical assay that can identify hypercoagulability, and several studies have demonstrated hypercoagulability as defined by TEG correlates with the likelihood of subsequent VTEs in severely injured patients7,8.
Our prior work, consisting of a retrospective review of 42 nonoperative BSOI patients at our own institution, suggested that conversion to a hypercoagulable profile after injury occurs at 48 hours after admission9, a timepoint which has been described in other retrospective studies of changes in coagulation after injury2; however, this timing of conversion has yet to be validated through prospective study. Delineation of the timing of the transition to a hypercoagulable state among BSOI is essential to inform optimal VTE chemoprophylaxis strategies and attenuate the risk of thrombotic complications without concomitantly increasing the risk of bleeding leading to failure of non-operative management. The objective of this study is to prospectively identify the timing of transition to hypercoagulability (and validate our previous findings from retrospective study) as measured by serial viscoelastic assessment in BSOI patients and to identify sentinel signs of pathologic hypercoagulability on TEG which place a patient at increased risk of thrombotic morbidity. We hypothesize that 1) BSOI patients are hypercoagulable by 48 hours of injury and 2) this hypercoagulable profile dominates in patients who develop clot complications.
Material and methods
Study Design
This is a prospective observational study of BSOI patients admitted to two Level-1 Trauma Centers’ trauma intensive care units (ICU) from 2014–2018 (Denver Health Medical Center [DH], Denver, CO, and Intermountain Medical Center [IMC], Murray, UT). The study was approved by the Colorado Multiple Institution Review Board (COMIRB#13–2133) and performed under waiver of consent. Clinical data were collected by trained research professional assistants and included: age (years), sex, mechanism, body mass index (BMI, kg/m2), new injury severity score (NISS), field and hospital arrival systolic blood pressure (SBP, mm Hg), heart rate (beats per minute), Glasgow Coma Scale (GCS), INR, PTT, PT, fibrinogen, base deficit, as well as number of units of blood products transfused: red blood cells (RBCs), frozen plasma (FP24, plasma frozen within 24 hours of collection), platelets and cryoprecipitate and the volume of crystalloid infused. Traumatic brain injury (TBI) is defined as an abbreviated injury scale (AIS)-head ≥ 3.
Participants
Criteria for inclusion were adult trauma patients (≥18 years old) who were admitted to the ICU and selected for initial nonoperative management of their BSOI. The included institutions’ practices are to admit all patients with BSOI to the ICU regardless of grade and to pursue nonoperative management if the patient is hemodynamically stable and does not require more than four units of blood product transfusion in the first 24 hours for hepatic injuries or any blood product transfusion in the first 24 hours for splenic injuries; additionally, all grade IV and V splenic lacerations are prophylactically embolized. Exclusion criteria were any patients who are prisoners, pregnant, on therapeutic anticoagulation, taking nonsteroidal anti-inflammatory drugs (NSAIDs), with known coagulation disorders (including sickle cell disease and hemophilia), and/or selected initially for operative management.
Procedures
Blood was collected in citrated vacuum tubes (3.5 mL, 3.2% sodium citrate, Greiner Bio-One, Monroe, North Carolina) upon admission to the ICU and every 12 hours thereafter up to 108 hours. Citrated kaolin thrombelastography (CK-TEG) was performed at both sites per manufacturer instruction10 within one hour of venipuncture. Tissue plasminogen activator (tPA)-challenge TEGs (with 75 ng/mL tPA) were also performed at one site, as has previously been described11.
CK-TEG yields the following variables: reaction time (R; time elapsed from initiation of test until onset of clot formation, minutes), angle (rate of clot strength increase, degrees), maximum amplitude (MA; maximal clot strength achieved, millimeters) and percent clot lysis 30 minutes after reaching MA (LY30, %)12. R has been correlated with coagulation factor activity and thrombin generation, angle with fibrinogen concentration and function, MA with platelet and fibrin interactions and LY30 with fibrinolysis13. LY30, regardless of assay, due to its multimodal distribution, was expressed as three categories, as previously published14,15: fibrinolysis shutdown (<0.6%), physiologic (0.6–7.6%), and hyperfibrinolysis (≥7.7%). Response to 75 ng/mL tPA defined tPA-resistant (LY30 < 1.8%), mixed (LY30 1.8–27.7%) and tPA-sensitive (LY30 > 27.7%). Hypercoagulability was defined by a TEG measurement resulting outside of the 95% confidence interval for healthy volunteers, specifically with an R < 6.6 min (95% confidence interval [CI] 6.6–11.7), angle > 66.7 degrees (95% CI 50.3–66.7), MA > 69.0 mm (95% CI 54.5–69.0) and/or fibrinolytic shutdown as aforementioned. Clot complications included VTE (including deep venous thromboses [DVT] and pulmonary emboli [PE]) or cerebrovascular accidents (CVA). PE was diagnosed by computerized tomography (CT) angiography of the chest, and DVT was determined by venous duplex ultrasound in symptomatic or high-risk patients. Per current guidelines16, our institution does not routinely survey patients for VTEs; only symptomatic or high-risk patients are submitted to clinical investigation. CVA were diagnosed by head CT and/or magnetic resonance imaging (MRI).
Statistical Analysis
Statistical analyses were performed using R17. Categorical variables were compared using Chi-square or Fisher Exact test as appropriate. Continuous variables were expressed as median (interquartile range, IQR) and compared using the Wilcoxon test. The predictive performance of the different TEG measurements at various timepoints for clot complications was assessed using the area under the receiver operating characteristics curve (AUROC). All tests were two-tailed and significance established at p<0.05.
Results
Overall, 95 patients were included in this study, 64% (n=61) from DH and 36% (n=34) from IMC (Table 1). The median age was 40.0 years (26.0–55.5 interquartile range [IQR]), and the majority were male (74%). Per inclusion criteria, all patients presented after blunt mechanism, with the most common mechanisms being motor vehicle collision (35%), motorcycle collision (15%), and fall (23%). The majority of patients were severely injured, with a median injury severity score (ISS) of 26 (17–37 IQR). Injuries included liver (24%), pulmonary (16%) or spleen contusions/lacerations (11%), and there was associated TBI in 45%. Shock did not predominate, with a median systolic blood pressure (SBP) of 122 mm Hg (108–139) and only 11% (10) presenting with a SBP < 90 mm Hg. The majority of patients received some form of VTE chemoprophylaxis at any point during hospitalization (79%), and the median time to VTE chemoprophylaxis was 43.8 hours (26.5–66.4 IQR). 20 (21%) patients were never started on VTE chemoprophylaxis and nearly half of patients (41%) on VTE chemoprophylaxis were started later than 48 hours. While all patients were admitted to the ICU with nonoperatively managed BSOI, failure of nonoperative management was examined, and importantly, no patient had failure of nonoperative management.
Table 1. Baseline demographic, injury characteristics, and clinical outcomes of patient population (n=95).
Values presented as median (25–75 interquartile range) and n (percent) as appropriate.
| Demographics | |
| Age (years) | 40.0 (26.0–55.5) |
| Male sex, n (%) | 74% (70) |
| Injury | |
| Mechanism: MVC, n (%) | 33 (35%) |
| Mechanism: MCC, n (%) | 14 (15%) |
| Mechanism: fall, n (%) | 22 (23%) |
| Mechanism: auto-pedestrian, n (%) | 14 (15%) |
| Mechanism: bicycle crash, n (%) | 5 (5%) |
| Mechanism: sports injury, n (%) | 5 (5%) |
| Mechanism: other, n (%) | 2 (2%) |
| Injury Severity Score | 26 (17–37) |
| Glasgow Coma Scale | 10 (6–15) |
| Traumatic brain injury, n (%) | 43 (45%) |
| Time from injury to hospital arrival (min) | 73 (27–203) |
| Initial Physiologic Measurements | |
| Systolic blood pressure (mm Hg) | 122 (108–139) |
| Base deficit (meq/L) | 6.0 (3.0–10.0) |
| Lactate (mmol/L) | 3.8 (1.8–5.5) |
| Initial Hematology | |
| Hemoglobin (g/dL) | 12.2 (9.9–14.6) |
| Platelets (10^9/L) | 205 (157–239) |
| Initial Thrombelastography | |
| Reaction time (min) | 5.0 (4.4–5.3) |
| Angle (degrees) | 71.0 (65.5–74.3) |
| Maximum amplitude (mm) | 68.0 (65.4–69.6) |
| LY30 (%) | 0.4 (0.1–1.4) |
| Resuscitation in First 24 Hours | |
| Crystalloids (mL) | 2150 (1053–3557) |
| RBCs (units) | 0 (0–2) |
| FFP (units) | 0 (0–1) |
| Platelets (units) | 0 (0–0) |
| Cryoprecipitate (units) | 0 (0–0) |
| Outcomes | |
| Ever received VTE chemoprophylaxis, n (%) | 75 (79%) |
| Time to VTE chemoprophylaxis (hours) | 43.8 (26.5–66.4) |
| Any clot complication, n (%) | 12 (13%) |
| DVT, n (%) | 7 (7%) |
| PE, n (%) | 2 (2%) |
| CVA, n (%) | 5 (5%) |
| ICU LOS (days) | 7 (3–14) |
| Hospital LOS (days) | 16 (9–24) |
| Mortality, n (%) | 4 (4%) |
MVC=motor vehicle collision, MCC=motorcycle collision, RBCs=red blood cells, FFP=fresh frozen plasma, VTE= venous thromboembolism, DVT=deep venous thrombosis, PE=pulmonary embolus, CVA=cerebrovascular accident, ICU=intensive care unit, LOS=length of stay
To assess any institutional bias, the patients from DH and IMC were compared (Table 2). Of note, more patients presented after sports injury at IMC (15% versus 0% at DH, p=0.01), the GCS was lower in patients from DH (median 7 versus 14, p=0.003), and patients from DH received more fresh frozen plasma (albeit small amounts, as both institutions’ median units of FFP in the first 24 hours was 0, p=0.01). While a higher percent of patients at DH received VTE chemoprophylaxis at any point (89% versus 62%, p=0.009), there was no difference in time to chemoprophylaxis (40.1 hours versus 46.8 hours at Intermountain, p=0.96) or overall clot complications (10% versus 18% at Intermountain, p=0.27). Due to the serial sampling and focus on patients in the ICU in our study design, we also assessed the extent of our attrition bias by comparing patients who were transferred from the ICU or discharged before 108 hours. Not surprisingly, patients who remained in the study for the entire 108 hours had a higher median ISS (22 versus 14, p=0.002) and length of stay (11 versus 4 ICU days and 20 versus 12 hospital days, p<0.0001 for both); however, there was no difference in the VTE chemoprophylaxis rates (58% versus 72%, p=0.24), time to VTE chemoprophylaxis (52.3 versus 40.7 hours, p=0.17), or clot complications (10% versus 18%, p=0.27) between groups.
Table 2. Comparison of patient populations from respective institutions.
Values presented as median (25–75 interquartile range) and n (percent) as appropriate.
| Denver Health (n=61) | Intermountain (n=34) | p value | |
|---|---|---|---|
| Demographics | |||
| Age (years) | 38.0 (26.0–52.5) | 41.5 (24.8–59.5) | 0.49 |
| Male sex, n (%) | 43 (70%) | 27 (79%) | 0.34 |
| Injury | |||
| Mechanism: MVC, n (%) | 22 (36%) | 11 (32%) | 0.01 |
| Mechanism: MCC, n (%) | 12 (20%) | 2 (6%) | |
| Mechanism: fall, n (%) | 11 (18%) | 11 (32%) | |
| Mechanism: auto-pedestrian, n (%) | 12 (20%) | 2 (6%) | |
| Mechanism: bicycle crash, n (%) | 3 (5%) | 2 (6%) | |
| Mechanism: sports injury, n (%) | 0 (0%) | 5 (15%) | |
| Mechanism: other, n (%) | 1 (1%) | 1 (3%) | |
| Injury Severity Score | 27 (20–34) | 26 (17–38) | 0.93 |
| Glasgow Coma Scale | 7 (6–10) | 14 (10–15) | 0.003 |
| Traumatic brain injury, n (%) | 30 (49%) | 13 (38%) | 0.30 |
| Time of Injury to Arrival (min) | 69 (24–204) | 110 (35–206) | 0.26 |
| Initial Physiologic Measurements | |||
| Systolic blood pressure (mm Hg) | 120 (100–140) | 126 (110–140) | 0.43 |
| Base deficit (meq/L) | 6.0 (4.0–10.0) | 5.6 (2.5–10.0) | 0.28 |
| Lactate (mmol/L) | 3.9 (1.6–5.6) | 3.6 (2.3–5.4) | 0.77 |
| Initial Hematology | |||
| Hemoglobin (g/dL) | 12.1 (10.2–13.6) | 13.1 (8.8–17.7) | 0.15 |
| Platelets (10^9/L) | 212 (155–246) | 196 (157–233) | 0.51 |
| Resuscitation in First 24 Hours | |||
| Crystalloids (mL) | 2300 (1000–3815) | 1962 (1040–3443) | 0.54 |
| RBCs (units) | 0 (0–2) | 0 (0–1) | 0.72 |
| FFP (units) | 0 (0–2) | 0 (0–0) | 0.01 |
| Platelets (units) | 0 (0–0) | 0 (0–0) | 0.58 |
| Cryoprecipitate (units) | 0 (0–0) | 0 (0–0) | 0.09 |
| Outcomes | |||
| VTE chemoprophylaxis, n (%) | 54 (89%) | 21 (62%) | 0.009 |
| Time to VTE chemoprophylaxis (hours) | 40.1 (25.8–70.5) | 46.8 (27.4–61.5) | 0.96 |
| Any clot complication, n (%) | 6 (10%) | 6 (18%) | 0.27 |
| DVT, n (%) | 1 (2%) | 6 (18%) | 0.004 |
| PE, n (%) | 1 (2%) | 1 (3%) | 0.67 |
| CVA, n (%) | 4 (7%) | 1 (3%) | 0.45 |
| ICU LOS (days) | 11 (5–15) | 4 (2–7) | <0.001 |
| Hospital LOS (days) | 19 (14–26) | 10 (5–17) | <0.001 |
| Mortality, n (%) | 2 (3%) | 2 (6%) | 0.54 |
MVC=motor vehicle collision, MCC=motorcycle collision, RBCs=red blood cells, FFP=fresh frozen plasma, VTE= venous thromboembolism, DVT=deep venous thrombosis, PE=pulmonary embolus, CVA=cerebrovascular accident, ICU=intensive care unit, LOS=length of stay
On ICU admission, all patients were hypercoagulable: 88% by R (median R 5.0 min [4.4–5.3 IQR]), 66% by angle (median angle 71.0 degrees [65.5–74.3 IQR]), 33% by MA (median MA 68.0 mm [65.4–69.6 IQR]); 50% of patients were in fibrinolysis shutdown and 50% were in physiologic fibrinolysis (with no BSOI patients in hyperfibrinolysis upon ICU admission). This initial hypercoagulability persisted in the majority of patients for the remainder of blood sampling (97% at 12 hours, 93% at 24 hours, 96% at 36 hours, 94% at 48 hours, 100% at 60 hours, 94% at 72 hours, 98% at 84 hours, and 100% at 96 and 108 hours) and was predominantly due to shortening of R time (cumulative median R time of 4.8–6.7 min throughout course). Overall, there was a trend towards increasing clot strength and decreased fibrinolysis with concurrent trend towards normalization of clotting time (Figures 1 & 2).
Figure 1. Dynamic changes in coagulation over time in patient population (n=95).
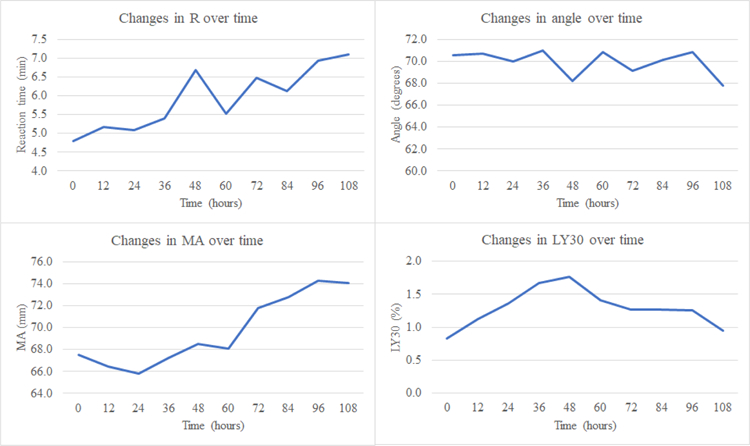
R=reaction time, MA=maximum amplitude
Figure 2. Fibrinolytic phenotype proportions over time.
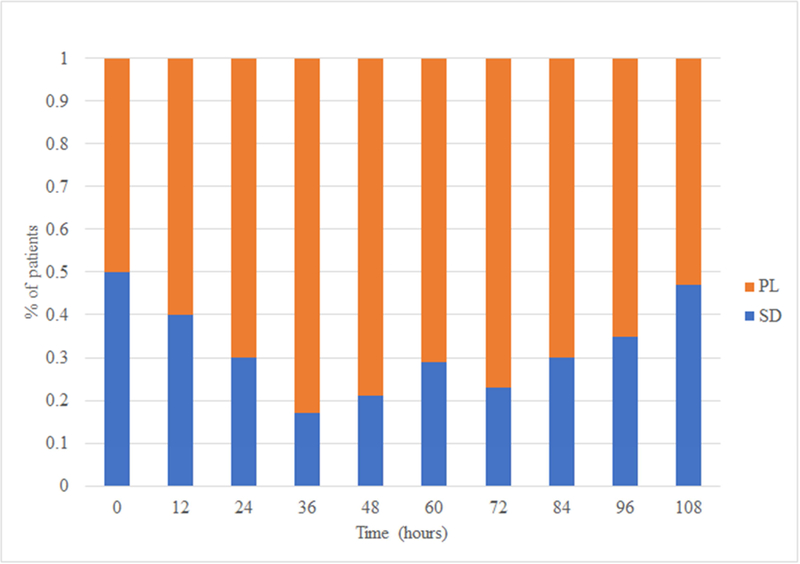
PL=physiologic lysis, SD=fibrinolysis shutdown
Upon ICU admission, 50% of patients were tPA-resistant, and 43% remained so at 108 hours. tPA-resistance was most pronounced in patients with initial fibrinolysis shutdown; 100% of patients with initial shutdown were tPA-resistant upon admission. Compared to patients with physiologic fibrinolysis, patients with fibrinolysis shutdown had a greater proportion of tPA-resistance initially (100% versus 0% at 0 hours, p=0.005) and at 24 hours (53% versus 22%, p=0.02).
Twelve patients (13%) developed clot complications. There was no difference in demographics, injury details, or initial physiology/shock between those who developed clot complications to those who did not (Table 3). There was no difference in the percent of patients who ever received chemoprophylaxis between patients who developed clots to those who did not (63% in non-clot complication versus 83% in the clot complication group, p=0.16). However, compared to those without clot complications, patients who had a clot complication had a longer median time to chemoprophylaxis (130.8 hours versus 99.8 hours, p=0.02).
Table 3. Baseline demographic, injury characteristics, and clinical outcomes of patients who developed clot complications compared to those who did not.
Values presented as median (25–75 interquartile range) and n (percent) as appropriate.
| No clot complication (n=83) | Clot complication (n=12) | p value | |
|---|---|---|---|
| Demographics | |||
| Age (years) | 40.0 (26.0–55.0) | 44.5 (24.8–63.8) | 0.55 |
| Male sex, n (%) | 62 (75%) | 8 (67%) | 0.55 |
| Injury | |||
| Mechanism: MVC, n (%) | 26 (32%) | 7 (58%) | 0.60 |
| Mechanism: MCC, n (%) | 12 (14%) | 2 (17%) | |
| Mechanism: fall, n (%) | 20 (24%) | 2 (17%) | |
| Mechanism: auto-ped, n (%) | 13 (16%) | 1 (8%) | |
| Mechanism: bicycle crash, n (%) | 5 (6%) | 0 (0%) | |
| Mechanism: sports injury, n (%) | 5 (6%) | 0 (0%) | |
| Mechanism: Other, n (%) | 2 (2%) | 0 (0%) | |
| Injury Severity Score | 27 (20–34) | 26 (17–38) | 0.10 |
| Glasgow Coma Scale | 10 (6–15) | 8 (6–14) | 0.67 |
| Traumatic brain injury, n (%) | 39 (47%) | 4 (33%) | 0.37 |
| Time from injury to arrival (min) | 69 (26–205) | 92 (42–201) | 0.34 |
| Initial Physiologic Measurements | |||
| Systolic blood pressure (mm Hg) | 122 (107–142) | 111 (99–133) | 0.25 |
| Base deficit (meq/L) | 6.0 (3.0–10.0) | 9.4 (5.3–11.2) | 0.17 |
| Lactate (mmol/L) | 3.5 (1.7–5.5) | 4.6 (3.5–6.3) | 0.11 |
| Initial Hematology | |||
| Hemoglobin (g/dL) | 12.2 (10.3–14.6) | 11.4 (8.0–17.6) | 0.59 |
| Platelets (10^9/L) | 210 (158–244) | 176 (139–205) | 0.11 |
| Outcomes | |||
| VTE chemoprophylaxis, n (%) | 52 (63%) | 10 (83%) | 0.16 |
| Time to VTE chemoprophylaxis (hours) | 39.9 (25.4–60.6) | 52.3 (45.7–146.4) | 0.02 |
| ICU LOS (days) | 7 (3–13) | 11 (3–19) | 0.36 |
| Hospital LOS (days) | 16 (8–24) | 20 (11–46) | 0.20 |
| Mortality, n (%) | 4 (5%) | 0 (0%) | 0.44 |
MVC=motor vehicle collision, MCC=motorcycle collision, RBCs=red blood cells, FFP=fresh frozen plasma, VTE= venous thromboembolism, ICU=intensive care unit, LOS=length of stay
Upon evaluating the coagulation profiles of patients who develop clot complications (Table 4, Figure 3), compared to patients who did not, they had a lower median LY30 at hour 12 (0.2% versus 0.9%, p=0.02), and a greater percent of patients were in fibrinolytic shutdown at 12 hours (50% versus 19%, p=0.02) and 36 hours (33% versus 11%, p=0.03). After 36 hours, there appeared to be a divergence in the coagulation profile of patients with clot complications with a relatively increasing degree of hypercoagulability. Specifically, patients who developed a clot complication had greater clot strength at 48 hours (higher median MA of 71.9 mm versus 68.5 mm, p=0.04) and a greater degree of tPA resistance at 84 hours (lower tPA-TEG LY30 at 84 hours of 0.8% versus 2.8%, p=0.04).
Table 4. Dynamic coagulation profile of patients who developed clot complications compared to those who did not.
Values presented as median (25–75 interquartile range).
| No VTE (n=83) | VTE (n=12) | p value | |
|---|---|---|---|
| Hour 12 | |||
| R (min) | 4.8 (4.0–6.6) | 4.5 (3.0–7.9) | 0.96 |
| Angle (degrees) | 70.6 (65.8–74.9) | 73.0 (64.1–74.1) | 0.73 |
| MA (mm) | 66.5 (62.4–69.4) | 68.1 (62.1–69.5) | 0.95 |
| LY30 (%) | 0.9 (0.4–1.7) | 0.2 (0.0–0.5) | 0.02 |
| Hour 24 | |||
| R (min) | 5.1 (3.8–6.2) | 4.1 (3.0–6.6) | 0.44 |
| Angle (degrees) | 70.4 (67.2–73.2) | 70.8 (63.4–72.7) | 0.81 |
| MA (mm) | 66.5 (63.2–69.0) | 66.2 (61.9–71.2) | 0.88 |
| LY30 (%) | 1.4 (0.5–2.0) | 0.6 (0.1–2.2) | 0.25 |
| Hour 36 | |||
| R (min) | 5.5 (3.9–6.8) | 3.4 (2.8–6.7) | 0.05 |
| Angle (degrees) | 71.1 (68.5–72.9) | 72.8 (69.7–76.2) | 0.21 |
| MA (mm) | 67.5 (64.2–70.5) | 67.8 (66.1–71.1) | 0.64 |
| LY30 (%) | 1.5 (1.1–2.0) | 1.3 (0.4–2.4) | 0.56 |
| Hour 48 | |||
| R (min) | 5.9 (4.3–7.1) | 8.2 (3.9–12.3) | 0.42 |
| Angle (degrees) | 70.3 (66.9–72.6) | 66.2 (52.4–74.1) | 0.44 |
| MA (mm) | 68.5 (64.6–71.5) | 71.9 (69.5–76.0) | 0.04 |
| LY30 (%) | 1.4 (0.9–2.5) | 0.6 (0.2–1.8) | 0.16 |
| Hour 60 | |||
| R (min) | 5.8 (4.3–6.5) | 4.9 (4.0–6.6) | 0.65 |
| Angle (degrees) | 71.3 (68.5–73.4) | 71.1 (68.5–73.4) | 0.96 |
| MA (mm) | 69.5 (63.7–71.5) | 71.0 (68.0–74.5) | 0.48 |
| LY30 (%) | 1.3 (0.3–2.1) | 1.8 (0.4–2.6) | 0.41 |
| Hour 72 | |||
| R (min) | 6.0 (4.4–7.1) | 7.7 (4.4–9.9) | 0.52 |
| Angle (degrees) | 71.1 (68.1–73.2) | 64.6 (60.6–73.8) | 0.30 |
| MA (mm) | 72.5 (69.4–75.8) | 72.6 (70.5–74.7) | 0.95 |
| LY30 (%) | 1.1 (0.7–2.1) | 0.9 (0.5–2.0) | 0.77 |
| Hour 84 | |||
| R (min) | 5.8 (4.7–7.2) | 6.4 (3.9–7.4) | 0.58 |
| Angle (degrees) | 71.4 (68.0–74.1) | 70.2 (65.8–74.4) | 0.86 |
| MA (mm) | 73.1 (69.5–76.0) | 74.0 (70.0–76.8) | 0.89 |
| LY30 (%) | 0.8 (0.4–1.8) | 1.6 (0.7–2.7) | 0.19 |
| Hour 96 | |||
| R (min) | 6.6 (4.8–7.8) | 8.1 (4.6–10.2) | 0.37 |
| Angle (degrees) | 72.2 (68.5–75.0) | 72.4 (64.1–77.7) | 0.70 |
| MA (mm) | 75.0 (72.0–79.0) | 75.4 (73.0–81.0) | 0.52 |
| LY30 (%) | 1.0 (0.5–1.7) | 0.5 (0.1–1.6) | 0.57 |
| Hour 108 | |||
| R (min) | 6.2 (4.9–8.0) | 7.4 (5.6–9.7) | 0.38 |
| Angle (degrees) | 71.7 (67.6–74.2) | 69.3 (64.1–74.0) | 0.61 |
| MA (mm) | 73.9 (71.1–77.1) | 75.0 (73.0–78.1) | 0.59 |
| LY30 (%) | 0.9 (0.2–1.6) | 0.7 (0.0–1.2) | 0.44 |
R=reaction time, MA=maximum amplitude, LY30=lysis 30 minutes after MA
Figure 3. Dynamic changes in coagulation over time in patients who developed a clot complication compared to those who did not.

CC=clot complication, R=reaction time, MA=maximum amplitude
After having identified a difference in fibrinolysis at 12 hours and clot strength at 48 hours between patients who developed a clot complication to those who did not, we performed an AUROC analysis. On evaluating LY30 at 12 hours, the AUC for prediction of clot complications was 0.75 (95% confidence interval [CI] 0.52–0.99), and the LY30 cutoff with the maximum specificity and sensitivity (Youden’s index) was < 0.5% (a threshold within the definition of fibrinolysis shutdown). On evaluating MA at 48 hours, the AUC for prediction of clot complications was 0.73 (95% CI 0.56–0.91), and the MA cutoff with the maximum specificity and sensitivity (Youden’s index) was > 65.8 mm.
Discussion
The objective of this prospective observational study was to identify the timing of transition to hypercoagulability, as measured by serial TEGs, in BSOI patients and to identify sentinel signs of pathologic hypercoagulability on TEG which place a patient at increased risk of thrombotic morbidity. The study results demonstrate that patients are universally hypercoagulable upon admission to the ICU after BSOI. Our results also suggest that delay to VTE chemoprophylaxis and robust hypercoagulability may both contribute to clot complications. Compared to those without clot complications, patients who had a clot complication had a longer median time to chemoprophylaxis, as well as lower degree of fibrinolysis at 12 hours, greater clot strength (MA) at 48 hours, and a greater degree of tPA resistance at 84 hours. This study contributes to a gap in the literature by describing dynamic changes in coagulation in BSOI patients, as characterized by both citrated kaolin TEG and tPA-challenge TEG, in a prospective, multi-center investigation.
Despite the first description of the dynamic transition from hypocoagulability to hypercoagulability in severely injured patients in the early 1900s, the precise timing of this change remains uncertain and is likely influenced by a myriad of variables, including degree of shock and tissue injury and resuscitation such as blood product transfusion18–20. Our data indicate that upon ICU admission, all patients were hypercoagulable and half of the patients presented in fibrinolytic shutdown. This hypercoagulability is pervasive despite a proportion of patients presenting in shock, as defined by SBP < 90 mm Hg, which contradicts historical dogma that shock is intrinsically linked to hypocoagulability and bleeding risk. These results support findings from a previous retrospective review of all nonoperative BSOI patients at our own institution from 2009–2012, in which we found that no patients presented hypocoagulable; however in our previous work, we found that the majority of patients converted to a hypercoagulable profile, characterized by elevated MA, at a later timepoint of 48 hours9. In a similar retrospective study of serial rotational thrombelastometry (ROTEM) over 120 hours in critically injured patients, Sumislawski et. al. found that nearly half of patients converted to a hypercoagulable profile, as assessed by maximum clot firmness on ROTEM (analogous of MA on TEG) by 120 hours2. The results of our prospective study indicate the transition to hypercoagulability happens significantly earlier than 48 hours. This finding calls into question the current practice of delaying VTE chemoprophylaxis in BSOI patients due to concern for exacerbation of injury-related bleeding and failure of nonoperative management.
Previous work suggests that the risk of failure of non-operative management due to hemorrhage caused from VTE chemoprophylaxis is exceedingly more rare than the thrombotic consequences of withholding chemoprophylaxis. In a retrospective review of 312 BSOI patients, Eberle et. al. found that only 12 patients failed nonoperative management and of those, only one had been initiated on VTE chemoprophylaxis (which was initiated three days before the hemorrhage complication)21. The lack of non-operative management failure has been described by other groups which have found no relationship between timing of VTE chemoprophylaxis and transfusion requirement or rates of nonoperative failure in BSOI patients22–26; there are even reports of higher rates of failure of nonoperative management, as well as higher rates of VTE, in BSOI patients not on VTE chemoprophylaxis as compared to patients on chemoprophylaxis27. Our data supports the safety of early VTE chemoprophylaxis in BSOI patients in particular due to the unanimous lack of failure of nonoperative management.
Currently there is a lack of consensus and evidence-based guidelines on the optimal time to initiate chemoprophylaxis in non-operative BSOI patients. The Eastern Association for the Surgery of Trauma guidelines for non-operative management of both hepatic and splenic injuries concluded that there was insufficient data in the literature to make recommendations regarding the timing of initiation of VTE pharmacoprophylaxis28,29. The Best Evidence Topic (BET) Reports reviewed all retrospective reviews examining VTE chemoprophylaxis in BSOI patients in 2018 and concluded that there is insufficient evidence assessing safety of low molecular weight heparin (LMWH) within 24 hours of trauma, acknowledging that retrospective studies suggest LMWH within 48 hours does not affect rate of non-operative failure30. While some animal models of tissue injury and hemorrhagic shock have identified hypercoagulability by TEG as early as four hours following injury20, in severely injured humans, the majority of literature describes this transition to hypercoagulability occurs at 24–48 hours through retrospective data2. As such, Van and Schreiber recommend initiation of VTE chemoprophylaxis of BSOI patients at 48 hours31. Our results suggest that this time frame might not be soon enough. The early onset and predominance of hypercoagulability in our patient population is a surprising finding which contrasts previous retrospective reports2,9 and challenges current practices which delay immediate initiation of VTE chemoprophylaxis. Our evidence suggests rather that VTE chemoprophylaxis should be initiated immediately upon admission to the ICU or at least personalized by risk stratification with hematologic assays.
This study indicates that time to VTE chemoprophylaxis and robust hypercoagulability may both contribute to clot complications. Compared to those without clot complications, patients who had a clot complication had a longer median time to chemoprophylaxis, a finding which has been previously described2,32. Our data also indicate that patients who developed a clot complication had a lower degree of fibrinolysis at 12 hours, greater clot strength (MA) at 48 hours, and a greater degree of tPA resistance at 84 hours. Previous studies have reported that viscoelastic measurements can accurately predict thrombotic complications. Kashuk et. al. found that an elevated G (measurement of clot strength on TEG, derived from MA) was associated with an odds ratio of VTE of 1.25 and for every 1 dyne/cm2 increase in G, the odds of VTE increased by 25%7. Similarly, Van et. al. evaluated serial TEG in trauma patients and found that R time was 1.5 minutes shorter on average in patients who developed a DVT as compared to those who did not8; while shortening of R time characterized the majority of hypercoagulability in our patient population, MA and LY30 differentiated patient who developed clot complications. Our data describe a predominance of fibrinolysis shutdown in BSOI patients. Additionally, fibrinolytic shutdown was more common in patients who developed a clot complication. Previous literature has linked fibrinolysis shutdown to clot complications33,34 and increased mortality35. This study builds on this previous research by further characterizing fibrinolytic shutdown by tPA resistance in patients who develop clot complications. This hypercoagulability in the form of resistance to tPA-mediated fibrinolysis is particularly concerning, given tPA resistance has been linked to a five-fold increase in mortality in severely injured patients11. Additionally, the differentiation of patients who develop clot complications by MA at 48 hours suggests that persistence in hypercoagulability, versus an initial hypercoagulable measurement upon hospital arrival, most strongly influences thrombotic risk.
Ultimately, we believe the findings from this study supports earlier, more timely and data-driven chemoprophylaxis in BSOI patients. Specifically, patients with an LY30 < 0.5% at 12 hours and/or MA > 65.8 mm at 48 hours should be considered for expeditious VTE chemoprophylaxis to mitigate a relatively increased risk of clot complications (Figure 4). While TEG is not available at all hospitals, these results are generalizable to other viscoelastic assays, such as rotational thromboelastometry (ROTEM), which describe fibrinolysis and clot strength (by clot lysis and maximum clot firmness respectively with ROTEM)36. Additionally, while tPA-challenge TEG can identify trauma patients with higher mortality risk11 and suggests possible mechanisms behind fibrinolysis shutdown (such as aberrant clot structure, affecting tPA binding sites), this is not included in our individualized VTE chemoprophylaxis algorithm given its lack of current widespread availability. It is worth noting that the typical agents for VTE chemoprophylaxis, specifically unfractionated heparin or LMWH, do not affect fibrinolysis, and given fibrinolytic shutdown at 12 hours was the earliest sentinel signal of pathologic hypercoagulability, it calls into question whether tPA should be considered as an adjunct to current VTE chemoprophylaxis agents.
Figure 4.

Proposed Decision Algorithm for Initiation of VTE Chemoprophylaxis in Blunt Solid Organ Injury Patients.
There are several limitations to this study. First, we are limited by a small sample size of 95 patients, which makes robust multivariate analysis prohibitive. Secondly, due to the serial sampling and focus on patients in the ICU, there is selection bias in our study in the form of survivor bias and/or attrition bias (patients being discharged from the ICU before 108 hours). The magnitude of survivor bias is likely small given the low rate of mortality in our sample, and our analysis found minimal impact of attrition bias. While a strength of this study is the multi-center nature, an inherent limitation is the difference in practice patterns for VTE chemoprophylaxis strategies.
Conclusions
BSOI patients are universally hypercoagulable upon ICU admission. This manifests as shortened time to clot formation, increased clot propagation and strength and tPA resistance. This hypercoagulability persists at least 108 hours. Patients with thrombotic complications have more robust decrease in fibrinolysis within 12 hours and decreased clot strength at 48 hours, with a greater predominance of fibrinolysis shutdown and tPA resistance. Despite this universal hypercoagulability, VTE chemoprophylaxis was delayed for almost 48 hours in this BSOI population and longer in patients who ultimately developed thrombotic complications. Based on these data, we recommend that VTE chemoprophylaxis should be started immediately upon ICU admission in BSOI patients with evidence of hypercoagulability on TEG. Future prospective studies are needed to investigate safety of initiating at this early timepoint.
Research Highlights.
Blunt solid organ injury patients are universally hypercoagulable upon admission.
Patients with clot complications have decreased fibrinolysis and increased clot strength.
VTE chemoprophylaxis should be started early in blunt solid organ injury.
Acknowledgments
Funding Support:
Research reported in this publication was supported by the National Institute of General Medical Sciences of the National Institutes of Health (T32 GM008315 and P50 GM049222), the US Department of Defense (USAMRAA, W81XWH-12–2-0028), and the Intermountain Research and Medical Foundation. The content is solely the responsibility of the authors and does not necessarily represent the official views of the National Institutes of Health or the US Department of Defense.
Footnotes
Publisher's Disclaimer: This is a PDF file of an unedited manuscript that has been accepted for publication. As a service to our customers we are providing this early version of the manuscript. The manuscript will undergo copyediting, typesetting, and review of the resulting proof before it is published in its final citable form. Please note that during the production process errors may be discovered which could affect the content, and all legal disclaimers that apply to the journal pertain.
This research will be presented as a Podium presentation at the Southwestern Surgical Congress 2019 Annual Meeting.
Conflict of Interest:
Haemonetics provided thrombelastography supplies at discounted rates.
References
- 1.Sauaia A, Moore FA, Moore EE, et al. Epidemiology of trauma deaths: a reassessment. The Journal of Trauma 1995;38(2):185–193. [DOI] [PubMed] [Google Scholar]
- 2.Sumislawski JJ, Kornblith LZ, Conroy AS, et al. Dynamic coagulability after injury: Is delaying venous thromboembolism chemoprophylaxis worth the wait? The Journal of Trauma and Acute Care Surgery 2018;85(5):907–914. [DOI] [PMC free article] [PubMed] [Google Scholar]
- 3.Geerts WH, Code KI, Jay RM, et al. A prospective study of venous thromboembolism after major trauma. The New England Journal of Medicine 1994;331(24):1601–1606. [DOI] [PubMed] [Google Scholar]
- 4.Geerts W, Ray JG, Colwell CW, et al. Prevention of venous thromboembolism. Chest 2005;128(5):3775–3776. [DOI] [PubMed] [Google Scholar]
- 5.Paffrath T, Wafaisade A, Lefering R, et al. Venous thromboembolism after severe trauma: incidence, risk factors and outcome. Injury 2010;41(1):97–101. [DOI] [PubMed] [Google Scholar]
- 6.Regner JL, Shaver CN. Determining the impact of culture on venous thromboembolism prevention in trauma patients: A Southwestern Surgical Congress Multicenter trial. American Journal of Surgery 2018. [DOI] [PubMed] [Google Scholar]
- 7.Kashuk JL, Moore EE, Sabel A, et al. Rapid thrombelastography (r-TEG) identifies hypercoagulability and predicts thromboembolic events in surgical patients. Surgery 2009;146(4):764–772. [DOI] [PubMed] [Google Scholar]
- 8.Van PY, Cho SD, Underwood SJ, et al. Thrombelastography versus AntiFactor Xa levels in the assessment of prophylactic-dose enoxaparin in critically ill patients. The Journal of Trauma 2009;66(6):1509–1515. [DOI] [PubMed] [Google Scholar]
- 9.Chapman BC, Moore EE, Barnett C, et al. Hypercoagulability following blunt solid abdominal organ injury: when to initiate anticoagulation. American Journal of Surgery 2013;206(6):917–922. [DOI] [PMC free article] [PubMed] [Google Scholar]
- 10.Haemonetics. TEG 5000 System User Manual. P/N 06–510-US, Manual revision: AC Niles, IL: Haemonetics Corporation, Haemoscope Division; 2010. [Google Scholar]
- 11.Moore HB, Moore EE, Huebner BR, et al. Fibrinolysis shutdown is associated with a fivefold increase in mortality in trauma patients lacking hypersensitivity to tissue plasminogen activator. The Journal of Trauma and Acute Care Surgery 2017;83(6):1014–1022. [DOI] [PMC free article] [PubMed] [Google Scholar]
- 12.Coleman JR, Moore EE, Chapman MP, et al. Rapid thrombelastography compared to kaolin and native: Rapid and efficient. Surgery 2018;164(3):489–493. [DOI] [PMC free article] [PubMed] [Google Scholar]
- 13.Gonzalez E, Pieracci FM, Moore EE, Kashuk JL. Coagulation abnormalities in the trauma patient: the role of point-of-care thromboelastography. Seminars in Thrombosis and Hemostasis 2010;36(7):723–737. [DOI] [PMC free article] [PubMed] [Google Scholar]
- 14.Samuels JM, Moore EE, Silliman CC, et al. Severe traumatic brain injury is associated with a unique coagulopathy phenotype. The Journal of Trauma and Acute Care Surgery 2018. [DOI] [PMC free article] [PubMed] [Google Scholar]
- 15.Stettler GR, Moore EE, Moore HB, et al. Redefining Post Injury Fibrinolysis Phenotypes Using Two Viscoelastic Assays. The Journal of Trauma and Acute Care Surgery 2018. [DOI] [PMC free article] [PubMed] [Google Scholar]
- 16.Bates SM, Jaeschke R, Stevens SM, et al. Diagnosis of DVT: Antithrombotic Therapy and Prevention of Thrombosis, 9th ed: American College of Chest Physicians Evidence-Based Clinical Practice Guidelines. Chest 2012;141(2 Suppl):e351S–e418S. [DOI] [PMC free article] [PubMed] [Google Scholar]
- 17.dplyr: Hadley Wickham, Romain François, Lionel Henry and Kirill Müller (2018). dplyr: A Grammar of Data Manipulation. R package version 0.7.7 https://CRAN.R-project.org/package=dplyr. [Google Scholar]
- 18.Cannon WB, Fraser J, Cowell E. The Preventative Treatment of Wound Shock. Jama 1914;70:618–621. [Google Scholar]
- 19.Cardenas JC, Cap AP, Swartz MD, et al. Plasma Resuscitation Promotes Coaguluation Homeostasis Following Shock-Induced Hypercoagulability. Shock 2016;45(2):166–173. [DOI] [PubMed] [Google Scholar]
- 20.Duan K, Yu W, Lin Z, et al. A time course study of acute traumatic coagulopathy prior to resuscitation: from hypercoagulation to hypocoagulation caused by hypoperfusion? Transfusion and Apheresis Science 2014;50(3):399–406. [DOI] [PubMed] [Google Scholar]
- 21.Eberle BM, Schnuriger B, Inaba K, et al. Thromboembolic prophylaxis with low-molecular-weight heparin in patients with blunt solid abdominal organ injuries undergoing nonoperative management: current practice and outcomes. The Journal of Trauma 2011;70(1):141–146. [DOI] [PubMed] [Google Scholar]
- 22.Alejandro KV, Acosta JA, Rodriguez PA. Bleeding manifestations after early use of low-molecular-weight heparins in blunt splenic injuries. The American Surgeon 2003;69(11):1006–1009. [PubMed] [Google Scholar]
- 23.Joseph B, Pandit V, Harrison C, et al. Early thromboembolic prophylaxis in patients with blunt solid abdominal organ injuries undergoing nonoperative management: is it safe? American Journal of Surgery 2015;209(1):194–198. [DOI] [PubMed] [Google Scholar]
- 24.Kwok AM, Davis JW, Dirks RC, et al. Time is now: venous thromboembolism prophylaxis in blunt splenic injury. American Journal of Surgery 2016;212(6):1231–1236. [DOI] [PubMed] [Google Scholar]
- 25.Murphy PB, Sothilingam N, Charyk Stewart T, et al. Very early initiation of chemical venous thromboembolism prophylaxis after blunt solid organ injury is safe. Canadian Journal of Surgery 2016;59(2):118–122. [DOI] [PMC free article] [PubMed] [Google Scholar]
- 26.Norwood SH, Berne JD, Rowe SA, et al. Early venous thromboembolism prophylaxis with enoxaparin in patients with blunt traumatic brain injury. The Journal of Trauma 2008;65(5):1021–1026. [DOI] [PubMed] [Google Scholar]
- 27.Khatsilouskaya T, Haltmeier T, Cathomas M, et al. Thromboembolic Prophylaxis with Heparin in Patients with Blunt Solid Organ Injuries Undergoing Non-operative Treatment. World Journal of Surgery 2017;41(5):1193–1200. [DOI] [PubMed] [Google Scholar]
- 28.Stassen NA, Bhullar I, Cheng JD, et al. Nonoperative management of blunt hepatic injury: an Eastern Association for the Surgery of Trauma practice management guideline. The Journal of Trauma and Acute Care Surgery 2012;73(5 Suppl 4):S288–293. [DOI] [PubMed] [Google Scholar]
- 29.Stassen NA, Bhullar I, Cheng JD, et al. Selective nonoperative management of blunt splenic injury: an Eastern Association for the Surgery of Trauma practice management guideline. The Journal of Trauma and Acute Care Surgery 2012;73(5 Suppl 4):S294–300. [DOI] [PubMed] [Google Scholar]
- 30.Ferguson C, Lewin J. BET 2: Is early chemical thromboprophylaxis safe in patients with blunt trauma solid organ injury (SOI) undergoing non-operative management (NOM)? Emergency Medicine Journal 2018;35(2):127–129. [DOI] [PubMed] [Google Scholar]
- 31.Van PY, Schreiber MA. Contemporary thromboprophylaxis of trauma patients. Current Opinion in Critical Care 2016;22(6):607–612. [DOI] [PubMed] [Google Scholar]
- 32.Martin GE, Pugh A, Williams SG, et al. Lower Extremity Duplex Ultrasound Screening Protocol for Moderate- and High-Risk Trauma Patients. The Journal of Surgical Research 2019;235:280–287. [DOI] [PubMed] [Google Scholar]
- 33.Leeper CM, Neal MD, McKenna CJ, Gaines BA. Trending Fibrinolytic Dysregulation: Fibrinolysis Shutdown in the Days After Injury Is Associated With Poor Outcome in Severely Injured Children. Annals of Surgery 2017;266(3):508–515. [DOI] [PubMed] [Google Scholar]
- 34.Leeper CM, Neal MD, McKenna C, et al. Principal component analysis of coagulation assays in severely injured children. Surgery 2018;163(4):827–831. [DOI] [PubMed] [Google Scholar]
- 35.Roberts DJ, Kalkwarf KJ, Moore HB, et al. Time Course and Outcomes Associated with Transient Versus Persistent Fibrinolytic Phenotypes After Injury: A Nested, Prospective, Multicenter Cohort Study. The Journal of Trauma and Acute Care Surgery 2018. [DOI] [PubMed] [Google Scholar]
- 36.Peng HT, Grodecki R, Rizoli S, Shek PN. A comparative study of tissue factor and kaolin on blood coagulation assays using rotational thromboelastometry and thromboelastography. Blood Coagulation & Fibrinolysis 2016;27(1):31–41. [DOI] [PubMed] [Google Scholar]