

Abstract
Stigma is a well‐documented concern of people living with mental illness. Through the use of novel exploratory structural equation modelling (ESEM) methods, we aimed to elucidate the structure of stigma as measured by two stigma scales (the Depression Stigma Scale and the Social Distance Scale), to establish dimensions of stigma towards a range of disorders and to compare levels on these dimensions between disorders and respondent subgroups. We used data from two Australian national surveys, one of the general community aged 15+ and another of youths aged 15–25. Stigma responses were elicited using a range of mental illness vignettes: depression, schizophrenia, social phobia and post‐traumatic stress disorder (PTSD). ESEM revealed that the structure of stigmatizing attitudes in young people and adults is comparable in personally held attitudes and those perceived in others. Personal and perceived stigma formed distinct dimensions with each comprising “Weak‐not‐sick” and “Dangerous/unpredictable” components. The social distance dimension of stigma was separate from other components of stigma, supporting the appropriateness of the existing Social Distance Scale. Scales reflecting these dimensions had different patterns of association with respondent age and gender, and the type of mental disorder portrayed in the vignette. Copyright © 2014 John Wiley & Sons, Ltd.
Keywords: mental illness, stigma, exploratory structural equation modelling, social distance
Background
Stigma associated with having a mental disorder is a well‐documented concern of people living with mental illness (Livingston and Boyd, 2010). It has been linked to the mental health status of the individual, including their help seeking, treatment adherence and psychiatric symptom severity (Livingston and Boyd, 2010; Mak et al., 2007). Stigma has been defined in various ways, but in this paper we follow the 2001 World Health Report's (World Health Organization, 2001) definition of stigma as “a mark of shame, disgrace or disapproval which results in an individual being rejected, discriminated against, and excluded from participating in a number of different areas of society”. Although stigma is often discussed as a unitary construct, cumulative evidence clearly indicates that it is complex and multi‐dimensional (Griffiths et al., 2004; Watson et al., 2005; Wolff et al., 1996). These studies suggest that the dimensions identified depend on the pool of items used and the types of mental disorders covered by the stigma measure.
Two stigma‐related measures that have been used in several Australian community surveys are the Depression Stigma Scale (DSS; Griffiths et al., 2004) and the Social Distance Scale (SDS; Link et al., 1999). The DSS was developed based on a hypothesized structure distinguishing between personal stigma and stigma perceived in others. Half of the items in the scale formally address multiple facets of stigma by asking respondents about their own attitudes to a mentally ill person depicted in a vignette (personal stigma). The other half ask parallel questions about the respondent's perceptions of the attitudes held by other people (perceived stigma). Preliminary qualitative methods were used to derive the scale content, through extracting major recurring broad themes from websites on depression and stigma. Themes were based on the first 100 results returned using the Google search engine and the keywords “stigma depression” and on the Google depression directory using the keyword “stigma”. The themes include the status of mental illness as a real medical condition, the extent to which it is the fault, under the control or a character flaw of the sufferer, perceptions of dangerousness, unpredictability and shame, and desire to avoid or discriminate against sufferers. While the scale was originally intended to measure depression stigma, it can also be administered in relation to vignettes of other disorders (Griffiths et al., 2006).
The SDS (Link et al., 1999) is an older, indirect measure of stigma or negative affect towards individuals with mental illness derived from the work of Bogardus (1933) who sought to assess the attitude of individuals to others free from the influence of other personality attributes. He believed that the desire for “distance” represented an urge for security and arose in the autonomic nervous system. The SDS takes a different approach to the DSS by measuring intended avoidance behaviour rather than beliefs about people with mental disorders. It asks respondents how willing they would be to move next‐door to, befriend, work with or have as a relation, a person with mental illness depicted in vignette. Greater unwillingness reflects a desire for greater social distance. Many studies have shown that social distance scales measure a single factor (see review by Jorm and Oh, 2009).
To date, the few analyses of the structure of the DSS and of the DSS and SDS together have not yielded consistent findings, but it remains to be elucidated whether inconsistencies are due to differences between samples or between approaches to analysis. Griffiths et al. (2008) extracted two stigma factors associated with depression from the DSS in three community samples of adults, namely Personal and Perceived Stigma. In contrast, Jorm and Wright (2008) found that stigma associated with depression, depression with alcohol abuse, social phobia, and psychosis in young people required a four‐dimensional model in a principal components analysis that included both DSS and SDS items. It is of note that the same factor structure was found in separate analyses of data from young people and their co‐resident parents. These factors were: “social distance” (comprising all items from the SDS), “Dangerous/unpredictable” (comprising items about dangerousness or unpredictability, including both personal attitudes and perceptions of others' attitudes), “stigma perceived in others” (comprising the remaining perceived stigma items), and “Weak‐not‐sick” (comprising personal stigma items about beliefs that the person was weak, not ill, could control their behaviour, and should be avoided).
Although both studies used large community samples, several differences are apparent: Griffiths et al. (2008) used adult samples, conducted analyses of the DSS alone, and focused on depression only; whereas Jorm and Wright (2008) used both youth and adult samples and conducted analyses which included responses to both DSS and SDS items elicited in response to vignettes of four disorders. The parent sample in Jorm and Wright's (2008) study cannot be considered to be a nationally representative adult sample, as it only involved co‐resident parents of the youth sample. Hence it remains unclear whether the factor structure reported by Jorm and Wright (2008) would apply in a broader adult sample. There are several reasons why the stigma factor structure might differ between an adult and a youth sample. The first is a cohort effect. Older generations have lived through an era when people with severe mental disorders were admitted to psychiatric hospitals, while common disorders were either not recognized or not acknowledged. In comparison, younger people are more likely to have been exposed, de novo, to mental health promotion interventions such as MindMatters (Mason, 2006), which was implemented in secondary schools across Australia in 2003. These different experiences may have given rise to differing attitudes. Another possible cause of age differences is developmental and principally applies when comparing adolescent and adult samples. Typically, adolescents have had much more limited experience on which to base their attitudes towards people with mental disorders. A third related reason is due to age differences in social desirability (Mwamwenda, 1995; Nuevo et al., 2009), which may influence the stigmatizing attitudes reported by respondents of various age groups in different ways.
In the current study, we aimed to better understand the structure of stigma as measured by the DSS and SDS using data from two large nationally representative Australian surveys, one of the general community aged 15 years and older, and the other of young people aged 15 to 25 years. Much previous research can be applied reliably only to stigma associated with depression or a limited number of disorders, because these were the illnesses depicted in vignettes used in most studies. It is desirable to understand and measure stigma for a broad range of disorders. We thus sought to establish dimensions of stigma that pertains across a range of disorders and to compare levels on these dimensions between disorders and between subgroups of respondents. Specifically, we sought to establish the measurement structure for both personal and perceived stigma as measured by the DSS, and to determine the extent to which these structures were comparable. In addition, we examined how the more established SDS social distance construct relates to the items in the DSS.
Methods
Participants
Both the General Community and Youth surveys were carried out by the survey company Social Research Centre via computer‐assisted telephone interviews (CATIs). Participants were contacted by random‐digit dialling of both landlines and mobile phones covering all of Australia from January to May 2011. The General Community Survey ascertained a sample of 6019 members of the general community aged 15+ (see Reavley and Jorm, 2011b, for further details). The Youth Survey recruited 3021 participants aged between 15 and 25 years (see Reavley and Jorm, 2011c, for further details). The study was approved by the University of Melbourne Human Research Ethics Committee.
Survey interview
Both interviews elicited responses to a vignette of a person with a mental disorder. In the General Community Survey, respondents were read one of six vignettes chosen at random. Vignettes described a person suffering from either depression, depression with suicidal thoughts, early schizophrenia, chronic schizophrenia, social phobia and post‐traumatic stress disorder (PTSD). Respondents were also randomly assigned to receive either male (“John”) or female (“Jenny”) versions of the vignette. All vignettes were written to satisfy the diagnostic criteria for the corresponding mental disorder (major depression, social phobia, PTSD, or schizophrenia) according to the Diagnostic and Statistical Manual of Mental Disorders, Fourth Edition (DSM‐IV) and the International Classification of Diseases, 10th Revision (ICD‐10) (Jorm et al., 2005; Reavley and Jorm, 2011b).
In the Youth Survey, respondents were read one of six vignettes on a random basis: depression, depression with suicidal thoughts, depression with alcohol misuse, social phobia, psychosis/schizophrenia and PTSD. Each vignette had two versions. Respondents aged 15–17 years were read a version of the vignette portraying a person aged 15 years, whereas those aged 18–25 years were read one portraying a person aged 21 years. The details of the vignettes were altered slightly to be age appropriate (e.g. reference to functioning at school rather than in a university course). The vignettes have been published previously (Jorm et al., 2007; Reavley and Jorm, 2011c).
For both surveys, after being presented with the vignette, respondents were asked a series of questions that assessed sociodemographic characteristics, recognition of the mental disorder in the vignette, stigma, knowledge of causes and risk factors (General Community Survey only), beliefs about prevention (Youth Survey only) and interventions, exposure to mental disorders, psychological distress (using the K6 screening scale; Kessler et al., 2002), and exposure to mental health campaigns. Data relating to these questions is reported elsewhere (Reavley and Jorm, 2011a, 2011c).
The focus of this paper is on respondents' stigmatizing attitudes and those they perceive in others about mental disorders, hence these are described in more detail here.
Personal and perceived stigma
In the General Community Survey, stigmatizing attitudes were assessed with two sets of statements, one assessing the respondent's personal attitudes towards the person described in the vignette (personal stigma) and the other assessing the respondent's beliefs about other people's attitudes towards the person in the vignette (perceived stigma) (Griffiths et al., 2004). The personal stigma items were: (1) People with a problem like (John/Jenny)'s could snap out of it if they wanted; (2) A problem like (John/Jenny)'s is a sign of personal weakness; (3) (John/Jenny)'s problem is not a real medical illness; (4) People with a problem like (John/Jenny)'s are dangerous; (5) It is best to avoid people with a problem like (John/Jenny)'s so that you do not develop this problem; (6) People with a problem like (John/Jenny)'s are unpredictable; (7) If I had a problem like (John/Jenny)'s I would not tell anyone; (8) I would not employ someone if I knew they had a problem like (John/Jenny)'s; (9) I would not vote for a politician if I knew they had suffered a problem like (John/Jenny)'s.
The perceived stigma items presented the same statements but were designed to elicit the respondent's belief about the stigmatizing beliefs held by others using the stem “Most other people believe that …”. Ratings were made on a five‐point Likert scale ranging from 1 = “strongly agree” to 5 = “strongly disagree”. The Youth Survey assessed stigmatizing attitudes with similar sets of statements, but did not include statements (8) and (9) about employing and voting for the person.
Social distance
In the General Community Survey, self‐reported willingness to have contact with the person described in the vignette was measured using the five‐item scale developed by Link et al. (1999). The items rated the person's willingness to (1) move next door to (John/Jenny); (2) spend an evening socializing with (John/Jenny); (3) make friends with (John/Jenny); (4) work closely with (John/Jenny) on a job; (5) have (John/Jenny) marry into their family. Each item was rated on a four‐point scale ranging from 1 = “definitely willing” to 4 = “definitely unwilling”.
In the Youth Survey, social distance was assessed using five questions which were adapted for young people (Jorm and Wright, 2008) from the earlier mentioned scale (Link et al., 1999). The items were rated according to the respondent's willingness to (1) go out with (John/Jenny) on the weekend; (2) invite (John/Jenny) around to your house; (3) go to (John/Jenny's) house; (4) work closely with (John/Jenny) on a project; (5) develop a close friendship with (John/Jenny). Each item was rated on a four‐point scale ranging from 1 = “yes, definitely” to 4 = “definitely not”.
Statistical analysis
The status of the SDS as a pre‐existing scale and the parallel personal/perceived stigma format of the DSS suggest that a confirmatory factor analysis (CFA) approach to these scales would be fruitful to understanding the structure of the scales and of stigma. An impediment to the use of CFA is the requirement that fixed patterns of loadings must be specified. Further, the imposition of a pattern of binary loading/no loading that is central to CFA is often a key reason for poor fit. Forcing items to load only on factors with which they have a substantial association not only distorts loading patterns but has been shown to inflate correlations between factors and, as a consequence with other variables in models (Asparouhov and Muthén, 2009). Exploratory structural equation modelling (ESEM; Muthén and Muthén, 1998–2010) allows the pattern of loadings on specific factors within a model to be estimated from data, as in exploratory factor analysis (EFA), rather than being prespecified. However, features of structural equation modelling can be incorporated in ESEM. ESEM has been used to investigate group invariance and the temporal stability of factor structures of a number of inventories (see e.g. Marsh et al., 2010).
Previous exploratory principal components analyses which included personal and perceived stigma items in the same analyses have been equivocal regarding the number of factors and loading pattern (Griffiths et al., 2004; Jorm and Wright, 2008). However, it is clear that the set of items is multi‐dimensional. Jorm and Wright (2008) named two of the factors they found “Dangerous/unpredictable” and “Weak‐not‐sick.” The ESEM model defined two factors each for personal and perceived stigma, but did not constrain the pattern of loadings of items on each (see Figure 1). An additional factor in the model was defined by items from the social distance scale. As this involved only one factor, a confirmatory factor on which all items were permitted to load was specified. This factor was permitted to correlate freely with all exploratory factors. Item responses were treated as ordinal data with polychoric correlations estimated between items. Model parameters were estimated using the WLSMV method in Mplus 6.11 and were compared using the Difftest procedure (Muthén and Muthén, 1998–2010).
Figure 1.
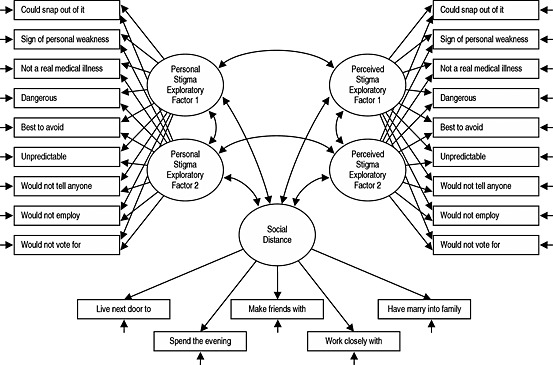
Exploratory structural equation modelling (ESEM) model of the Depression Stigma Scale and the Social Distance Scale.
Results
Exploratory structural equation modelling (ESEM) models
A series of nested ESEM models were fitted separately to the General Community and Youth Survey data. A preliminary analysis indicated that the fit for models with single factors each for personal and perceived stigma items would not be acceptable. Thus, the ESEM models allowed for two factors each for personal and perceived stigma items. These were exploratory factors on which all items loaded freely, rotated to an oblique solution using the Geomin algorithm. Residuals of corresponding personal and perceived stigma items were permitted to correlate. The social distance items were modelled as a single confirmatory factor that was permitted to correlate freely with the personal and perceived stigma factors. The first model permitted loadings on personal and perceived stigma factors to differ. The second model constrained loadings on corresponding personal and perceived factors to equality. The third model added constraint of response category thresholds. Outcomes of a final possibility – equality of residual variances for corresponding personal and perceived stigma items — are not reported due to technical problems fitting these models.
Table 1 reports model fit indices for the increasingly constrained models. For both surveys, Model 1 provided an excellent fit to the data with all indices exceeding recommended thresholds for acceptable fit. Constraining personal and perceived factor loadings (Model 2) resulted in relatively minor decrements in fit. The magnitude and statistical significance of the chi‐square goodness‐of‐fit tests reflect the large sample sizes involved. Constraining item thresholds (Model 3) introduced a notable decrease in model fit in both surveys.
Table 1.
Model fit statistics for Youth and General Community Surveys
| Model | Description | Number of parameters | χ 2 | df | Difftest χ2 | df | RMSEA (90% CI) | Pr(RMSEA ≤ .05) | CFI | TLI |
|---|---|---|---|---|---|---|---|---|---|---|
| Youth Survey | ||||||||||
| 1 | Loadings not constrained | 117 | 852.9 | 125 | — | — | 0.044 (0.041 – 0.047) | 1.000 | 0.98 | 0.98 |
| 2 | Loadings constrained equal | 107 | 948.5 | 135 | 108.7 | 10 | 0.045 (0.042 – 0.047) | 0.999 | 0.98 | 0.97 |
| 3 | Loadings and thresholds constrained | 81 | 3547.4 | 161 | 2895.9 | 26 | 0.083 (0.081 – 0.086) | 0.000 | 0.94 | 0.91 |
| General Community Survey | ||||||||||
| 1 | Loadings not constrained | 143 | 4268.4 | 197 | — | — | 0.059 (0.057 – 0.060) | 0.000 | 0.97 | 0.96 |
| 2 | Loadings constrained equal | 129 | 5430.0 | 211 | 920.9 | 14 | 0.064 (0.063 – 0.066) | 0.000 | 0.96 | 0.95 |
| 3 | Loadings and thresholds constrained | 95 | 10128.6 | 245 | 5251.3 | 34 | 0.082 (0.081 – 0.083) | 0.000 | 0.92 | 0.92 |
Note: All chi‐square (χ 2) tests are significant, p < 0.0001. RMSEA, root mean square error of approximation; CFI, comparative fit index; TLI, Tucker–Lewis index.
Model 2 provided a good, parsimonious fit to the data. More importantly, it establishes that personal stigma and that perceived in others have comparable measurement structures. Thus, this model was the focus of subsequent analyses. It should be noted that, due to sample size, very small factor loadings were highly statistically significant and confidence intervals were very narrow. Consequently, parameters are discussed in terms of their substantive magnitude, and p‐value and confidence intervals (CIs) are not reported.
Factor loadings shown in Table 2 indicate that the first factor, hereafter referred to as “Weak‐not‐sick”, comprises items which characterize the problem portrayed in the vignette as a personal weakness under the control of the person rather than as a medical condition. The item indicating a preference to avoid the person also loaded moderately on this factor. The second factor, hereafter referred to as “Dangerous/unpredictable”, was defined by items characterizing the vignette character as unpredictable and dangerous. The “Preference to avoid” item again loaded on this factor but more modestly than on the first factor. The items concerning not employing or voting for the person, which were included only in the General Community Survey, also loaded substantially on the second factor.
Table 2.
Factor loadings
| Loadings | ||||||
|---|---|---|---|---|---|---|
| General Community Survey | Youth Survey | |||||
| Item | Weak‐not‐sick | Dangerous/unpredictable | Social distance | Weak‐not‐sick | Dangerous/unpredictable | Social distance |
| Statement about own beliefs/what most other people believe | ||||||
| 1. Person could snap out of the problem | 0.82 | –0.08 | — | 0.72 | –0.01 | — |
| 2. Problem is a sign of personal weakness | 0.82 | 0.09 | — | 0.78 | 0.10 | — |
| 3. Problem is not a real medical illness | 0.78 | 0.00 | — | 0.75 | –0.04 | — |
| 4. People with this problem are dangerous | 0.09 | 0.58 | — | 0.02 | 0.61 | — |
| 5. Best to avoid people with this problem | 0.43 | 0.36 | — | 0.44 | 0.36 | — |
| 6. People with this problem are unpredictable | –0.07 | 0.67 | — | –0.08 | 0.67 | — |
| 7. If I had this problem I wouldn't tell anyone | 0.10 | 0.40 | — | 0.20 | 0.23 | — |
| 8. I would not employ someone with this problem | –0.01 | 0.73 | — | — | — | — |
| 9. I would not vote for a politician with this problem | 0.05 | 0.61 | — | — | — | — |
| Social distance a | ||||||
| 1. Move next door (Go out with on the weekend) | — | — | 0.79 | — | — | 0.81 |
| 2. Spend an evening socializing (Go to house) | — | — | 0.88 | — | — | 0.88 |
| 3. Make friends (Invite around to your house) | — | — | 0.88 | — | — | 0.89 |
| 4. Work closely (Work on a project with) | — | — | 0.85 | — | — | 0.75 |
| 5. Marry into family (Develop a close friendship with) | — | — | 0.85 | — | — | 0.86 |
Items in parentheses are those administered in the Youth Survey.
While not assessed formally, loadings for the Youth Survey were generally very similar to those from the General Community Survey. The clear exception to this was the item “If I had this problem, I wouldn't tell anyone.”, which loaded moderately on the Dangerous/unpredictable factor in the older‐aged General Community Survey but had no notable loading in the Youth Survey.
As Table 2 shows, all social distance items in both surveys loaded substantially and relatively uniformly on the single factor specified for them.
All factors were permitted to correlate freely. As shown in Table 3, for the General Community Survey, the correlation between the two personal stigma factors was moderate (0.37), with the comparable association for perceived stigma being larger (0.51). There was almost no association between the personal and perceived Weak‐not‐sick factors (0.04), although the Dangerous/unpredictable factors were moderately correlated (0.41). The Social Distance factor was generally not correlated with the stigma factors, except for the Personal Dangerous/unpredictable factor with which it was very highly correlated (0.69). The pattern of correlations for the Youth Survey was comparable to that for the General Community Survey with the exceptions of a stronger correlation between Personal and Perceived Dangerous/unpredictable factors and a substantially weaker correlation between Personal Dangerous/unpredictable and Social Distance.
Table 3.
Factor correlations, correlations of scale scores with factor scores and scale reliabilities (General Community Survey above diagonal; Youth Survey below diagonal)
| Personal stigma | Perceived stigma | Social distance | General Community Survey | |||||
|---|---|---|---|---|---|---|---|---|
| Weak‐not‐Sick | Dangerous/unpredictable | Weak‐not‐Sick | Dangerous/unpredictable | r scale~factor | Cronbach's α | |||
| Personal – Weak‐not‐sick | — | 0.37 | 0.04 | –0.19 | 0.26 | 0.94 | 0.74 | |
| Personal – Dangerous/unpredictable | 0.21 | — | 0.03 | 0.41 | 0.69 | 0.77 | 0.55 | |
| Perceived – Weak‐not‐sick | 0.11 | 0.02 | — | 0.51 | –0.05 | 0.97 | 0.78 | |
| Perceived – Dangerous/unpredictable | –0.17 | 0.59 | 0.51 | — | 0.26 | 0.85 | 0.74 | |
| Social distance | 0.14 | 0.36 | –0.04 | 0.18 | — | 0.99 | 0.88 | |
| Youth Survey | r scale~factor | 0.96 | 0.93 | 0.98 | 0.94 | 0.99 | — | — |
| Cronbach's α | 0.71 | 0.49 | 0.71 | 0.69 | 0.87 | — | — | |
rscale~factor = correlations of scale scores with factor scores.
The high correlation between the Personal Dangerous/unpredictable and Social Distance factors in the General Community Survey led to speculation that these two scales may not be distinct, a possibility heightened by the content and form of two stigma items being very similar to the social distance items. This was explored in two ways. Firstly, we allowed the “would not employ” and “would not vote for” stigma items to load on the Social Distance factor as well as the exploratory personal stigma factors. While statistically significant, the resultant loadings were small (less than 0.2) and those on the personal stigma factors were essentially unchanged. This implied that an alternative configuration with these items aligned with social distance was not viable. The second exploratory model removed these two items from the analysis. This resulted in a minimal reduction of the correlation between Personal Dangerous/unpredictable and Social Distance to 0.57.
Scale scores
Scales scores were constructed to reflect the structure of the dimensions revealed by modelling. Alternatives to this approach are further structural modelling or the use of factor scores. The former is inappropriate when looking for associations with multiple categorical variables and both approaches limit replicability by other researchers. In contrast, scale scores are easily calculated and used.
Scores reflecting each factor were calculated as the mean of items that loaded substantially (> 0.30) on the factor, with higher mean scores indicating more stigmatizing attitudes. In order to more confidently compare scores from each survey, the items asked only in the General Community Survey and the item concerning “telling others about the problem” were excluded from the scales in this paper. In studies where all items are administered, scale scores should be calculated as means for all relevant items. The resulting scores were compared to factor scores estimated by Mplus. Factor scores from all models were estimated. However, as they correlated extremely highly (≥ 0.97), only those from Model 2 were compared with the derived scales. Table 3 also shows that, despite the small number of items comprising the scales, most correlated very highly with the corresponding factor scores and had at least acceptable reliability. The “Dangerous/unpredictable” scales, notably the personal form, had lower reliability coefficients and correlations with factor scores. This was found to arise from disparate and skewed item distributions. The structural models accommodate this in their calculation of item threshold parameters, but reliability analyses and conventional correlations do not incorporate this refinement.
Group differences and correlates of the stigma scales
Having established their comparable measurement properties, we could then compare personal and perceived stigma scales (see Figure 2 for the distributions). Caution must be exercised in comparing distributions of the SDS between surveys as the items used in the Youth Survey were modified from the adult version. However, it is clear that there were dramatic differences in the distribution of “Weak‐not‐sick” and “Dangerous/unpredictable” scores for personal compared to perceived stigma in both surveys. Personal ratings were positively skewed, with most respondents reporting minimal or totally non‐stigmatizing attitudes. Appraisals of others were less generous, with a more stigmatized modal rating and more symmetric distribution of responses. Differences in the distributions of “Dangerous/unpredictable” scales were less marked, with the most notable differences being a lower mean (less stigmatizing) for personal compared to perceived stigma. Similar to personal “Weak‐not‐sick” stigma ratings, Social Distance had an essentially positively skewed distribution. Differences between the two surveys arose from a preference in the Youth survey for the “yes, definitely” (instead of “yes, probably”) response compared to “probably willing” (instead of “definitely willing”) in the General Community Survey.
Figure 2.

Distribution of Stigma Scale Scores (item means) in the General Community and Youth Surveys
Differences due to gender, age and vignette
Table 4 shows the means and standard deviations of the stigma scales. Analysis of variance (ANOVA) was used to investigate differences due to gender, age and vignette. In the General Community Survey, age was grouped as less‐than‐30, 30‐to‐59, and 60‐or‐older. In Youth Survey, age was classified as 15‐to‐17, 18‐to‐20, and 21‐to‐25. While some significant interactions between these factors were found, these tended to be small compared to main effects. Consequently, only main effects are described.
Table 4.
Stigma scales – means and standard deviations (in parentheses) by gender and age group
| Personal stigma | Perceived stigma | Social distance | |||
|---|---|---|---|---|---|
| Weak‐not‐sick | Dangerous/unpredictable | Weak‐not‐sick | Dangerous/unpredictable | ||
| General Community Survey | |||||
| Gender | |||||
| Male (N = 2501–2569) | 1.83 (0.78) | 2.42 (0.76) | 2.97 (0.89) | 3.15 (0.90) | 1.92 (0.63) |
| Female (N = 3119–3230) | 1.58 (0.67) | 2.31 (0.75) | 3.06 (0.96) | 3.18 (0.92) | 1.82 (0.61) |
| Age group | |||||
| < 30 (N = 1147–1161) | 1.82 (0.82) | 2.45 (0.75) | 3.14 (0.86) | 3.37 (0.84) | 1.89 (0.59) |
| 30–59 (N = 2883–2951) | 1.57 (0.68) | 2.31 (0.75) | 3.04 (0.93) | 3.20 (0.91) | 1.81 (0.60) |
| ≥ 60 (N = 1585–1692) | 1.80 (0.73) | 2.40 (0.75) | 2.88 (0.96) | 2.97 (0.93) | 1.95 (0.66) |
| Youth Survey | |||||
| Gender | |||||
| Male (N = 1442–1506) | 1.94 (0.79) | 2.40 (0.70) | 2.92 (0.86) | 3.02 (0.89) | 1.68 (0.56) |
| Female (N = 1430–1493) | 1.67 (0.71) | 2.22 (0.65) | 3.04 (0.89) | 2.98 (0.89) | 1.60 (0.55) |
| Age group | |||||
| 15–17 (N = 692–724) | 1.87 (0.73) | 2.33 (0.68) | 2.93 (0.86) | 3.08 (0.91) | 1.71 (0.56) |
| 18–20 (N = 1043–1073) | 1.76 (0.72) | 2.32 (0.69) | 2.98 (0.88) | 3.01 (0.90) | 1.62 (0.55) |
| 21–25 (N = 1139–1202) | 1.80 (0.82) | 2.29 (0.68) | 3.02 (0.87) | 2.94 (0.86) | 1.61 (0.55) |
N values for subgroups have minor variation between scales due to missing responses.
In the General Community Survey, significant gender differences were found for all scales, but were much larger for both personal and perceived “Dangerous/unpredictable” compared to the “Weak‐not‐sick” scales. Whereas females rated their personal stigma more favourably than did males, this pattern was reversed in perceptions of the stigmatizing views of others, although it should be noted that these differences were very small. Females also reported less social distance. In the Youth Survey, females had less stigmatizing attitudes for all scales except the perceived “Weak‐not‐sick” scale; however the magnitude of this gender difference was small. The difference between males and females on the perceived “Dangerous/unpredictable” factor was not significant.
In the General Community Survey, significant age‐group differences were found for all scales. For both personal stigma scales, respondents aged 30–59 years had the lowest mean stigma scores compared to younger and older groups. In contrast, perceived stigma was a clear decreasing function of age on both scales. Social distance reflected the pattern of the personal stigma scales.
Perhaps reflecting the relatively small age range, differences due to age group (15–17, 18–20, and 21–25 years) in the Youth Survey were not pronounced. Lower mean scores were a significant function of increasing age on the perceived “Dangerous/unpredictable” and Social Distance scales; while the two older groups had lower mean scores on the personal “Weak‐not‐sick” scale. Other differences were not significant.
Figure 3 shows mean scale scores as a function of the disorder portrayed in the vignette described to the respondent. In both surveys, differences across vignettes on both personal and perceived “Weak‐not‐sick” scales showed the same pattern and were minor. Variations on the “Dangerous/unpredictable” scales also had comparable patterns for personal and perceived scales, but differences between vignettes were larger. Social phobia and PTSD elicited the least stigmatized responses on the “Dangerous/unpredictable” scale in both surveys. However, social phobia was the most stigmatized on the “Weak‐not‐sick” scales in both surveys. Chronic and, to a lesser extent, early schizophrenia, elicited more stigma in the General Community Survey, whereas early schizophrenia and depression with alcohol abuse elicited the most stigma in the Youth Survey.
Figure 3.
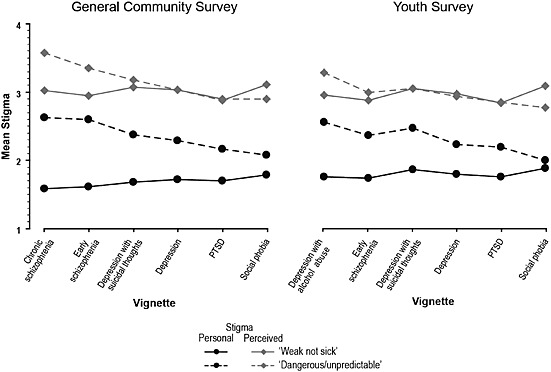
Mean stigma scale scores as a function of vignette type in the General Community and Youth Surveys
Discussion
The application of novel methods of ESEM in this study has revealed that the structure of stigmatizing attitudes in young people and adults is comparable in personally held attitudes and those perceived in others. In addition, scales reflecting these dimensions have different patterns of association with respondent age and gender, and the type of mental disorder portrayed in the vignette.
In particular, we found that personally‐held stigmatizing attitudes and those perceived in others form distinct but parallel domains. This substantially refines the two‐factor structure for the DSS hypothesized by Griffiths et al. (2004), replicates their findings with adults (Griffiths et al., 2008), and extends them by demonstrating a similar structure in a youth sample. As argued by Griffiths et al. (2008), the differentiation of personal and perceived stigma has important implications for the interpretation of findings from studies examining the predictors of stigma, as well as for the design, evaluation, and dissemination of interventions to reduce stigma.
Personal and perceived stigma are not unitary dimensions, but each comprised two factors, characterized by us as “Weak‐not‐sick” and “Dangerous/unpredictable”. The latter partly replicates Jorm and Wright's (2008) findings, and extends them by demonstrating a similar structure in a nationally representative adult sample. An important difference between the current findings and those by Jorm and Wright (2008) is the distinction in the current study between personally held beliefs about dangerousness and unpredictability and those perceived in others. Measuring both “Weak‐not‐sick” and “Dangerous/unpredictable” factors separately for personal and perceived stigma using parallel scales may help to further elucidate the implications of their associations with help seeking as well as their predictors. For example, higher levels of the “Dangerous/unpredictable” stigma factor as defined by Jorm and Wright (2008) – combining personal and perceived dimensions – has been found to be predicted by the use of accurate psychiatric labelling of psychosis by young people (Wright et al., 2011). However, it is also associated with increased preference for and belief in the helpfulness of recommended sources of help including psychiatrists (Yap et al., 2011). Measuring the Dangerous/unpredictable factor separately for personal and perceived stigma may shed light on the implications of previous findings for the design of community education interventions to reduce stigma and enhance help seeking.
In addition, we replicated Jorm and Wright's (2008) finding that the social distance dimension of stigma is separate from other components of stigma, supporting the appropriateness of existing SDSs. Interestingly, again similar to Jorm and Wright (2008), we found that the reluctance to disclose item [You would not tell anyone if you have a problem like (John's/Jenny's)] did not load on any of the stigma dimensions in the youth sample. However, it loaded moderately on both the personal and perceived Dangerous/unpredictable factors in the General Community Survey. This suggests that in the older‐aged sample, reluctance to disclose one's mental health difficulties may be associated with beliefs about the dangerousness or unpredictability of the problem; whereas among youths, such a reluctance may be associated with other factors, such as male gender and lack of exposure to close others who have sought help for their mental health problems (Jorm and Griffiths, 2008).
Unlike Jorm and Wright (2008), we found that the items about believing that “It is best to avoid people with a problem like (John/Jenny)'s so that you don't develop this problem yourself” loaded moderately on both the “Weak‐not‐sick” and “Dangerous/unpredictable” factors for both the personal and perceived stigma dimensions. Nonetheless, it should be noted that Jorm and Wright (2008) did find some moderate cross‐loadings for these items as well. It is likely that a preference to avoid people with mental disorders is to some extent associated with both the belief that mental illness is a reflection of a personal weakness, as well as the belief that it makes the person dangerous or unpredictable.
We found that “Weak‐not‐sick” stigmatizing attitudes, both personally held attitudes and those perceived in others, did not vary much on account of the mental disorder portrayed in the vignette. However, social phobia was rated higher on the “Weak‐not‐sick” scale than the other disorders, validating the separation of the “Weak‐not‐sick” and “Dangerous/unpredictable” factors. However, perceptions of dangerousness or unpredictability varied more markedly depending on the mental disorder portrayed. In particular, social phobia and PTSD were least stigmatized in terms of dangerousness or unpredictability in both samples. These findings are consistent with Jorm and Wright's (2008) finding involving social phobia, as well as other smaller studies in other countries involving PTSD (Arbanas, 2008; Sorsdahl and Stein, 2010). This is unsurprising given that anxiety disorders are characterized by withdrawal‐like behaviour and hence are less likely to be associated with potential harm to others. In contrast, both schizophrenia vignettes for the general community sample, and early schizophrenia and depression with alcohol abuse for the youth sample, were the most stigmatized in terms of dangerousness or unpredictability. These findings, especially those related to schizophrenia, are likely to be influenced by media portrayals of the associations between violence and psychosis (Hazelton, 1997; Hocking, 2003), given that personal encounters with a violent person with schizophrenia are likely to be rare (Jorm et al., 2012).
Examination of age and gender differences revealed lower stigmatizing attitudes in females and in those aged between 30 and 59. While some other studies have shown lower stigmatizing attitudes in females (Griffiths et al., 2008), reviews of associations between stigmatizing attitudes and gender have not generally found reliable gender differences, although the desire for social distance declines during adolescence and is higher in older than younger adults (Jorm and Oh, 2009; Jorm et al., 2012).
Strengths and limitations
This study addressed some gaps in the stigma measurement literature by examining the measurement properties of two widely used stigma scales, the DSS and SDS, in two large national samples. Importantly, it utilized novel methods of ESEM and included six different vignettes portraying different mental disorder presentations.
Nonetheless, the current findings should be considered in light of its limitations. Firstly, there were only a small number of items on each scale, limiting the usefulness of the results. In addition, other important components of stigma (e.g. self‐stigma, discriminatory behaviour and experienced stigma) were not measured in this study. More systematic coverage of potential stigma items based on initial qualitative research into the many aspects of stigma is required. It is possible that the structure of response may vary according to the vignette presented. While breadth of mental disorders covered is a strength of the study, future refinement may be obtained by comparing structures of data from various vignettes, each in a larger sample. Given that the surveys asked explicitly about stigma and may be affected by the social desirability of responses, future work is required to examine implicit and behavioural measures. In addition, hypothetical vignettes were used in the survey and might not truly reflect the actual experience of conceptualizing a problem in real life, whether it be in oneself or others. In addition, study findings may have limited application to other cultures as the social context around the stigma of mental illness is likely to vary.
Conclusions
Findings from the current study indicate that personally held stigmatizing attitudes and those perceived in others have a similar structure, each comprising two components, namely “Weak‐not‐sick” and “Dangerous/unpredictable”. In addition, this factor structure is similar for the general community aged 15+ and for youths aged 15–25 years.
Declaration of interest statement
The authors have no competing interests.
Acknowledgements
Funding for the study was provided by the Commonwealth Department of Health and Ageing and an NHMRC Australia Fellowship awarded to Professor Jorm.
References
- Arbanas G. (2008) Adolescents' attitudes toward schizophrenia, depression and PTSD. Journal of Psychosocial Nursing and Mental Health Services, 46(3), 45–51. [DOI] [PubMed] [Google Scholar]
- Asparouhov T., Muthén B. (2009) Exploratory structural equation modeling. Structural Equation Modeling, 16, 397–438. [Google Scholar]
- Bogardus E.S. (1933) A social distance scale. Sociology and Social Research, 17, 265–271. [Google Scholar]
- Griffiths K.M., Christensen H., Jorm A.F. (2008) Predictors of depression stigma. BMC Psychiatry, 8, 25. [DOI] [PMC free article] [PubMed] [Google Scholar]
- Griffiths K.M., Christensen H., Jorm A.F., Evans K., Groves C. (2004) Effect of web‐based depression literacy and cognitive‐behavioural therapy interventions on stigmatising attitudes to depression: randomised controlled trial. British Journal of Psychiatry, 185, 342–349. [DOI] [PubMed] [Google Scholar]
- Griffiths K.M., Nakane Y., Christensen H., Yoshioka K., Jorm A.F., Nakane H. (2006) Stigma in response to mental disorders: a comparison of Australia and Japan. BMC Psychiatry, 6, 21. [DOI] [PMC free article] [PubMed] [Google Scholar]
- Hazelton M. (1997) Reporting mental health: a discourse analysis of mental health‐related news in two Australian newspapers. Australian and New Zealand Journal of Mental Health Nursing, 6, 73–89. [PubMed] [Google Scholar]
- Hocking B. (2003) Reducing mental illness stigma and discrimination – everybody's business. Medical Journal of Australia, 178(Suppl), S47–S48. [DOI] [PubMed] [Google Scholar]
- Jorm A.F., Griffiths K.M. (2008) The public's stigmatizing attitudes towards people with mental disorders: how important are biomedical conceptualizations? Acta Psychiatrica Scandinavica, 118, 315–321. [DOI] [PubMed] [Google Scholar]
- Jorm A.F., Nakane Y., Christensen H., Yoshioka K., Griffiths K.M., Wata Y. (2005) Public beliefs about treatment and outcome of mental disorders: a comparison of Australia and Japan. BMC Medicine, 3, 12. [DOI] [PMC free article] [PubMed] [Google Scholar]
- Jorm A.F., Oh E. (2009) Desire for social distance from people with mental disorders. Australian and New Zealand Journal of Psychiatry, 43, 183–200. [DOI] [PubMed] [Google Scholar]
- Jorm A.F., Reavley N.J., Ross A.N. (2012) Belief in the dangerousness of people with mental disorders: a review. Australian and New Zealand Journal of Psychiatry, 46(11), 1029–1045. [DOI] [PubMed] [Google Scholar]
- Jorm A.F., Wright A. (2008) Influences on young people's stigmatising attitudes towards peers with mental disorders: national survey of young Australians and their parents. British Journal of Psychiatry, 192, 144–149. [DOI] [PubMed] [Google Scholar]
- Jorm A.F., Wright A., Morgan A.J. (2007) Beliefs about appropriate first aid for young people with mental disorders: findings from an Australian national survey of youth and parents. Early Intervention in Psychiatry, 1, 61–70. [DOI] [PubMed] [Google Scholar]
- Kessler R.C., Andrews G., Colpe L.J., Hiripi E., Mroczek D.K., Normand L.T., Walters E.E., Zaslavsky A.M. (2002) Short screening scales to monitor population prevalences and trends in non‐specific psychological distress. Psychological Medicine, 32, 959–976. [DOI] [PubMed] [Google Scholar]
- Link B.G., Phelan J.C., Bresnahan M., Stueve A., Pescosolido B.A. (1999) Public conceptions of mental illness: labels, causes, dangerousness, and social distance. American Journal of Public Health, 89, 1328–1333. [DOI] [PMC free article] [PubMed] [Google Scholar]
- Livingston J.D., Boyd J.E. (2010) Correlates and consequences of internalized stigma for people living with mental illness: a systematic review and meta‐analysis. Social Science & Medicine, 71, 2150–2161. [DOI] [PubMed] [Google Scholar]
- Mak W.W., Poon C.Y., Pun L.Y., Cheung S.F. (2007) Meta‐analysis of stigma and mental health. Social Science & Medicine, 65, 245–261. [DOI] [PubMed] [Google Scholar]
- Marsh H.W., Lüdtke O., Muthén B., Morin A.J.S., Trautwein U., Nagengast B. (2010) A new look at the big‐five factor structure through exploratory structural equation modeling. Psychological Assessment, 22, 471–491. [DOI] [PubMed] [Google Scholar]
- Mason J. (2006) Key Influences on the Design and Implementation of MindMatters, Adelaide, Australian Principals Association Professional Development Council. [Google Scholar]
- Muthén L.K., Muthén B.O. (1998–2010) Mplus User's Guide, Los Angeles, CA, Muthén & Muthén. [Google Scholar]
- Mwamwenda T.S. (1995) Age differences in social desirability. Psychological Report, 76, 825–826. [DOI] [PubMed] [Google Scholar]
- Nuevo R., Montorio I., Marquez‐Gonzalez M., Cabrera I., Izal M., Perez‐Rojo G. (2009) Age‐related differences in the effect of social desirability on self‐reported emotional state. Revista Española de Geriatría y Gerontología, 44, 85–89. [DOI] [PubMed] [Google Scholar]
- Reavley N.J., Jorm A.F. (2011a) Recognition of mental disorders and beliefs about treatment and outcome: findings from an Australian National Survey of Mental Health Literacy and Stigma. Australian and New Zealand Journal of Psychiatry, 45, 947–956. [DOI] [PubMed] [Google Scholar]
- Reavley N.J., Jorm A.F. (2011b) Stigmatizing attitudes towards people with mental disorders: findings from an Australian National Survey of Mental Health Literacy and Stigma. Australian and New Zealand Journal of Psychiatry, 48, 1086–1093. [DOI] [PubMed] [Google Scholar]
- Reavley N.J., Jorm A.F. (2011c) Young people's recognition of mental disorders and beliefs about treatment and outcome: findings from an Australian national survey. Australian and New Zealand Journal of Psychiatry, 45, 890–898. [DOI] [PubMed] [Google Scholar]
- Sorsdahl K.R., Stein D.J. (2010) Knowledge of and stigma associated with mental disorders in a South African community sample. Journal of Nervous and Mental Disease, 198, 742–747. [DOI] [PubMed] [Google Scholar]
- Watson A.C., Miller F.E., Lyons J.S. (2005) Adolescent attitudes toward serious mental illness. Journal of Nervous and Mental Disease, 193, 769–772. [DOI] [PubMed] [Google Scholar]
- Wolff G., Pathare S., Craig T., Leff J. (1996) Community attitudes to mental illness. British Journal of Psychiatry, 168, 183–190. [DOI] [PubMed] [Google Scholar]
- World Health Organization . (2001) The World Health Report: Mental Health: New Understanding, New Hope, Geneva, World Health Organization. [Google Scholar]
- Wright A., Jorm A.F., Mackinnon A.J. (2011) Labeling of mental disorders and stigma in young people. Social Science & Medicine, 73, 498–506. [DOI] [PubMed] [Google Scholar]
- Yap M.B.H., Wright A., Jorm A. (2011) The influence of stigma on young people's help‐seeking intentions and beliefs about the helpfulness of various sources of help. Social Psychiatry and Psychiatric Epidemiology, 46, 1257–1265. [DOI] [PubMed] [Google Scholar]