

Abstract
The aim of this analysis was to identify Young Mania Rating Scale (YMRS) meaningful benchmarks for clinicians (severity threshold, minimal clinically significant difference [MCSD]) using the Clinical Global Impressions Bipolar (CGI‐BP) mania scale, to provide a clinical perspective to randomized clinical trials (RCTs) results.
We used the cohort of patients with acute manic/mixed state of bipolar disorders (N = 3459) included in the European Mania in Bipolar Longitudinal Evaluation of Medication (EMBLEM) study. A receiver‐operating characteristic analysis was performed on randomly selected patients to determine the YMRS optimal severity threshold with CGI‐BP mania score ≥ “Markedly ill” defining severity. The MCSD (clinically meaningful change in score relative to one point difference in CGI‐BP mania for outcome measures) of YMRS, was assessed with a linear regression on baseline data.
At baseline, YMRS mean score was 26.4 (±9.9), CGI‐BP mania mean score was 4.8 (±1.0) and 61.7% of patients had a score ≥ 5. The optimal YMRS severity threshold of 25 (positive predictive value [PPV] = 83.0%; negative predictive value [NPV] = 66.0%) was determined. In this cohort, a YMRS score of 20 (typical cutoff for RCTs inclusion criteria) corresponds to a PPV of 74.6% and to a NPV of 77.6%, meaning that the majority of patients included would be classified as severely ill. The YMRS minimal clinically significant difference was 6.6 points. Copyright © 2013 John Wiley & Sons, Ltd.
Keywords: bipolar disorder, severity threshold, Young Mania Rating Scale, receiver‐operating characteristic analysis, minimal clinically significant difference
Introduction
Indicators of clinical severity of bipolar disorder generally include age of onset, symptom severity, work impairment, comorbidities, recurrence, pharmacological treatment response (Merikangas et al., 2007), and compliance. Baseline symptomatic severity is thus an important indicator in clinical trials assessing treatment efficacy in acute mania. For research purposes in manic states, baseline severity is usually assessed by combining global rating scales like the Clinical Global Impression Bipolar (CGI‐BP) mania scale and specific scales such as the Mania Rating Scale (MRS) or the Young Mania Rating Scale (YMRS). Compared to the YMRS/MRS which focuses on current clinical symptoms, CGI is a global subjective clinical measure that intends to capture other clinical and non‐clinical indicators of severity.
Inclusion criteria usually require a minimum score on the specific scales to characterize the severity of the disease diagnosed according to Diagnostic and Statistical Manual of Mental Disorders, 4th Edition (DSM‐IV). A score of 20 is usually required for the YMRS (Tohen et al., 2000). However, this threshold of 20 is rather arbitrary and has not been formally validated. For the MRS, a previous study performed a ROC (receiver‐operating characteristic) analysis on a large sample of patients with mania, and determined as the best compromise of sensitivity, sensibility, positive predictive value (PPV) and negative predictive value (NPV), a severity threshold of 39 in a score range from zero to 52, using DSM‐IV mania severity criteria as a reference (Azorin et al., 2007).
In randomized clinical trials (RCTs) assessing atypical antipsychotic efficacy in acute mania, mean baseline YMRS scores have been reported within a range of 28 to 32 (Tohen et al., 1999; Keck et al., 2003; Tohen et al., 2003; Perlis et al., 2006). Some authors have challenged the generalization of those RCTs outcomes as they consider that patients included were not “really severely ill” patients compared to those in clinical practice (Storosum et al., 2004; Feinstein and Horwitz, 1997) and they argue that the strict inclusion/exclusion criteria currently used in RCTs exclude de facto a number of severely ill patients (i.e. with comorbidities). The most frequently used scale in mania is the YMRS, but a severity threshold is needed to interpret its value and clinically assess the severity of the patients that were included in the RCTs.
A second question is how to interpret the clinical relevance of baseline to endpoint mean YMRS score differences, the primary outcomes of most of those RCTs. Commonly observed improvements range from 15 to 29 points for YMRS and from 1.5 to 2.6 for CGI‐BP mania (Tohen et al., 1999; Keck et al., 2009; Wolfe et al., 2005; Make, 2007; Hajiro and Nishimura, 2002). Cohen's d effect size or the Number Needed to Treat (NNT) translation of those differences represents a valuable contribution to the understanding of the magnitude of those outcomes. A complementary tool available to clinicians includes the minimal clinically significant difference (MCSD), which aims to define a clinically meaningful change in score relative to one point of CGI for outcome measures (Ghaemi, 2008; Frye, 2008; Goetz et al., 2007). By design, the CGI‐BP mania allows the categorization of patients according to a severity spectrum. Each value of this scale corresponds to a definition of the severity of the condition (e.g. a score of five is equivalent to “Markedly ill”).
The patient cohort included in the European Mania in Bipolar Longitudinal Evaluation of Medication (EMBLEM) study offers the opportunity to analyze functioning, impairment, prescriptions patterns, and clinical severity. The study was a two‐year prospective, observational study assessing outcomes (psychiatric history, clinical and functional status) of patients suffering from manic and mixed states (Ghaemi, 2008; Frye, 2008; Goetz et al., 2007; Haro et al., 2006; Montoya et al., 2007), where YMRS and CGI‐BP mania scales were collected at different time points.
This large observational study included more than 3000 patients with a wide range of severity. The aim of these analyses was to determine the YMRS severity threshold (ROC analysis) and the minimal clinically significant difference (regression analysis), in order to provide clinicians with meaningful benchmarks to interpret the clinical relevance of RCTs results. Only baseline data could be used for these analyses as the YMRS score fell drastically at the second assessment.
Methods
Study design
EMBLEM is a two‐year prospective, observational study on the outcomes of pharmacological treatment in patients with bipolar disorder who experienced a manic/mixed episode. A broad representation of 530 psychiatrists from 14 European countries (Belgium, Denmark, Finland, France, Germany, Greece, Ireland, Italy, the Netherlands, Norway, Portugal, Spain, Switzerland and the UK) participating in this study enrolled 3684 patients between December 2002 and June 2004. Only 10 countries have taken part in the maintenance phase. The acute phase of the study lasted 12 weeks and included five post‐baseline follow‐up visits at 1, 2, 3, 6, and 12 weeks following the onset of antimanic treatment. During the maintenance phase, the patients were assessed at 6, 12, 18, and 24 months. Patients gave their informed consent for taking part in the study and confidentiality was kept in compliance with local laws.
Participants
Adult inpatients or outpatients suffering an acute or mixed bipolar episode were enrolled at the discretion of their treating psychiatrist within the normal course of care and if their treating physician decided to initiate or change oral medication for the treatment of acute mania (antipsychotics, anticonvulsants, and/or lithium; not antidepressants or benzodiazepines). Investigators were asked, but not obliged, to include a similar number of patients initiating olanzapine or any other antimanic treatment. Treatment decisions were made prior to the enrollment into the study and all treatment decisions were left at the discretion of the treating psychiatrist. The sponsor of this observational study did not provide medication. To be eligible for statistical analysis, patients needed to have completed the acute phase of the study and be able to participate in the maintenance phase and have no missing YMRS, CGI‐BP overall or mania ratings at baseline. A total of 3255 patients were included in the analysis for this report.
Assessments
Baseline data included patient socio‐demographic characteristics, psychiatric history, and treatments prescribed. Clinical severity was assessed by the YMRS (Young et al., 1978), the CGI‐BP scales – overall bipolar symptoms, manic symptoms, depressive symptoms, and hallucinations and delusions – (Spearing et al., 1997), and the Hamilton Depression Rating Scale (modified version of five items, tailored to the depressive symptoms of the manic episode) (González‐Pinto et al., 2003).
The YMRS is an 11‐item clinician‐administered instrument used to assess the severity of mania. Symptoms ratings are based on a clinical interview and include the following: Elevated mood, Increased motor activity/energy, Sexual interest, Sleep, irritability, Speech, language/thought disorder, Content, disruptive/aggressive behavior, Appearance, Insight. Each item is composed of five explicitly defined levels of severity. Severity ratings are based on the patient's subjective report of his clinical condition during the past 48 hours and the clinician's observations during the interview. YMRS total score varies between zero and 60. This scale has shown good psychometric properties. Indeed, reliability of the scale was demonstrated by an interrater correlation for the total score of 0.93, and concurrent validity by high correlations between the YMRS total score and scores on other scales, such as a correlation of 0.88 between the YMRS and an independent global rating. The YMRS score was also shown to correlate well with length of patients' hospital stay and to differentiate between scores before and after treatment (Young et al., 1978). The major drawbacks of the scale are that it assesses only manic symptoms (there are no items assessing depression), it may be difficult to administer in patients who are highly thought disordered; and it may not be as sensitive for mild forms of mania, such as hypomania (Vieta, 2010).
The CGI‐BP scale is the gold standard measure of the global severity of illness. Rating this scale, the clinician integrates clinical presentation, episode duration and frequency, functional outcomes, etc. While the CGI‐BP scale improves upon the original CGI scale in the several ways noted earlier, liabilities of the scale remain due primarily to its nature as a global rating instrument. The concept of a global rating scale inherently involves a degree of integration of information and subjectivity which is not as prevalent in more differentiated, symptom‐based rating scales. However, the flexibility and requirement of the CGI‐BP scale to accommodate the differing illness characteristics into a single rating or set of ratings is unique and adds to the overall value of the scale in evaluating degree of response to treatment in bipolar illness (Spearing et al., 1997).
Statistical analysis
YMRS threshold research
ROC analysis allows determining the optimal threshold of a diagnostic test that provides the best balance between the test properties. Usually, sensitivity and specificity are displayed but PPV and NPV can also be used and present more sense from a clinical perspective (Farrar et al., 2003). In this study, a ROC analysis was performed to determine the optimal severity threshold of the YMRS, with a severity reference defined by a CGI‐BP mania score larger than or equal to five (“5 = Markedly ill”, “6 = Much worse”, or “7 = Among the most extremely ill patients”) (González‐Pinto et al., 2003).
A ROC curve, which is a plot of sensitivity versus 1 – specificity, was calculated. Distance from the curve to the ideal point (i.e. the cutoff with maximizing specificity and sensitivity tending toward 100%) is calculated by the application of the Pythagorean Theorem (distance to the ideal = √[(1 – sensitivity)2 + (1 – specificity)2]). Graphically, the point on the curve with the shortest distance to the ideal point will determine the cutoff threshold on the YMRS.
The optimal threshold is usually a compromise between sensitivity and specificity when the test is used for screening purposes (Azorin et al., 2007; Ancelle, 2002; Bouyer et al., 1993). In this study, the main objective is different: assessing the severity threshold to interpret baseline characteristics in clinical trials. This severity threshold is thus based on a compromise between PPVs and NPVs. The PPV is the probability that the patient has severe mania given that the YMRS score exceeds the YMRS threshold proposed (PPV = True Positive/[True Positive + False Positive]), while NPV is the probability that the patient has no severe mania given that the YMRS score is below the YMRS threshold proposed (NPV = True Negative/[False Negative + True Negative]). These formulas (PPV, NPV) can be used because in this sample the prevalence of the pathology is known. The precision is the capacity of the YMRS threshold to correctly identify severely ill and not severely ill patients (Precision = [True Positive + True Negative]/[True Positive + False Positive + False Negative + True Negative]).
To validate our results and as recommended in the literature (Bleeker et al., 2003; Metz, 1978), we defined our threshold on the half of our population randomly selected (training set) and validated it on the other half (test set) subsequently.
PPV, NPV, sensitivity, and specificity were calculated for each score of YMRS (from zero to 60) and the area under the curve on the random sample (ROC analysis).
Multivariate linear regression
We assessed the MCSD of the YMRS by using a variation of one point of CGI‐BP mania as a reference. MCSD defines the clinical meaningfulness of symptomatic scale score change relative to one point of CGI. This one point of CGI gives the clinician a benchmark by which clinical relevance may vary across pathology, functional states, therapeutic aim, assumptions, etc. (Hajiro and Nishimura, 2002; Lauridsen et al., 2006).
A linear regression of YMRS scores according to CGI‐BP mania scores permits to quantify the coefficient associated with the one point difference of CGI. This coefficient is equivalent to the corresponding variation of the YMRS. This regression was performed on baseline data to have all the spectrum of YMRS scores. Indeed, YMRS mean score at subsequent visit (at six weeks) was very low (8.98 ± 8.24). The necessary condition of a linear relation between YMRS and CGI scores to perform this analysis was visually observed on the baseline data (additional online material Figure A) and confirmed by calculation of the Pearson's correlation coefficient between these two measures. None of the analyzed patients had a score of 1 (“Normal, not ill”) or 2 (“Minimally ill”) so the linear relation could not be verified for the small scores of CGI‐BP mania.
As for the threshold analysis, the linear regression was performed on the same half of the randomly selected population (training set). Robustness was checked with an additional linear regression excluding the most influential subjects in the model (with standardized residuals larger than two, in absolute values). Finally, coefficients determined with the first regression were used to estimate YMRS score in the second half of the population (test set). Then, both YMRS scores (observed and calculated) were graphically compared. Another linear regression was performed on the second half of the population (test set) in order to verify if coefficients were close to those found with the first linear regression on the other half of the randomly identified population.
Sensitivity analysis
Finally, a descriptive comparison of severely ill and not severely ill patients, defined according to the estimated YMRS severity threshold, was performed on the entire sample (N = 3255) on variables reflecting acute and long‐term functional and clinical severity, to explore external validity of the chosen threshold. The variables assessed clinical severity (suicide attempts, compliance, hallucinations, psychosis, CGI‐BP scales score) and functional status (work impairment, social activities, relationship, satisfaction with life).
Results
Participants' characteristics and disposition at baseline (Table 1)
Table 1.
Description of the population at baseline
| Entire sample N = 3255 | YMRS threshold | P Value | ||
|---|---|---|---|---|
| <25 N = 1451 (44.6%) | ≥25 N = 1804 (55.4%) | |||
| Sociodemographic data | ||||
| Agea, mean (SD), years | 44.7 (13.5) | 46.2 (13.6) | 43.5 (13.3) | <0.0001 |
| Sex | 0.141 | |||
| Female, n (%) | 1746 (55.6) | 798 (57.1) | 948 (54.5) | |
| Male, n (%) | 1393 (44.4) | 600 (42.9) | 793 (45.5) | |
| Type of residence | 0.003 | |||
| No independent residence, n (%) | 1350 (41.5) | 561 (38.7) | 789 (43.8) | |
| Independent residence, n (%) | 1900 (58.5) | 888 (61.3) | 1012 (56.2) | |
| Marital status | ||||
| No relationship, n (%) | 1326 (40.8) | 553 (38.2) | 773 (42.9) | |
| Not living together, n (%) | 537 (16.5) | 221 (15.3) | 338 (18.8) | |
| Living together, n (%) | 1387 (42.7) | 675 (46.6) | 712 (39.5) | |
| Disease history | ||||
| Age of first onset of | ||||
| symptoms of bipolar disorderc, mean (SD), years | 29.8 (10.9) | 30.4 (11.4) | 29.2 (10.5) | 0.005 |
| depressive episoded, mean (SD), years | 30.9 (11.5) | 31.5 (12.0) | 30.4 (11.0) | 0.039 |
| manic or mixedc, mean (SD), years | 31.2 (11.7) | 32.1 (12.1) | 30.6 (11.3) | 0.002 |
| Treatment for mood symptomsd, mean (SD), years | 31.2 (11.2) | 32.1 (11.6) | 30.4 (10.8) | 0.0002 |
| Number of manic or mixed episodes in previous 12 months | 0.004 | |||
| 1, n (%) | 1792 (55.9) | 761 (53.1) | 1031 (58.2) | |
| 2, n (%) | 901 (28.1) | 430 (30.0) | 471 (26.6) | |
| 3, n (%) | 208 (6.5) | 85 (5.9) | 123 (7.0) | |
| 4 or more, n (%) | 142 (4.4) | 69 (4.8) | 73 (4.1) | |
| Unknown, n (%) | 161 (5.0) | 88 (6.1) | 73 (4.1) | |
| Number of depressive episodes in previous 12 months | <0.0001 | |||
| 0, n (%) | 1424 (44.0) | 529 (36.7) | 895 (49.9) | |
| 1, n (%) | 1057 (32.7) | 508 (35.3) | 549 (30.6) | |
| 2, n (%) | 335 (10.4) | 190 (13.2) | 145 (8.1) | |
| 3, n (%) | 92 (2.9) | 63 (4.4) | 29 (1.6) | |
| 4 or more, n (%) | 83 (2.6) | 47 (3.3) | 36 (2.0) | |
| Unknown, n (%) | 242 (7.5) | 104 (7.2) | 138 (7.7) | |
| Number of bipolar disorder related admissionsb, n (SD) | 1.0 (2.5) | 0.9 (2.9) | 1.1 (2.2) | |
| Number of suicide attempts (within the last 12 months) | ||||
| None, n (%) | 2927 (91.3) | 1307 (91.6) | 1620 (91.0) | |
| At least 1, n (%) | 226 (7.0) | 107 (7.5) | 119 (6.7) | |
| Unknown, n (%) | 54 (1.7) | 13 (0.9) | 41 (2.3) | |
| Compulsory admissione, n (%) | 516 (38.1) | 86 (21.7) | 430 (44.9) | <0.0001 |
| Current episode | ||||
| Rapid cycled, n (%) | 497 (17.1) | 274 (21.2) | 223 (13.8) | <0.0001 |
| Delusions or hallucinationsc, n (%) | 1375 (48.8) | 370 (30.6) | 1005 (62.5) | <0.0001 |
| Presence of psychosis at this timea, n (%) | 1285 (39.6) | 293 (20.3) | 992 (55.1) | <0.0001 |
| Status | ||||
| Outpatient (day hospitalizations and day‐care included), n (%) | 1967 (60.6) | 1097 (75.9) | 870 (48.3) | |
| Inpatient, n (%) | 1280 (39.4) | 348 (24.1) | 932 (51.7) | |
| Substance abuse and dependence | ||||
| Alcoholb, n (%) | 806 (25.2) | 320 (22.5) | 486 (27.4) | 0.002 |
| Cannabisb, n (%) | 438 (13.8) | 147 (10.4) | 291 (16.5) | <0.0001 |
| Substancea, n (%) | 266 (8.6) | 98 (6.8) | 168 (9.4) | 0.008 |
| Compliance in the past four weeks | ||||
| No bipolar disorder medication, n (%) | 667 (20.6) | 267 (18.5) | 400 (22.3) | |
| Almost always compliant, n (%) | 1620 (50.1) | 883 (61.3) | 737 (41.1) | |
| Compliant about half the time, n (%) | 675 (20.9) | 237 (16.5) | 438 (24.4) | |
| Almost never compliant, n (%) | 274 (8.5) | 54 (3.8) | 220 (12.3) | |
| Psychiatric scale scores | ||||
| YMRS score, mean (SD) | 26.4 (9.9) | ‐ | ‐ | |
| CGI‐BP scores | ||||
| Mania, mean (SD) | 4.8 (1.0) | 4.2 (0.8) | 5.2 (0.8) | <0.0001 |
| Overall bipolar illness, mean (SD) | 4.7 (1.0) | 4.2 (0.9) | 5.1 (1.0) | <0.0001 |
| Overall bipolar illness in the last data collectiona, mean (SD) | 4.1 (1.3) | 3.9 (1.2) | 4.3 (1.4) | <0.0001 |
| Hallucinations/delusionsa, mean (SD) | 2.9 (1.8) | 2.1 (1.4) | 3.6 (1.8) | <0.0001 |
| Depressiona, mean (SD) | 1.9 (1.2) | 2.0 (1.3) | 1.7 (1.1) | <0.0001 |
| Functional outcomes | ||||
| Social activities | 0.983 | |||
| Never, n (%) | 650 (20.0) | 290 (20.0) | 360 (20.0) | |
| Once or more, n (%) | 2596 (80.0) | 1157 (80.0) | 1439 (80.0) | |
| Work impairment | 0.529 | |||
| Impairment, n (%) | 2742 (85.0) | 1237 (86.1) | 1505 (84.1) | |
| No impairment, n (%) | 353 (10.9) | 153 (10.6) | 200 (11.2) | |
| Not applicable, n (%) | 131 (4.1) | 47 (3.3) | 84 (4.7) | |
| Satisfaction with life | <0.0001 | |||
| Dissatisfied, n (%) | 1315 (40.5) | 620 (43.0) | 695 (38.6) | |
| Neither satisfied nor dissatisfied, n (%) | 856 (26.4) | 408 (28.3) | 448 (24.9) | |
| Satisfied, n (%) | 1074 (33.1) | 415 (28.8) | 659 (36.6) | |
YMRS, Young Mania Rating Scale; SD, standard deviation; CGI‐BP, Clinical Global Impressions Bipolar Scale.
Missing data < 1.0%.
Missing data ≥ 1.0% and < 10.0%.
Missing data ≥ 10.0% and < 20.0%.
Missing data ≥ 20.0% and < 40.0%.
Missing data 58.4%.
A total of 3459 patients with bipolar disorder were included in this European observational study, but only patients who had a baseline score of YMRS, CGI‐BP mania and CGI‐BP overall were included in the analysis (N = 3255).
The mean age of the sample was 44.7 years (±13.5), 55.6% women (Table 1). France included the largest number of patients (23.0%). The majority of patients were outpatients (60.6%) and most had work impairment (85.0%). The mean age at onset of first symptoms was 29.8 years(±10.9). More than half of the sample (55.9%) presented only one manic or mixed episodes in the previous 12 months and 44% no depressive episodes. Few (7.0%) had at least one suicide attempt in the past 12 months. Almost half of the sample presented delusions or hallucinations (48.8%) and also substance abuse and dependence (47.6%) at inclusion in the study.
At baseline, YMRS mean score was 26.4 (±9.9); 74.1% (n = 2411) of patients had a score higher than or equal to 20 and 55.4% (n = 1804) had a score higher or equal to 25. Mean CGI‐BP mania was 4.8 (±1.0) and 61.7% (n = 2008) had a CGI‐BP mania score higher than or equal to five.
At 12 weeks (additional Figure A available online), the YMRS mean score had decreased from 26.40 (±9.92) to 6.40 (±7.51) and the CGI‐BP mania mean score had decreased from 4.77 (± 0.96) to 2.19 (±1.23), for the whole sample.
ROC analysis and severity threshold assessment
Distribution and descriptive statistics of the YMRS score according to the CGI‐BP mania cutoff of five are presented in Figure 1. The distribution was approximately normal (checked by visual inspection of plots of the data).
Figure 1.
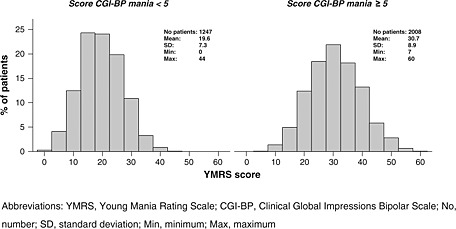
Baseline distribution of YMRS score according to CGI‐BP mania cutoff about 5.
The ROC curve (Figure 2, additional Figure B available online) done on the 1628 randomly assigned patients (training set) showed good properties, with an area under the curve of 83.3%. As shown in Table 2, a YMRS threshold of 25 corresponds to a compromise between PPV (83.2%) and NPV (65.9%), with a precision of 75.4%. On the test set (n = 1627), this threshold was associated to very close estimates of PPV and NPV (PPV = 82.5%, NPV = 63.2%, Precision = 73.9%).
Figure 2.

ROC curve of the YMRS for the screening of patients with severe mania*.
Table 2.
Extract of sensitivity, specificity, PPV, NPV for each YMRS score (training set)
| YMRS | PPV | NPV | Se | Sp | Precision | Distance from the curve |
|---|---|---|---|---|---|---|
| 50 | 1.000 | 0.393 | 0.190 | 1.000 | 0.400 | 0.980 |
| 40 | 0.994 | 0.429 | 0.156 | 0.998 | 0.483 | 0.844 |
| 30 | 0.900 | 0.554 | 0.535 | 0.907 | 0.679 | 0.475 |
| 29 | 0.874 | 0.565 | 0.574 | 0.870 | 0.689 | 0.445 |
| 28 | 0.870 | 0.591 | 0.625 | 0.853 | 0.714 | 0.403 |
| 27 | 0.863 | 0.620 | 0.676 | 0.831 | 0.736 | 0.365 |
| 26 | 0.848 | 0.642 | 0.718 | 0.798 | 0.749 | 0.347 |
| 25 | 0.832a | 0.659b | 0.750c | 0.761d | 0.754e | 0.346 |
| 24 | 0.814 | 0.674 | 0.778 | 0.720 | 0.756 | 0.357 |
| 23 | 0.789 | 0.696 | 0.818 | 0.656 | 0.755 | 0.389 |
| 22 | 0.771 | 0.725 | 0.855 | 0.600 | 0.756 | 0.425 |
| 21 | 0.758 | 0.752 | 0.883 | 0.556 | 0.756 | 0.459 |
| 20 | 0.746 | 0.776 | 0.906 | 0.515 | 0.754 | 0.494 |
| 10 | 0.631 | 0.889 | 0.993 | 0.088 | 0.641 | 0.912 |
| 0 | 0.611 | 0.000 | 1.000 | 0.000 | 0.611 | 1.000 |
YMRS, Young Mania Rating Scale; Se, sensitivity; Sp, specificity; PPV, positive predictive value; NPV, negative predictive value; CI95, 95% confidence interval.
CI95 [0.814; 0.850].
CI95 [0.636; 0.682].
CI95 [0.729; 0.771].
CI95 [0.740; 0.782].
CI95 [0.733; 0.775].
It should be noted that a YMRS score of 20 (frequent RCTs inclusion criteria), corresponds to quite good PPV (74.6%) and NPV (77.6%) according to the training set.
Regression
A linear relationship between YMRS scores and CGI‐BP mania scores was graphically observed on this sample (additional Figure C available online). The correlation at baseline was of 0.65 (n = 3255) with a 95% confidence interval of [0.63, 0.67]. On the linear regression performed on half of the randomly selected sample, the slope coefficient associated with the CGI‐BP mania scale was 6.6 with a standard error (SE) of 0.19 (YMRS score = –5.1 + 6.6 [CGI‐BP mania score]). Thus, a mean decrease of one point of CGI‐BP mania may correspond to a mean decrease of 6.6 points on the YMRS scale.
These results were confirmed with the analysis excluding the most influential subjects (YMRS score = –5.5 + 6.7 [CGI‐BP mania score, SE = 0.17]), and with the analysis on the test set (YMRS score = –6.2 + 6.8 [CGI‐BP mania score, SE = 0.19]).
Threshold sensitivity analysis (Table 1)
At baseline, 1804 patients (55.4%) had a YMRS score higher than or equal to 25 and 1451 patients (44.6%) a score lower than 25. In the “Severely ill” patients group (YMRS score ≥ 25) the mean age was 43.5 (±13.3) and 46.2 (±13.6) for “Not severely ill” patients (YMRS score < 25) (P < 0.0001). Half of the patients (51.7%) with a YMRS score greater than or equal to 25 were inpatients, while only a quarter (24.1%) of the patients with a YMRS score lower than 25 were inpatients (P < 0.0001). In addition, severely ill patients were more likely to experience psychotic symptoms at baseline (55.1%) compared to not severely ill patients (20.3%, P < 0.0001). Severely ill patients presented more substance abuse and dependence than not severely ill patients, with 27.4% for alcohol use (versus 22.5%, P = 0.002), 16.5% for cannabis use (versus 10.4%, P < 0.0001), and 9.4% for other substances (versus 6.8%, P = 0.008). Among patients treated in the last month before baseline, 24.4% of severely ill patients were non‐compliant half of the time (versus 16.5%) and 12.3% never adhered to their prescribed treatment (versus 3.8%), while 61.3% of not severely ill patients were almost always compliant (versus 41.1%, P < 0.0001).
Discussion
In the EMBLEM observational study assessing manic/mixed episode outcomes, baseline YMRS was equal to 26.4 (±9.9) and mean decrease after 12 weeks (20 points) was in the same range as those observed in RCTs assessing the efficacy of second generation antipsychotics (SGA) in acute manic/mixed episodes (Tohen et al., 1999; Keck et al., 2003; Tohen et al., 2003; Perlis et al., 2006; Keck et al., 2009; McIntyre et al., 2005; Vieta et al., 2005; Smulevich et al., 2005). CGI‐BP mania outcomes also followed the same pattern with a decrease of 2.6 points after 12 weeks. On the analysis of this database, an optimal YMRS severity threshold of 25 was calculated, using as a reference for severity classification a CGI‐BP mania ≥ 5 (i.e. at least “Markedly ill”). This threshold corresponds to a PPV of 83%, signifying that 83% of patients with a baseline YMRS score ≥ 25 are at least “Markedly ill”. Additionally, we assessed the MCSD of the YMRS, and observed that one point of CGI change corresponds to a change of 6.6 points of YMRS score.
Scales used in RCTs or observational studies may be difficult to interpret for many clinicians, who may be uncertain of the clinical meaning of scale summary scores (Lauridsen et al., 2006). The YMRS is the most widely used scale in acute mania trials. We believe that providing a severity threshold and MCSD value for this scale is important to help clinicians to interpret and to translate absolute values of YMRS, according to more clinically relevant concepts such as severity cutoff and MCSD. Other concepts have been recently advocated in the literature to help physicians better assess the clinical meaning of RCTs outcomes. The most popular ones are the Cohen's d effect size and NNT estimates (Calabrese and Kemp, 2008; Scherk et al., 2007). For example, compared to MCSD, effect size estimates provide complementary information about the magnitude of the effect, but still remain an abstract quantity that is less obvious to translate into clinical practice. For example, an effect size of 0.6 tells you about the general magnitude of the treatment effect (“moderate”), but does not contain the information of what is the magnitude of the amelioration that may be expected from a patient perspective, nor what should be expected for a patient with different severity of illness at baseline (i.e. “Markedly ill” or “Moderately ill”). This moderate 0.6 effect size might actually correspond to different variations and in some extreme cases to poor expected clinical differences for the patient. As a complement, the MCSD can readily be interpreted in clinical practice.
Our results are also potentially helpful to assess the clinical relevance of improvement in clinical trials, as well as to discuss the actual level of severity of the patients included in those studies. Indeed, in RCTs assessing atypical antipsychotics efficacy in acute manic/mixed episodes, mean baseline YMRS scores have been reported to be between 28 to 32 and CGI‐BP mania between 4.5 to 5.5 (Tohen et al., 1999; Keck et al., 2003; Tohen et al., 2003; Perlis et al., 2006). With a YMRS severity threshold of 25, it appears that most patients included in RCTs would be classified as at least markedly ill. Regarding the patients who have a YMRS score higher than or equal to 20 (which is the minimum YMRS score usually required as an inclusion criteria in addition to a categorical DSM‐IV diagnosis), more than 74.6% of them would be classified as at least markedly ill. From these results, we can conclude that patients included in those RCTs were symptomatically severe enough to provide meaningful results for populations encountered in clinical settings suffering acute manic/mixed episodes.
According to the MSCD calculated with the baseline data collected in this observational study, an extrapolation in terms of CGI‐BP mania of a mean 12‐week decrease of 15 to 29 points on YMRS score usually observed in RCTs (Tohen et al., 1999; Keck et al., 2009; McIntyre et al., 2005; Vieta et al., 2005; Smulevich et al., 2005) could correspond to a clinically meaningful mean decrease of 1.5 to 4.6 on the CGI‐BP mania scale. This approximation has to be interpreted cautiously as in this study the MCSD was estimated only according to the baseline data and not with the longitudinal data. It will have to be confirmed with a longitudinal analysis. MCSD is thus a practical concept that helps to interpret the clinical relevance of treatment effect. In the majority of studies, statistically significant differences are presented, but not the clinical significance from the patient and clinician point of view. Unfortunately, minimal statistically significant differences may be the results of a large number of subjects included, but they do not have any clinical meaning. This is a well known issue reported in oncology or cardiology studies where thousands of patients are usually included in RCTs. MCSD will help the clinician to gauge the change observed during an RCT for a particular treatment or between two treatments (Hajiro and Nishimura, 2002; Lauridsen et al., 2006; Fayers and Machin, 2000; Kraemer et al., 2003; Norman et al., 2001; Pouchot et al., 2008). This interpretation will be highly dependent on the clinical value given by the clinician to one point of CGI. This value will be a function of the pathology, functional states (acute or residual symptoms), medication assessed (monotherapy or add‐on), etc. Clearly, a clinician will expect at least a symptomatic improvement equivalent to one point of CGI for an acute state, but less than a point may be a strong individual achievement in the case of add‐on therapy in a partial responder. Moreover, the values presented are means and their individual interpretation should be cautious due to the high variability of therapeutic response observed.
Strengths of the study
To our knowledge, severity threshold and MCSD have never been formally calculated for the most frequently used symptom scales in RCTs assessing treatment efficacy in bipolar disorder (YMRS) and also schizophrenia (Positive and Negative Syndrome Scale [PANSS]).
This is also the first time that a robust methodology applied to a single study with such a large observational sample of bipolar patients was used in the field of psychiatry to assess those estimates. The EPIMAN study (Azorin et al., 2007) also provided a cutoff for the MRS, but this scale was rarely used in RCTs and no internal validation of the sample was performed. Notably, Leucht et al. (2005) thoroughly addressed a similar question, but in the context of schizophrenia in an article entitled “What the PANSS means?”. In addition to a different diagnosis and scale, they used non‐observational data (pooled analysis from seven RCTs), used a different method (equipercentile), no available sample subset to internally validate the results. This article demonstrated that the usual 20% of improvement in PANSS used as a gold standard to define response to treatment, was actually on average minimally improved according to the CGI, and that a baseline PANSS score of 60 was unlikely to include severely ill patients.
The large size of our sample increased the robustness of the results by allowing us to randomly divide our sample, allowing the use of one half to determine the estimate and the other half as a validation group. This is rarely performed, even outside of the psychiatric field, although it considerably improves the validity of the estimates calculated. We also checked that in both samples estimates were within a similar range.
Study limitations
Some limitations of our study should be taken into account when interpreting the results.
Firstly, our estimates have been calculated on data from an observational study, which are considered to be less robust than RCTs. However, observational studies usually include a broader and more representative population with less stringent inclusion criteria and may consequently better reflect the spectrum of individual clinical severity observed in the clinical settings. Indeed, important severity markers like comorbidities (addictions, etc.) are usually exclusion criteria in clinical trials and patients included in RCTs are selected to optimize the probability to detect a benefit from treatment and minimize the risks for the patients (by excluding patients with previous resistance, suicidal ideation, etc.) (Feinstein and Horwitz, 1997; Calabrese and Kemp, 2008; Kora et al., 2008). Thus, assessing clinical severity and clinically meaningful change may be best calculated on this “real life” population.
Secondly, PPV and NPV are variables which are a function of the prevalence of illness (Ancelle, 2002). A ROC analysis is usually performed on a population with only a small part of ill patients who need to be accurately screened. In our study, as in RCTs, all the population is symptomatic (manic/mixed) and the use of PPV and NPV is then justified (Azorin et al., 2007).
Thirdly, no external validation on an independent sample has been performed. External validation is still needed to confirm our threshold and this would be ideally performed on data pooled from RCTs. However, a sensitivity analysis was performed and supported the external validity of our results with some relevant baseline clinical differences between severely ill and not severely ill patients (Calabrese and Kemp, 2008; Kora et al., 2008).
Fourthly, the CGI‐BP mania was selected as the gold standard to define the level of severity of our sample and assess the YMRS cutoff. However, CGI‐BP mania may capture subjective dimensions of “global” severity that do not overlap with the YMRS, which is only focused on “symptomatic” severity and ignores important dimensions like comorbidity, functional impairment, past history, previous response to treatment, known peer support, etc., that will be taken into account by the clinician when answering the CGI‐BP mania subjective question “how severely ill is your patient at the present time?”. As a consequence, caution should be exerted as severity measured by CGI‐BP mania and YMRS are not strictly similar. The YMRS severity threshold defined here may thus be too conservative if a purely symptomatic perspective is required, as is generally the case with RCTs. Functional and social impairment and comorbidity often persist after symptomatic remission (“residual” symptoms) and further discrepancy may occur between YMRS and CGI after symptomatic remission. This discrepancy seems limited in our case as YMRS and CGI‐BP mania evolved in a similar way (additional Figure A available online). Furthermore, we used in the analysis CGI‐BP mania, which may orientate more towards “manic symptoms” compared to a more global view of the severity of the bipolar disease that would have been obtained with a CGI‐BP overall.
Fifthly, patients with mixed states were included in this sample, as they are in most RCTs, and neither CGI‐BP mania nor YMRS may capture their real level of severity represented by the associated depressive symptoms. No direct assessment of the prevalence of mixed states has been collected in the EMBLEM study, but an indirect dimensional assessment (patients with CGI‐BP mania and CGI‐BP depression scores ≥ 3) has shown that they were frequent (23.5%) in a proportion that is comparable to RCTs (Scherk et al., 2007). Thus, with a sample of pure mania, our severity threshold of the YMRS may be underestimated and YMRS alone is not enough to have a complete perspective of the severity of mixed patients. Further explorations on a pure mania group and a pure mixed group would allow differentiating more specific thresholds in those subgroups. Furthermore, clinicians should not consider YMRS as the sole instrument to assess acute severity of mixed patients.
Finally, only baseline data were used in the analysis for the calculation of MCSD, as CGI‐BP mania and YMRS score dropped abruptly at the follow‐up visit, limiting the ability to perform statistical analysis and as a consequence, the extrapolation of this MCSD to longitudinal data. However, the strong linear relationship observed ensured a good robustness of our estimate. The analysis done here was a first step to assess the linear relationship between YMRS and CGI‐BP scores and this estimate gives a rough idea of what could be the MCSD with longitudinal data. However, this analysis needs to be confirmed with longitudinal data and analysis.
In conclusion, outcomes from RCTs and observational studies are often difficult to translate into clinical concepts relevant to clinicians. Severity threshold and MCSD represent important clinically relevant constructs that may help physicians assess the illness severity of patients included in RCTs and understand the clinical relevance of the effect of treatment, in addition to other approaches such as Cohen's d effect size and the NNT or Number Needed to Harm (NNT/NNH). These tools should not, however, exempt clinicians from translating the value of a CGI improvement to individual clinical situations (for example, monotherapy for acute mania versus add‐on for residual symptoms), where the level of improvement should be gauged to the expected improvement. Furthermore, these analyses were calculated on an observational study which differs from RCTs both in design and population included and still need to be validated externally. However, it may be inferred from our results that most contemporary RCTs assessing efficacy of second generation antipsychotics included a majority of severely ill patients and showed clinically significant effect over 12 weeks.
Declaration of interest statement
This study was sponsored and funded by Eli Lilly and Company.
Stephanie Gerard, Elena Perrin, Hélène Sapin and Catherine Reed are currently working for Eli Lilly. Mauricio Tohen, Adeline Besnard and Michael Lukasiewicz are former Lilly employees; Adeline Besnard and Michael Lukasiewicz were still Lilly employees when the manuscript was drafted.
Jean‐Michel Azorin has undertaken consultancy work for Lilly, Aventis, Janssen, Lundbeck, Astra Zeneca and BMS; he has received honoraria and hospitality from Lilly, Janssen, Lundbeck, BMS, Pfizer and Novartis in relation to conference presentations.
Bruno Falissard has acted as a paid consultant and been on the speakers/advisory boards of Sanofi‐Aventis, NOVARTIS, Pierre Fabre, Servier, MSD, Otsuka, Genzyme, Lundbeck, Jansen‐Cilag, Roche, Lilly, BMS, and Genzyme.
Mauricio Tohen has received honoraria as a consultant and to be speaker or member of advisory boards from Astra Zeneca, BMS, Eli Lilly, GSK, Sepracor, Wyeth; he received grant/research support from NIMH.
Supporting information
Supporting information may be found in the online version of this article.
Supporting Information
Supporting information
Supporting Information
Acknowledgements
The authors gratefully acknowledge the study team and all the French investigators of EMBLEM. The authors also acknowledge Diego Novick for reviewing the manuscript and also Deborah Quail for her assistance with the statistical analysis of the study data and her input on this manuscript.
References
- Ancelle T. (2002) Statistique Epidémiologie, Paris, Editions Maloine. [Google Scholar]
- Azorin J.M., Kaladjian A., Akiskal H.S., Hantouche E.G., Duchêne L.C., Gury C., Lancrenon S. (2007) Validation of a severity threshold for the Mania Rating Scale: a receiver‐operating characteristic analysis. Psychopathology, 40(6), 453–460, DOI: 10.1159/000107430 [DOI] [PubMed] [Google Scholar]
- Bleeker S.E., Moll H.A., Steyerberg E.W., Donders A.R., Derksen‐Lubsen G., Grobbee D.E., Moons K.G. (2003) External validation is necessary in prediction research: a clinical example. Journal of Clinical Epidemiology, 56(9), 826–32, DOI: 10.1016/S0895-4356(03)00207-5 [DOI] [PubMed] [Google Scholar]
- Bouyer J., Hémon D., Cordier S., Derriennic F., Stücker I., Stengel B., Clavel J. (1993) Epidémiologie: principes et méthodes quantitatives, Paris, Editions Inserm. [Google Scholar]
- Calabrese J.R., Kemp D.E. (2008) Bipolar drug development: are we getting closer to the real world?, The American Journal of Psychiatry, 165(10), 1234–1236, DOI: 10.1176/appi.ajp.2008.08060967 [DOI] [PubMed] [Google Scholar]
- Farrar J.T., Berlin J.A., Strom B.L. (2003) Clinically important changes in acute pain outcome measures: a validation study. Journal of Pain and Symptom Management, 25(5), 406–411, DOI: 10.1016/S0885-3924(03)00162-3 [DOI] [PubMed] [Google Scholar]
- Fayers P.M., Machin D.M. (2000) Quality of life: assessment, analysis & interpretation, Chichester, John Wiley & Sons. [Google Scholar]
- Feinstein A.R., Horwitz R.I. (1997) Problems in the “evidence” of “evidence‐based medicine”. American Journal of Medicine, 103(6), 529–535, DOI: 10.1016/S0002-9343(97)00244-1 [DOI] [PubMed] [Google Scholar]
- Frye M.A. (2008) Diagnostic dilemmas and clinical correlates of mixed states in bipolar disorder. The Journal of Clinical Psychiatry, 69(5), e13, DOI: 10.4088/JCP.0508e13 [DOI] [PubMed] [Google Scholar]
- Ghaemi S.N. (2008) All mixed up: on the absence of diagnostic guidelines for mixed states in the ISBD Diagnostic Guidelines Task Force Report. Bipolar Disorder, 10(1 Pt 2), 129–130. [DOI] [PubMed] [Google Scholar]
- Goetz I., Tohen M., Reed C., Lorenzo M., Vieta E., EMBLEM Advisory Board . (2007) Functional impairment in patients with mania: baseline results of the EMBLEM study. Bipolar Disorder, 9(1–2), 45–52, DOI: 10.1111/j.1399-5618.2007.00325 [DOI] [PubMed] [Google Scholar]
- González‐Pinto A., Ballesteros J., Aldama A., Pérez de Heredia J.L., Gutierrez M., Mosquera F., González‐Pinto A. (2003) Principal components of mania. Journal of Affective Disorders, 76(1–3), 95–102, DOI: 10.1016/S0165-0327(02)00070-8 [DOI] [PubMed] [Google Scholar]
- Hajiro T., Nishimura K. (2002) Minimal clinically significant difference in health status: the thorny path of health status measures? European Respiratory Journal, 19(3), 390–391, DOI: 10.1183/09031936.02.00283402 [DOI] [PubMed] [Google Scholar]
- Haro J.M., van Os J., Vieta E., Reed C., Lorenzo M., Goetz I., EMBLEM Advisory Board . (2006) Evidence for three distinct classes of ‘typical’, ‘psychotic’ and ‘dual’ mania: results from the EMBLEM study. Acta Psychiatrica Scandinavica, 113(2), 112–120, DOI: 10.1111/j.1600-0447.2005.00692.x [DOI] [PubMed] [Google Scholar]
- Keck P.E. Jr, Marcus R., Tourkodimitris S., Ali M., Liebeskind A., Saha A., Ingenito G., Aripiprazole Study Group . (2003) A placebo‐controlled, double‐blind study of the efficacy and safety of aripiprazole in patients with acute bipolar mania. A placebo‐controlled, double‐blind study of the efficacy and safety of aripiprazole in patients with acute bipolar mania. The American Journal of Psychiatry, 160(9), 1651–1658, DOI: 10.1176/appi.ajp.160.9.1651 [DOI] [PubMed] [Google Scholar]
- Keck P.E., Orsulak P.J., Cutler A.J., Sanchez R., Torbeyns A., Marcus R.N., McQuade R.D., Carson W.H., CN138‐135 Study Group . (2009) Aripiprazole monotherapy in the treatment of acute bipolar I mania: a randomized, double‐blind, placebo‐ and lithium‐controlled study. Journal of Affective Disorders, 112(1–3), 36–49, DOI: 10.1016/j.jad.2008.05.014 [DOI] [PubMed] [Google Scholar]
- Kora K., Saylan M., Akkaya C., Karamustafalioglu N., Tomruk N., Yasan A., Oral T. (2008) Predictive factors for time to remission and recurrence in patients treated for acute mania: Health Outcomes of Manic Episodes (HOME) Study. Primary Care Companion to the Journal of Clinical Psychiatry, 10(2), 114–119, DOI: 10.4088/PCC.v10n0205 [DOI] [PMC free article] [PubMed] [Google Scholar]
- Kraemer H.C., Morgan G.A., Leech N.L., Gliner J.A., Vaske J.J., Harmon R.J. (2003) Measures of clinical significance. Journal of the American Academy of Child and Adolescent Psychiatry, 42(12), 1524–1529, DOI: 10.1097/00004583-200312000-00022 [DOI] [PubMed] [Google Scholar]
- Lauridsen H.H., Hartvigsen J., Manniche C., Korsholm L., Grunnet‐Nilsson N. (2006) Responsiveness and minimal clinically important difference for pain and disability instruments in low back pain patients. BMC Musculoskeletal Disorders, 7, 82, DOI: 10.1186/1471-2474-7-82 [DOI] [PMC free article] [PubMed] [Google Scholar]
- Leucht S., Kane J.M., Kissling W., Hamann J., Etschel E., Engel R.R. (2005) What does the PANSS mean? Schizophrenia Research, 79(2–3), 231–238, DOI: 10.1016/j.schres.2005.04.008 [DOI] [PubMed] [Google Scholar]
- Make B. (2007) How can we assess outcomes of clinical trials: the MCID approach. COPD, 4(3), 191–194. [DOI] [PubMed] [Google Scholar]
- McIntyre R.S., Brecher M., Paulsson B., Huizar K., Mullen J. (2005) Quetiapine or haloperidol as monotherapy for bipolar mania – a 12‐week, double‐blind, randomised, parallel‐group, placebo‐controlled trial. European Neuropsychopharmacology, 15(5), 573‐585, DOI: 10.1016/j.euroneuro.2005.02.006 [DOI] [PubMed] [Google Scholar]
- Merikangas K.R., Akiskal H.S., Angst J., Greenberg P.E., Hirschfeld R.M., Petukhova M., Kessler R.C. (2007) Lifetime and 12‐month prevalence of bipolar spectrum disorder in the National Comorbidity Survey replication. Archives of General Psychiatry, 64(5), 543–552, DOI: 10.1001/archpsyc.64.5.543 [DOI] [PMC free article] [PubMed] [Google Scholar]
- Metz C.E. (1978) Basic principles of ROC analysis. Seminars in Nuclear Medicine, 8(4), 283–298, DOI: 10.1016/S0001-2998(78)80014-2 [DOI] [PubMed] [Google Scholar]
- Montoya A., Pérez Sánchez N., Toledo J., Gilaberte I., González‐Pinto A., Haro J.M., Vieta E., Tohen M. (2007) Patterns of drug treatment for manic episode in the clinical practice. Outcomes of the Spanish sample in the EMBLEM Study. Actas Españolas de Psiquiatría, 35(5), 315–322 [PubMed] [Google Scholar]
- Norman G.R., Sridhar F.G., Guyatt G.H., Walter S.D. (2001) Relation of distribution‐ and anchor‐based approaches in interpretation of changes in health‐related quality of life. Medical Care, 39(10), 1039–1047, DOI: 10.1097/00005650-200110000-00002 [DOI] [PubMed] [Google Scholar]
- Perlis R.H., Baker R.W., Zarate C.A. Jr, Brown E.B., Schuh L.M., Jamal H.H., Tohen M. (2006) Olanzapine versus risperidone in the treatment of manic or mixed States in bipolar I disorder: a randomized, double‐blind trial. The Journal of Clinical Psychiatry, 67(11), 1747–1753, DOI: 10.4088/JCP.v67n1112 [DOI] [PubMed] [Google Scholar]
- Pouchot J., Kherani R.B., Brant R., Lacaille D., Lehman A.J., Ensworth S., Kopec J., Esdaile J.M., Liang M.H. (2008) Determination of the minimal clinically important difference for seven fatigue measures in rheumatoid arthritis. Journal of Clinical Epidemiology, 61(7), 705–713, DOI: 10.1016/j.jclinepi.2007.08.016 [DOI] [PMC free article] [PubMed] [Google Scholar]
- Scherk H., Pajonk F.G., Leucht S. (2007) Second‐generation antipsychotic agents in the treatment of acute mania: a systematic review and meta‐analysis of randomized controlled trials. Archives of General Psychiatry, 64(4), 442–455, DOI: 10.1001/archpsyc.64.4.442 [DOI] [PubMed] [Google Scholar]
- Smulevich A.B., Khanna S., Eerdekens M., Karcher K., Kramer M., Grossman F. (2005) Acute and continuation risperidone monotherapy in bipolar mania: a 3‐week placebo‐controlled trial followed by a 9‐week double‐blind trial of risperidone and haloperidol. European Neuropsychopharmacology, 15(1), 75–84, DOI: 10.1016/j.euroneuro.2004.06.003 [DOI] [PubMed] [Google Scholar]
- Spearing M.K., Post R.M., Leverich G.S., Brandt D., Nolen W. (1997) Modification of the Clinical Global Impressions (CGI) scale for use in bipolar illness (BP): the CGI‐BP. Psychiatry Research, 73(3), 159–171, DOI: 10.1016/S0165-1781(97)00123-6 [DOI] [PubMed] [Google Scholar]
- Storosum J.G., Fouwels A., Gispen‐de Wied C.C., Wohlfarth T., van Zwieten B.J., van den Brink W. (2004) How real are patients in placebo‐controlled studies of acute manic episode? European Neuropsychopharmacology, 14(4), 319–323, DOI: 10.1016/j.euroneuro.2003.10.003 [DOI] [PubMed] [Google Scholar]
- Tohen M., Goldberg J.F., Gonzalez‐Pinto Arrillaga A.M., Azorin J.M., Vieta E., Hardy‐Bayle M.C., Lawson W.B., Emsley R.A., Zhang F., Baker R.W., Risser R.C., Namjoshi M.A., Evans A.R., Breier A. (2003) A 12‐week, double‐blind comparison of olanzapine vs haloperidol in the treatment of acute mania. Archives of General Psychiatry, 60(12), 1218–1226, DOI: 10.1001/archpsyc.60.12.1218 [DOI] [PubMed] [Google Scholar]
- Tohen M., Jacobs T.G., Grundy S.L., McElroy S.L., Banov M.C., Janicak P.G., Sanger T., Risser R., Zhang F., Toma V., Francis J., Tollefson G.D., Breier A. (2000) Efficacy of olanzapine in acute bipolar mania: a double‐blind, placebo‐controlled study. The Olanzipine HGGW Study Group. Archives of General Psychiatry, 57(9), 841–849, DOI: 10.1001/archpsyc.57.9.841 [DOI] [PubMed] [Google Scholar]
- Tohen M., Sanger T.M., McElroy S.L., Tollefson G.D., Chengappa K.N., Daniel D.G., Petty F., Centorrino F., Wang R., Grundy S.L., Greaney M.G., Jacobs T.G., David S.R., Toma V. (1999) Olanzapine versus placebo in the treatment of acute mania. Olanzapine HGEH Study Group. The American Journal of Psychiatry, 156(5), 702–709. [DOI] [PubMed] [Google Scholar]
- Vieta E. (2010) Guide to Assessment Scales in Bipolar Disorder, 2nd edn, London, Springer Healthcare. [Google Scholar]
- Vieta E., Bourin M., Sanchez R., Marcus R., Stock E., McQuade R., Carson W., Abou‐Gharbia N., Swanink R., Iwamoto T., Aripiprazole Study Group . (2005) Effectiveness of aripiprazole v. haloperidol in acute bipolar mania: double‐blind, randomised, comparative 12‐week trial. The British Journal of Psychiatry, 187, 235–242, DOI: 10.1192/bjp.187.3.235 [DOI] [PubMed] [Google Scholar]
- Wolfe F., Michaud K., Strand V. (2005) Expanding the definition of clinical differences: from minimally clinically important differences to really important differences. Analyses in 8931 patients with rheumatoid arthritis. Journal of Rheumatology, 32(4), 583–589. [PubMed] [Google Scholar]
- Young R.C., Biggs J.T., Zeigler V.E., Meyer D.A. (1978) A rating scale for mania: reliability, validity and sensitivity. The British Journal of Psychiatry, 133, 429–435, DOI: 10.1192/bjp.133.5.429 [DOI] [PubMed] [Google Scholar]
Associated Data
This section collects any data citations, data availability statements, or supplementary materials included in this article.
Supplementary Materials
Supporting information may be found in the online version of this article.
Supporting Information
Supporting information
Supporting Information