

Abstract
The present study examined several factor models of the Eating Disorder Examination Questionnaire (EDE‐Q), and in particular, whether a nested general factor (‘g’) was present, hence supporting a common pathology factor. A total of 1094 women were randomly selected by Statistics Norway and mailed a questionnaire packet. The sample was randomly split, using the first half for exploratory analyses and the second for confirmatory validation purposes. A four‐factor solution received the best support, but the structure deviated from the original model of Fairburn. The internal consistency was high for the first three factors (.93, .82 and .86) and satisfactory for the fourth (.78). The additional specification of a general (g) factor improved model fit significantly, implying that the EDE‐Q scores are indicators of both a general core and four primary symptom patterns. Furthermore, the g was more strongly related to predictors like age and body mass index (BMI) than the four primary factors in a full structural equation model. The validity of interpreting the global EDE‐Q score as indicative of g was supported. A brief Shape and Weight Concern subscale of 11 items was strongly related to the g‐factor, and may provide an abbreviated measure of overall eating disorder pathology. Copyright © 2013 John Wiley & Sons, Ltd.
Keywords: eating disorders, factor analysis, ‘g’ and specific latent factors, Eating Disorder Examination Questionnaire
Introduction
The Eating Disorder Examination Questionnaire (EDE‐Q) is one of the most favoured self‐report measures to assess eating disorder (ED) pathology worldwide. It is used to assess specific attitudinal aspects of ED psychopathology, and in particular, the undue importance put on weight and shape in determining self‐worth (Fairburn et al., 2003). The EDE‐Q is a short version developed from the full‐length semi‐structured EDE interview. Numerous studies have provided support for the reliability and validity of the EDE‐Q (Mond et al., 2004). Originally developed for anorexia nervosa (AN) and bulimia nervosa (BN) patients, the instrument is increasingly applied for clinical and research purposes in Western and non‐Western populations. It has shown good quality as a screening tool for BN in primary care patients (Mond et al., 2008), in substance abusers (Black and Wilson, 1996), binge eating in overweight youngsters (Goossens and Braet, 2010), obese children and adolescents (Decaluwe and Braet, 2004), bulimic and binge eating symptoms among diabetes patients (Smith et al., 2008), and pathological eating behaviour among adolescents in schools (Engelsen and Laberg, 2001).
Items were initially derived on clinical grounds to generate the four subscales: weight concern (WC), shape concern (SC), eating concern (EC) and dietary restraint (DR) (Cooper et al., 1989). Three studies have empirically investigated the four‐factor structure on EDE‐Q scores collected from 203 patients with BN and subthreshold BN (Peterson et al., 2007), 337 obese bariatric surgery patients (Hrabosky et al., 2008), and 523 Fijian adolescent girls (Becker et al., 2010). In line with psychometric research on the EDE interview (Byrne et al., 2010; Grilo et al., 2010; Wade et al., 2008), all have failed to replicate the original factor structure. Recommendations for the interpretation and usage of the EDE‐Q have therefore diverged. For example, Hrabosky et al. (2008) found support for an abbreviated 12‐item four‐factor scale, whereas Becker et al. (2010) argued for the interpretation of the global EDE‐Q score as a unitary construct. A recent confirmatory factor analysis (CFA) by Allen et al. (2011) compared five theoretically‐based models on a sample of 228 ED outpatients and 211 female university students, but none fit the data well. A brief one‐factor model consisting of eight SC and WC items demonstrated best fit in both samples.
The purpose of the present study was to examine the extent to which data collected from a large national population‐based community sample of women in Norway would replicate the model as originally proposed by Fairburn, or alternatively, whether a regrouping of the EDE‐Q item scores is necessary as previously reported. A second purpose of the study was to examine the extent to which a general factor (‘g’), in addition to the four primary factors, underpins the EDE‐Q item scores and should be considered in the interpretation of the results (see Figure 1). This is the first study to investigate the extent to which the EDE‐Q item scores are related to a common core of pathological attitudinal features of eating problems represented by the g‐factor. A g‐factor is important to consider if the majority of items load higher on the g than any of the primary factors (WC, SC, EC and DR subscales). This modelling strategy may be viewed in connection to a transdiagnostic perspective in the assessment and treatment of ED pathology (Fairburn et al., 2003), which considers eating pathology to be comprised of both core features shared across all types of EDs (e.g. over‐evaluation of shape and weight and their control, etc.), and distinctive features specific to a particular ED diagnosis. The g and primary factors tested in the current study represent a conceptually similar, yet a necessarily more limited approach, as we specifically focused the investigation on the EDE‐Q items and eating pathology in the general population. The validity of estimating a g‐factor was further examined against age and body mass index (BMI).
Figure 1.
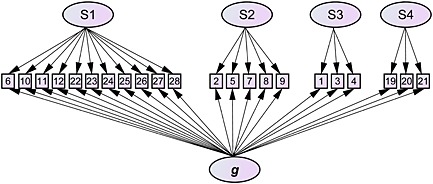
Graphical illustration of the nested factor model.
Hypothesized relations
Age and BMI were used as predictors of ‘g’ and the primary factors, respectively. In a standard factor model all four factor scores were expected to correlate significantly negatively and positively with age and BMI, respectively. This prediction was based on a recent study (Ro et al., 2012) showing that psychosocial impairment caused by ED problems were less pronounced among elderly women, and more present in women with higher BMIs. It was also hypothesized that these demographic variables would demonstrate a stronger association with a common g‐factor compared with any of the primary factors, like WC or SC, which may occur at varying degrees throughout adulthood and across the BMI spectrum (von Soest and Wichstrøm, 2009).
Method
Participants and study design
A representative community sample of 3000 Norwegian women aged 16–50 years [M = 36.3, standard deviation (SD) = 9.5] was randomly selected by Statistics Norway. Participants received the questionnaires by regular mail. Electronic responding was an option. A reminder was sent after four weeks. Participation was voluntarily and anonymous. A lottery (30 gift cards worth $80 each) was used as an incentive.
Completed questionnaires were received from 1094 individuals, of whom 1005 (91.9%) had responded by post and 89 (8.1%) online. The overall response rate was 36.5%. After excluding 18 participants owing to a large amount of missing data (> 20%), the final sample comprised 1076 women aged 16–50 years (M = 36.2, SD = 9.5). Non‐responders were on average two years younger than women who participated in the study (p < 0.001, z = 5.8). The response rates differed significantly between age groups, with increasing rates of participation among older individuals (χ2 = 77.6, p < 0.001) (17–20 years = 26.7%; 21–30 years = 27.5%; 31–40 years = 32.2%; 41–50 years = 45.8%).
Approximately 29% of the women were unmarried and 71% were cohabitating or married. Of the total sample, 72.0% were working, 13.8% were studying, 9.5% had sick leave, 2.5% were working at home and 1.7% were unemployed. Self‐reported average BMI (BMI in kg/m2) was 24.6 (SD = 4.8, range 13.5–55.1). The number of participants with a BMI < 17.5 was 0.7% (eight cases).
Measures
The EDE‐Q (6.0) (Fairburn, 2009; Fairburn and Beglin, 1994) is a 28‐item self‐report measure of ED psychopathology derived from the full‐length, semi‐structured EDE interview (Fairburn and Cooper, 1993). It measures core ED behaviours over the preceding 28 days, such as number of objective binge episodes and core attitudinal aspects of an ED, i.e. the undue importance of weight and shape in determining self‐worth. As in the EDE interview, the EDE‐Q comprises four subscales: DR, WC, SC, and EC. The 22 items for the subscales used in the present study are rated on a seven‐point forced choice Likert scale with higher scores representing greater severity of psychopathology. Subscale scores were calculated as the mean of the subscale items, while the global score was calculated as the mean of the subscale scores (Fairburn, 2009). Frequencies of key behaviours were assessed but not included in the factor analyses as the attitudinal items which comprise the subscales were of primary interest. At the end of the questionnaire, participants reported their weight and height. The reliability (internal consistency) of the global score of the Norwegian version has been previously reported as very high (α = 0.94), and good for the four subscales scores (α = 0.75, 0.78, 0.90 and 0.81) (Ro et al., 2010). A psychometric review indicates good criterion‐oriented validity (ability to discriminate between diagnostic groups) (Berg et al., 2012), and adequate convergent validity as shown by correlation coefficients between the EDE‐Q and the EDE subscales ranging from 0.68 to 0.76 in a meta‐analysis (Berg et al., 2011). The construct validity of the EDE‐Q is, however, still unsettled due to the problems with replicating the factor structure.
Ethics
The current study was sent to the Regional Committee for Medical and Health Research Ethics in northern Norway and qualified for an exemption due to the anonymous nature of the data.
Statistical analyses
All analyses were performed using the SPSS v19. Internal consistency of the subscales was reported as Cronbach's alpha. In order to cross‐validate the factor structure of the EDE‐Q, the sample was randomly split in two equally sized halves using the first half for exploratory factor analyses (EFAs) and the second half for CFAs. Spearman rank‐order correlations were used as input to the EFA to reduce estimation biases due to skewed score distributions. Common factors were extracted using the principal axis factoring method. Factors having an eigenvalue > 1 were retained (Kaiser's criterion). But as this criterion may be too lenient and extract factors related to sampling bias, a parallel analysis criteria was additionally consulted and calculated using SPSS syntax (O'Connor, 2000). A promax rotation was applied due to substantial correlations between the extracted factors.
CFAs were conducted using LISREL 8.80. As several item scores had heavily skewed distributions, which is normal for data on infrequent pathological conditions in non‐clinical samples, rescaled Satorra–Bentler chi‐square statistics was also computed to adjust the standard errors (Chou et al., 1991). Model fit was additionally evaluated according to the root mean square error of approximation (RMSEA; < 0.06) and the non‐normed fit index (NNFI; > 0.95) (Marsh et al., 2004). The Akaike's and Bayesian Information Criteria (AIC and BIC) was used to compare the non‐nested factor models. The BIC implies a larger penalty for more complex models than the AIC.
Results
Exploratory factor analysis (EFA)
Four factors had an eigenvalue > 1 (Kaiser's criterion) accounting for 68.1% of the total variance, and the factor loadings are shown in Table 1. The factor solution did not follow Fairburn's original factor structure. Factor 1 was composed of a mix of 11 items from the original SC and WS subscales, minus the Preoccupation with Shape or Weight item. The second factor consisted of a mix of five items from the DR and EC subscales, as well as the WC/SC item. The third factor consisted of three items from the DR subscale, and the fourth factor of threre items from the EC scale. An alternative three‐factor EFA model was also retained following a parallel analysis.
Table 1.
Factor loadings of the EDE‐Q items based on an exploratory factor analysis (n 1 = 538)
| Extracted common factors | |||||
|---|---|---|---|---|---|
| Items | Subscale | S1 | S2 | S3 | S4 |
| Avoidance of exposure | SC | 1.00 | |||
| Dissatisfaction with shape | SC | 1.00 | |||
| Discomfort seeing body | SC | 0.97 | |||
| Dissatisfaction with weight | WC | 0.93 | |||
| Feelings of fatness | SC | 0.76 | |||
| Desire to lose weight | WC | 0.76 | |||
| Importance of weight | WC | 0.53 | |||
| Importance of shape | SC | 0.52 | |||
| Flat stomach | SC | 0.39 | |||
| Fear of weight gain | SC | 0.37 | |||
| Reaction to prescribed weighing | WC | 0.35 | |||
| Preoccupation with shape or weight | WC/SC | 0.85 | |||
| Preoccupation with food/eating/calories | EC | 0.73 | |||
| Avoidance of eating | DR | 0.66 | |||
| Empty stomach | DR | 0.61 | |||
| Fear of losing control over eating | EC | 0.46 | 0.39 | ||
| Restraint over eating | DR | 0.85 | |||
| Food avoidance | DR | 0.84 | |||
| Dietary rules | DR | 0.78 | |||
| Eating in secret | EC | 0.91 | |||
| Avoids social eating | EC | 0.87 | |||
| Guilt about eating | EC | 0.63 | |||
| Eigenvalues (unrotated) | 10.37 | 1.96 | 1.45 | 1.20 | |
| Cronbach's alpha | 0.93 | 0.82 | 0.86 | 0.78 | |
Note: Total variance explained = 65.7%. Factor loadings < 0.30 are suppressed. SC = Shape Concern, WC = Weight Concern, EC = Eating Concern, DR = Dietary Restraint.
Confirmatory factor analysis (CFA) in the cross‐validation sample
All models were contrasted to the null‐model (M0), which fixed all relations to zero. The competing models were the simplest model (M1) specifying one general factor, the original factor model as published by Fairburn (M2), the EFA three‐factor model (M3), the EFA four‐factor model (M4), and finally, a nested factor model (M5) being similar to M4, except adding a general latent factor accounting for the variance in all items thus representing a ‘g’ factor. Adding a g factor makes modelling of factor covariances unnecessary, and these were hence removed.
The model based on Kaiser's criterion (M4) was clearly better in terms of all model fit indices than any of the preceding competing models (M1, M2 and M3). See Table 2 for an overview of model fit comparisons.
Table 2.
Confirmatory factor analyses comparing model fit of the different factor models in the holdout sample (n 2 = 538)
| Models | χ 2 | SB χ 2 | df | AIC | BIC | RMSEA | NNFI |
|---|---|---|---|---|---|---|---|
| M0 | 53284 | 45868 | 231 | 45912 | 45928 | 0.607 | 0.140 |
| M1 | 5441 | 1359 | 209 | 1447 | 1479 | 0.101 | 0.976 |
| M2 | 4382 | 1075 | 202 | 1177 | 1214 | 0.090 | 0.981 |
| M3 | 4154 | 987 | 206 | 1081 | 1115 | 0.084 | 0.984 |
| M4 | 3293 | 715 | 203 | 815 | 852 | 0.069 | 0.989 |
| M5 | 2792 | 563 | 187 | 696 | 744 | 0.061 | 0.991 |
Note: M0 = null‐model, M1 = one general factor, M2 = original four factors by Fairburn, M3 = EFA model based on the parallel analysis criterion, M4 = EFA model based on Kaiser's criterion, M5 = same as M4, but included a general (g) factor. χ 2 = Chi‐square, SB χ 2 = Satorra–Bentler chi‐square, df = degrees of freedom, AIC/BIC = Akaike's/Bayesian Information Criteria, RMSEA = root mean square error of approximation, NNFI = non‐normed fit index.
As the correlation coefficients between the four latent factors in M4 were substantial, ranging from 0.36 to 0.65, the existence of a ‘g’ factor accounting for these correlations was likely to presume. Hence, a nested factor specified to load on all items was added (M5, see Figure 1) and found to outperform the conventional correlated factor model in M4. The chi‐square difference test was significant (Δχ216 = 501, p < 0.001; ΔSB χ216 = 1058, p < 0.001), and the RMSEA dropped down from 0.069 to 0.061. This supported that the EDE‐Q symptom indicators are influenced by a ‘general’ eating problem factor (g), in addition to the primary latent factors.
By squaring the factor loadings and dividing the sums with the number of items belonging to each factor, percentage of variance explained may be connected with g and primary factors (Table 3). Reading the R 2 values made it clear that the first factor comprising shape and weight concern items were strongly explained by g, while the items belonging to the remaining three factors were more influenced by the primary factors in addition to g. An additional correlation analysis confirmed this pattern as the S1 subscale and the EDE global score overlapped strongly with g, while the other correlations were weaker (Table 4). As most the items loaded significantly on g, these results argue for creating an EDE‐Q global score indicative of overall eating problems. The 11 shape and weight concern items related to the first factor may alternatively be used as a similar indicator if a short version is preferred due to their strong relation with g, which the correlation analysis also indicated.
Table 3.
Factor loadings on the primary and general latent factors in the holdout sample using a confirmatory factor analysis (n 2 = 538)
| Items | Subscale | S1 | S2 | S3 | S4 | g | h 2 |
|---|---|---|---|---|---|---|---|
| Avoidance of exposure | SC | 0.34 | 0.89 | 0.91 | |||
| Dissatisfaction with shape | SC | 0.20 | 0.92 | 0.89 | |||
| Discomfort seeing body | SC | 0.32 | 0.90 | 0.91 | |||
| Dissatisfaction with weight | WC | 0.09 | 0.93 | 0.87 | |||
| Feelings of fatness | SC | –0.06 | 0.92 | 0.85 | |||
| Desire to lose weight | WC | –0.27 | 0.96 | 0.99 | |||
| Importance of weight | WC | 0.16 | 0.85 | 0.75 | |||
| Importance of shape | SC | 0.23 | 0.82 | 0.73 | |||
| Flat stomach | SC | –0.08 | 0.61 | 0.38 | |||
| Fear of weight gain | SC | –0.04 | 0.85 | 0.72 | |||
| Reaction to prescribed weighing | WC | 0.20 | 0.58 | 0.38 | |||
| R 2 | 0.04 | 0.72 | 0.76 | ||||
| Preoccupation with shape or weight | WCSC | 0.50 | 0.83 | 0.94 | |||
| Preoccupation with food/eating/calories | EC | 0.62 | 0.77 | 0.98 | |||
| Avoidance of eating | DR | 0.42 | 0.54 | 0.47 | |||
| Empty stomach | DR | 0.25 | 0.71 | 0.57 | |||
| Fear of losing control over eating | EC | 0.29 | 0.78 | 0.69 | |||
| R 2 | 0.19 | 0.54 | 0.73 | ||||
| Restraint over eating | DR | 0.49 | 0.74 | 0.79 | |||
| Food avoidance | DR | 0.63 | 0.65 | 0.82 | |||
| Dietary rules | DR | 0.57 | 0.63 | 0.72 | |||
| R2 | 0.32 | 0.46 | 0.78 | ||||
| Eating in secret | EC | 0.53 | 0.72 | 0.80 | |||
| Avoids social eating | EC | 0.54 | 0.77 | 0.88 | |||
| Guilt about eating | EC | 0.37 | 0.79 | 0.76 | |||
| R2 | 0.24 | 0.58 | 0.82 |
Note: Coefficients in column 1–4 and g represent orthogonal factor loadings. R2 = explained variance (%), h 2 = variance explained in a single item by the latent factors combined.
Table 4.
Bivariate Correlations Between the EDE‐Q Subscales/Global Score and the g Factor Score
| EDE‐Q scores | g | R 2 |
|---|---|---|
| S1 | .96 | .92 |
| S2 | .77 | .59 |
| S3 | .66 | .44 |
| S4 | .72 | .52 |
| Global score | .95 | .90 |
Notes. The subscales scores (S1‐S4) are summed as in Table 1.
Item level analysis and EDE‐Q score reliability
The internal consistency in terms of Cronbach's alpha (see Table 1) was good to very good for all subscales. Estimates of communality (h 2) are found in Table 3 indicating the proportion of variance in a single item score being explained by g and primary factors combined. It is also therefore a reliability estimator of a single item score. As the h 2 was quite high for all items (lowest being 0.38 which represents a factor loading of 0.61), the internal consistency is good.
Validity analyses of the g factor
The g‐factor was validated against two criterion‐related variables: age and body mass index (BMI). The two variables were specified as predictors of the four subscale scores, and then as predictors of the four primary factors in combination with g in a full structural equation model. Symptoms of eating problems declined with age (Table 5) as age was inversely related with the EDE‐Q subscale scores. BMI was positively related, i.e. that increasing BMI was associated with greater ED symptoms. The pattern of regression coefficients changed considerably when including a nested g‐factor. The primary factors lost most, but not all of their explanatory power. This was most evident for BMI as a predictor. Three coefficients for the primary factors changed their direction, suggesting an opposite effect after adding g to the equation. An example is the factor S2 (combination of EC and DR items), which was positively related with BMI, but turned negative after adding g.
Table 5.
Linear relationships between age, BMI, and the EDE‐Q primary and g factor scores (n 2 = 538) in a full structural equation analysis
| Standard model | Nested g‐factor model | |||
|---|---|---|---|---|
| Predictors | Age | BMI | Age | BMI |
| S1 | –0.23*** | 0.56*** | –0.13** | –0.09 |
| S2 | –0.25*** | 0.37*** | –0.10* | –0.23*** |
| S3 | –0.08* | 0.40*** | 0.16** | –0.12* |
| S4 | –0.16*** | 0.45*** | 0.04 | –0.06 |
| g | –0.21*** | 0.56*** | ||
p < 0.05,
p < 0.01,
p < 0.001.
Coefficients represent standardized linear regression estimates in a full SEM analysis. Standard model: S1‐S4 represent subscale scores summed as in Table 1. Nested factor model: S1‐S4 represent primary factor scores.
Discussion
The factor structure as originally published by Fairburn (Fairburn and Beglin, 1994) was not replicated in the present study, as numerous others have found (Allen et al., 2011; Becker et al., 2010; Hrabosky et al., 2008; Peterson et al., 2007). The first factor we obtained represented a mix of all the SC and WC items, except the preoccupation with weight/shape item. Contrary to initial arguments for a conceptual distinction between SC and WC (Cooper et al., 1989), our findings confirm prior studies demonstrating that shape and weight items load together. Factors three and four represented rather ‘pure’ indicators of DR (food avoidance, restraint over eating, dietary rules) and EC (guilt about eating, eating in secret, social eating), respectively. The exception was the second factor, which represented a mixture of five items from the EC and DR subscales, in addition to the preoccupation with weight/shape item. The CFA based on a second validation sample also provided the best support of this four‐factor model.
Interpretation and implications of a ‘g’ factor in the assessment of EDs
The major finding from the CFA was that a general factor (‘g’) underpinned all EDE‐Q item scores, in addition to the standard four primary factors. The g‐factor model extends existing factor analytic research conducted with the EDE, and its self‐report version (Allen et al., 2011; Byrne et al., 2010). The modelling strategy represents a nested factor analytic approach as the g factor model is equivalent to a primary four‐factor model if all the fifth g factor loadings had been constrained to zero. The additional specification of g has important implications for the interpretation of the EDE‐Q global and subscale scores. As most EDE‐Q item scores loaded more strongly on g rather than the primary factors, the global EDE‐Q score is a reasonable indicator of g, or overall eating pathology. The findings supported prior studies arguing for the use of global EDE‐Q score as a unitary construct (Becker et al., 2010) suitable to track progress and outcome in clinical trials (Fairburn et al., 2009). The four primary factors may however take on a slightly different interpretation when modelled together with g, which was evident as the direction of some of the coefficients changed after adding g. The exact meaning of the primary factors is difficult to determine based upon the current study due to a small number of criterion related variables, and should be addressed in future studies.
What is g then, and how to interpret its meaning in assessment? Our findings imply that a high score on ‘g’ is a potentially better measure of true eating problems than any of the primary subscales and may also represent a stronger risk factor for developing a future ED. As the g‐factor explained most of the variance in the EDE‐Q items, it may represent a ‘common core’ of psychopathological features underpinning an ED, similar to a transdiagnostic conceptualization described by Fairburn et al. (2003). As our study was limited to measurement by the EDE‐Q and a general population sample, however, results are necessarily limited in generalizability and patient samples are warranted to better understand the potential clinical implications of g.
Although the g factor and the EDE‐Q global score are more overlapping than distinct, estimation of a g factor score may be valuable in for example psychotherapy research. In the search for factors influencing outcome or relapse following therapy, the g factor represents a more direct and reliable test of treatment relevant predictors. Since the global score is a compound of three latent variance components; the g, primary factors and measurement errors, it implies less conceptual clarity and statistical power in such research designs compared with a g factor. This modelling strategy may therefore represent a powerful approach to clinical research in general.
A short version of the EDE‐Q
The first primary latent factor (SC and WC items, except for the preoccupation with shape or weight item) was strongly related to the g factor, hence these 11 items may represent an acceptable short‐version substitute for measuring general ED pathology. This fits with prior research recommending briefer versions of the EDE‐Q based upon the SC and WC items (Allen et al., 2011; Wade et al., 2008).
Limitations and strengths of the study
Limitations of the present investigation deserve acknowledgement. Due to the limited scope of the 22 items and because no ED patients participated, the present study cannot ascertain the extent to which items loading highly on the g‐factor represent a ‘common core’ of pathology within a clinical context. This will, however, be addressed in a forthcoming study from our research group. Still, this may not impose notable constraints on the generalizability of the results, as shown by a study by Allen et al. (2011) which compared model fit on scores from ED and normal samples and found consistently worse fit in the patient sample. A substantial improvement in model fit is thus not expected in clinical samples, but the prediction of correct ED diagnoses would be more valid. The extent to which a brief version of the EDE‐Q comprised exclusively of shape and weight items can identify ‘non‐fat phobic anorexia’ (Becker et al., 2009) reported in young, non‐Western, or inpatient settings, requires further investigation.
The response rate was also lower than in prior community studies (Mond et al., 2008; Welch et al., 2011); possibly yielding an underestimate of severity as non‐respondents have been shown to display more disordered eating (Beglin and Fairburn, 1992). However, the input to the factor analyses was the correlation matrix, i.e. the covariance between all the 22 EDE‐Q items. The exact influence of non‐response bias on this matrix is difficult to assess. In a large epidemiological study in Norway able to assess the impact of non‐response bias on prevalence and correlation estimates (Stormark et al., 2008), the latter was the least biased (r's deviating at most ± .05). As the response rate in the present study was much lower (37%) than in the Stormark et al. (2008) study (72%), the present correlation matrix might be biased to a larger extent. Although the amount of bias is unknown, we do not expect large and detrimental biases as the presently reported factor structure was in line with reports by others (e.g., Peterson et al., 2007). Also, as the g factor pulls out most of the variance (loads on all items), a biased correlation matrix would bias the structure of the primary factors to a larger extent than the general factor. Due to the lack of previous studies employing similar methods and the absence of comparison data, this possibility remains to be reexamined in future studies.
Conclusions
The original factor solution of Fairburn was not replicated. In light of the problems in replicating the original factor structure, which the current study confirmed, we cannot recommend calculating subscale scores (EC, WC, SC and DR) when assessing eating pathology due to the considerable uncertainty in the correct grouping of the items. Most importantly, the specification of a g‐factor clearly improved model fit and proved valuable in accounting for significant relationships between relevant variables such as age and BMI. Our study provides a novel way of partitioning the variance components from the EDE‐Q and new evidence supporting the validity of the global EDE‐Q score as a useful indicator of overall eating problems (i.e. g). Several studies have provided normative data for the EDE‐Q global score, which provides a useful framework of interpretation (Mond et al., 2006; Ro et al., 2010). A combined SC and WC subscale was strongly related to the g factor and these 11 items may provide a briefer screen of ED pathology for clinicians and researchers in need of an abbreviated version of the EDE‐Q.
Declaration of interest statement
None of authors have stated any conflicts of interests.
References
- Allen K.L., Byrne S.M., Lampard A., Watson H., Fursland A. (2011) Confirmatory factor analysis of the eating disorder examination‐questionnaire (EDE‐Q). Eating Behavior, 12(2), 143–151, DOI: 10.1016/j.eatbeh.2011.01.005 [DOI] [PubMed] [Google Scholar]
- Becker A.E., Thomas J.J., Bainivualiku A., Richards L., Navara K., Roberts A.L., Gilman S.E., Striegel‐Moore R.H. (2010) Validity and reliability of a Fijian translation and adaptation of the Eating Disorder Examination Questionnaire. International Journal of Eating Disorders, 43(2), 171–178, DOI: 10.1002/eat.20675 [DOI] [PMC free article] [PubMed] [Google Scholar]
- Becker A.E., Thomas J.J., Pike K.M. (2009) Should non‐fat‐phobic anorexia nervosa be included in DSM‐V? International Journal of Eating Disorders, 42(7), 620–635, DOI: 10.1002/eat.20727 [DOI] [PubMed] [Google Scholar]
- Beglin S., Fairburn C.G. (1992) Women who choose not to participate in surveys on eating disorders. International Journal of Eating Disorders, 12(1), 113–116, DOI: [DOI] [Google Scholar]
- Berg K.C., Peterson C.B., Frazier P., Crow S.J. (2011) Convergence of scores on the interview and questionnaire versions of the Eating Disorder Examination: a meta‐analytic review. Psychological Assessment, 23(3), 714–724, DOI: 10.1037/a0023246 [DOI] [PMC free article] [PubMed] [Google Scholar]
- Berg K.C., Peterson C.B., Frazier P., Crow S.J. (2012) Psychometric evaluation of the Eating Disorder Examination and Eating Disorder Examination‐Questionnaire: a systematic review of the literature. International Journal of Eating Disorders, 45(3), 428–438, DOI: 10.1002/eat.20931 [DOI] [PMC free article] [PubMed] [Google Scholar]
- Black C.M.D., Wilson G.T. (1996) Assessment of eating disorders: interview versus questionnaire. International Journal of Eating Disorders, 20(1), 43–50, DOI: [DOI] [PubMed] [Google Scholar]
- Byrne S.M., Allen K.L., Lampard A.M., Dove E.R., Fursland A. (2010) The factor structure of the eating disorder examination in clinical and community samples. International Journal of Eating Disorders, 43(3), 260–265, DOI: 10.1002/eat.20681 [DOI] [PubMed] [Google Scholar]
- Chou C.P., Bentler P.M., Satorra A. (1991) Scaled test statistics and robust standard errors for nonnormal data in covariance structure‐analysis. A Monte‐Carlo study. British Journal of Mathematical and Statistical Psychology, 44(2), 347–357. [DOI] [PubMed] [Google Scholar]
- Cooper Z., Cooper P.J., Fairburn C.G. (1989) The validity of the Eating Disorder Examination and its subscales. British Journal of Psychiatry, 154(6), 807–812, DOI: 10.1192/bjp.154.6.807 [DOI] [PubMed] [Google Scholar]
- Decaluwe V., Braet C. (2004) Assessment of eating disorder psychopathology in obese children and adolescents: Interview versus self‐report questionnaire. Behavior Research Therapy, 42(7), 799–811, DOI: 10.1016/j.brat.2003.07.008 [DOI] [PubMed] [Google Scholar]
- Engelsen B.K., Laberg J.C. (2001) A comparison of three questionnaires (EAT‐12, EDI, and EDE‐Q) for assessment of eating problems in healthy female adolescents. Nordic Journal of Psychiatry, 55(2), 129–135, DOI: 10.1080/08039480151108589. [DOI] [PubMed] [Google Scholar]
- Fairburn C.G. (2009) Eating Disorder Examination (Edition 16.0D) and Eating Disorder Examination Questionnarie (EDE‐Q 6.0) In Fairburn C.G. (ed.) Cognitive Therapy and Eating Disorders, pp. 265–313, New York, Guildford Press. [Google Scholar]
- Fairburn C.G., Beglin S.J. (1994) Assessment of eating disorders: interview or self‐report questionnaire? International Journal of Eating Disorders, 16(4), 363–370. [PubMed] [Google Scholar]
- Fairburn C.G., Cooper Z. (1993) The Eating Disorder Examination In Fairburn C.G., Wilson G.T. (eds) Binge Eating: Nature, Assessment and Treatment, pp. 317–360, New York, Guildford Press. [Google Scholar]
- Fairburn C.G., Cooper Z., Doll H.A., O'Connor M.E., Bohn K., Hawker D.M., Wales J.A., Palmer R.L. (2009) Transdiagnostic cognitive‐behavioral therapy for patients with eating disorders: a two‐site trial with a 60 week follow up. American Journal of Psychiatry, 166(3), 311–319, DOI: 10.1176/appi.ajp.2008.08040608 [DOI] [PMC free article] [PubMed] [Google Scholar]
- Fairburn C.G., Cooper Z., Shafran R. (2003) Cognitive behaviour theory for eating disorders: a ‘transdiagnostic’ theory and treatment. Behavior Research Therapy, 41(5), 509–528, DOI: 10.1016/S0005-7967(02)00088-8 [DOI] [PubMed] [Google Scholar]
- Ghaderi A., Scott B. (2002) The preliminary reliability and validity of the Survey for Eating Disorders (SEDs): a self‐report questionnaire for diagnosing eating disorders. European Eating Disorders Review, 10(1), 61–76. [Google Scholar]
- Goossens L., Braet C. (2010) Screening for eating pathology in the pediatric field. International Journal of Pediatric Obesity, 5(6), 483–490, DOI: 10.3109/17477160903571995. [DOI] [PubMed] [Google Scholar]
- Grilo C.M., Crosby R.D., Peterson C.B., Masheb R.M., White M.A., Crow S.J., Wonderlich S.A., Mitchell J.E. (2010) Factor structure of the eating disorder examination interview in patients with binge‐eating disorder. Obesity, 18(5), 977–981, DOI: 10.1038/oby.2009.321 [DOI] [PMC free article] [PubMed] [Google Scholar]
- Hrabosky J.I., White M.A., Masheb R.M., Rothschild B.S., Burke‐Martindale C.H., Grilo C.M. (2008) Psychometric evaluation of the Eating Disorder Examination‐Questionnaire for bariatric surgery candidates. Obesity, 16(4), 763–769, DOI: 10.1038/oby.2008.142 [DOI] [PMC free article] [PubMed] [Google Scholar]
- Marsh H.W., Hau K.T., Wen Z. (2004) In search of golden rules: Comment on hypothesis‐testing approaches to setting cutoff values for fit indexes and dangers in overgeneralizing Hu and Bentler's (1999) findings. Structural Equation Modeling, 11(3), 320–341, DOI: 10.1207/s15328007sem1103_2 [DOI] [Google Scholar]
- Mond J.M., Hay P.J., Rodgers B., Owen C. (2006) Eating Disorder Examination Questionnaire (EDE‐Q): Norms for young adult women. Behavior Research Therapy, 44(1), 53–62, DOI: 10.1016/j.brat.2004.12.003 [DOI] [PubMed] [Google Scholar]
- Mond J.M., Hay P.J., Rodgers B., Owen C., Beumont P.J.V. (2004) Validity of the Eating Disorder Examination Questionnaire (EDE‐Q) in screening for eating disorders in community samples. Behavior Research Therapy, 42(5), 551–567, DOI: 10.1016/S0005-7967(03)00161-X [DOI] [PubMed] [Google Scholar]
- Mond J.M., Myers T.C., Crosby R.D., Hay P.J., Rodgers B., Morgan J.F., Lacey J.H., Mitchell J.E. (2008) Screening for eating disorders in primary care: EDE‐Q versus SCOFF. Behavior Research Therapy, 46(5), 612–622, DOI: 10.1016/j.brat.2008.02.003 [DOI] [PubMed] [Google Scholar]
- O'Connor B.P. (2000) SPSS and SAS programs for determining the number of components using parallel analysis and Velicer's MAP test. Behavior Research Methods, Instrumentation & Computers, 32(3), 396–402, DOI: 10.3758/BF03200807 [DOI] [PubMed] [Google Scholar]
- Peterson C.B., Crosby R.D., Wonderlich S.A., Joiner T., Crow S.J., Mitchell J.E., Bardone‐Cone A.M., Klein M., le Grange D. (2007) Psychometric properties of the Eating Disorder Examination‐Questionnaire: factor structure and internal consistency. International Journal of Eating Disorders, 40(4), 386–389, DOI: 10.1002/eat.20373 [DOI] [PubMed] [Google Scholar]
- Ro O., Bang L., Reas D.L., Rosenvinge J.H. (2012) The impact of age and bmi on impairment due to disordered eating in a large female community sample. Eating Behaviors, 13(4), 342–346, DOI: 10.1016/j.eatbeh.2012.05.010 [DOI] [PubMed] [Google Scholar]
- Ro O., Reas D.L., Lask B. (2010) Norms for the Eating Disorder Examination Questionnaire among female university students in Norway. Nordic Journal of Psychiatry, 64(6), 428–432, DOI: 10.3109/08039481003797235 [DOI] [PubMed] [Google Scholar]
- Smith F.M., Latchford G.J., Hall R.M., Dickson R.A. (2008) Do chronic medical conditions increase the risk of eating disorder? A cross‐sectional investigation of eating pathology in adolescent females with scoliosis and diabetes. Journal of Adolescent Health, 42(1), 58–63, DOI: 10.1016/j.jadohealth.2007.08.008 [DOI] [PubMed] [Google Scholar]
- von Soest T., Wichstrøm L. (2009) Gender differences in the development of dieting from adolescence to early adulthood: A longitudinal study. Journal of Research on Adolescence, 19(3), 509–529, DOI: 10.1111/j.1532-7795.2009.00605.x [DOI] [Google Scholar]
- Stormark K.M., Heiervang E., Heimann M., Lundervold A., Gillberg C. (2008) Predicting nonresponse bias from teacher ratings of mental health problems in primary school children. Journal of Abnormal Child Psychology, 36(3), 411–419, DOI: 10.1007/s10802-007-9187-3 [DOI] [PubMed] [Google Scholar]
- Wade T.D., Byrne S., Bryan‐Waugh R. (2008) The eating disorder examination: norms and construct validity with young and middle adolescent girls. International Journal of Eating Disorders, 41(6), 551–558, DOI: 10.1002/eat.20526 [DOI] [PubMed] [Google Scholar]
- Welch E., Birgegard A., Parling T., Ghaderi A. (2011) Eating Disorder Examination Questionnaire and Clinical Impairment Assessment Questionnaire: general population and clinical norms for young adult women in Sweden. Behavior Research Therapy, 49(2), 85–91, DOI: 10.1016/j.brat.2010.10.010 [DOI] [PubMed] [Google Scholar]