

Abstract
The Centre for Epidemiologic Studies of Depression (CES‐D) and the Euro‐D are commonly used depressive symptom scales but their comparability has not been assessed to date. This article aims to contribute to the literature comparing the drivers of depression in old age across countries by examining whether CES‐D (in its eight‐item short version) and Euro‐D are comparable. Data from the Survey of Health, Ageing and Retirement in Europe (SHARE, N = 15,487) covering 13 countries was used to examine the scales’ distributional properties, systematic differences between population subgroups, sensitivity and specificity, and associations with established risk factors for depression in old age. CES‐D and Euro‐D were strongly correlated (r = 0.6819, p < 0.000). However, agreement between the two scales was moderate. There were systematic discrepancies in scores by demographic characteristics. CES‐D captures a more extreme pool of depressed individuals than Euro‐D. Although associations with risk factors are always in the same direction, they are often stronger for CES‐D than Euro‐D. Findings highlight the need to be cautious when comparing depression levels and associations with risk factors between surveys using different measures of depressive symptoms. Copyright © 2015 John Wiley & Sons, Ltd.
Keywords: depression, old age, Euro‐D, CES‐D
Introduction
Depression is the leading cause of years lived with disability and the fourth leading contributor to the global burden of disease worldwide (Alexopoulos, 2005; Djernes, 2006; Ferrari et al., 2013). Depression is also the most frequent cause of emotional suffering in later life (Beekman et al., 1999). A growing literature based on cross‐national comparable data suggests that there are significant differences in the prevalence of later‐life depressive symptoms across countries (Castro‐Costa et al., 2007; Kok et al., 2012; Missinne et al., 2014; Ploubidis and Grundy, 2009). In addition, recent studies suggest that risk factors for depression may differ cross‐nationally (Crimmins et al., 2011; Di Gessa and Grundy, 2014; Lunau et al., 2013; Riumallo‐Herl et al., 2014; Siegrist et al., 2012). Most of these studies are based on data from harmonized longitudinal ageing studies, such as the Survey of Health, Ageing and Retirement in Europe (SHARE), the English Longitudinal Study of Ageing (ELSA) and the Health and Retirement Survey (HRS) in the United States (US). An advantage of these surveys is that they include broadly comparable measures of health, employment, social interactions and well‐being (Banks et al., 2012; Börsch‐Supan et al., 2005; National Institute on Ageing, 2014). However, they use different measures to assess depressive symptoms. While SHARE uses the Euro‐D scale of depressive symptoms, HRS and ELSA rely on a short version of the Centre for Epidemiological Studies Depression (CES‐D) scale. Although measurement comparability is an essential prerequisite for robust comparisons across countries, it is as yet unclear how the CES‐D scale compares to the Euro‐D scale, and whether cross‐national comparisons using these two different measures are valid.
In this paper, we exploit unique data from the second wave of SHARE, which administered both the CES‐D and Euro‐D scales to a sample of older Europeans in 13 countries. Our aim was to assess the comparability of the scales; their sensitivity and specificity to identify depression caseness; and to assess differences in the association of each scale with established risk factors for depression. To our knowledge, this is the first study examining the comparability of the CES‐D and Euro‐D measures of depressive symptoms.
Methods
Data collection and participants
SHARE is a longitudinal, nationally representative survey designed to provide comparable information on the health, employment and social conditions of Europeans aged 50+ in 13 countries (Austria, Belgium, Czechia, Denmark, France, Germany, Greece, Italy, Poland, Spain, Sweden, Switzerland and the Netherlands). Specific details about the survey are available elsewhere (Börsch‐Supan and Jürges, 2005). Participants in each country were interviewed in 2004/2005 and subsequently re‐interviewed in 2006/2007, 2008/2009, 2010/2011 and 2012/2013 through face‐to‐face interviews using computer‐assisted personal interviewing (CAPI) technology. Expert agencies translated items, with extensive pre‐testing to ensure comparability. Response rates varied from country to country, but overall household response at enrolment was 62% (Börsch‐Supan and Jürges, 2005). For our analysis, we used data from the second wave, which contained measures of both the Euro‐D and CES‐D for the same respondents. Only respondents with scores from the two scales were included in the analysis, resulting in a final sample of 15,487 respondents.
Measures
We compared two scales of depressive symptoms: (a) the eight‐item version of the CES‐D scale; and (b) the 12‐item EURO‐D scale. The original CES‐D scale comprises 20 items (Radloff, 1977), but shorter versions are frequently used and have been shown to be reliable (Kohout et al., 1993). An eight‐item version of the CES‐D scale was included in the second wave of SHARE, asking respondents whether they had experienced any of the following symptoms during the previous week: felt depressed, felt that everything was an effort, felt that their sleep was restless, were happy, felt lonely, enjoyed life, felt sad, or were unable to get going. Possible responses were yes or no. The score ranges from zero to eight, with higher scores indicating higher levels of depressive symptoms. A cutoff point of three is frequently used to define depression caseness (Han, 2002; Turvey et al., 1999). The CES‐D scale was originally designed to measure depressive symptom levels in the US but the validity of translated versions has been confirmed for European countries (Fuhrer and Rouillon, 1989; Goncalves and Fagulha, 2004; Missinne et al., 2014; Van de Velde et al., 2010a, 2010b).
The EURO‐D scale was developed to collect harmonized data on late‐life depressive symptoms in the 11 European countries which took part in the EURODEP study (Prince et al., 1999). Five existing depression measures (Geriatric Mental State‐AGECAT, SHORT‐CARE, CES‐D, Zung Self‐rating Depression Scale, and the Comprehensive Psychopathological Rating Scale) were merged to form a 12‐item scale (Prince et al., 1999). The Euro‐D has been evaluated as reliable and is highly correlated with other mental health measures (Prince et al., 1999). Respondents were asked to report whether during the past month they experienced any of the following symptoms: depressed mood, pessimism, suicidality, guilt, sleep, interest, irritability, appetite, fatigue, concentration, enjoyment and tearfulness. Possible responses were yes or no. The score ranges from zero to 12, with higher scores indicating higher levels of depressive symptoms (Prince, 2002). A threshold of four has been suggested for depression caseness (Castro‐Costa et al., 2007, 2008; Dewey and Prince, 2005).
Data analysis
As the two scales include different numbers of items and consequently have different total scores, values were normalized to obtain a common metric for both ranging from zero to one. Normalized scales were obtained by dividing individual scores by the country‐specific maximum value for each scale. For Euro‐D, this value ranged from zero to 11 or 12 depending on the country, while for CES‐D this ranged from zero to eight. Roughly, estimates from normalized scores can be translated into original scales by multiplying coefficients by the mid‐range of the maximum value for each scale.
First, to assess whether there were systematic differences in the response to each scale by the same respondent, a difference score (Euro‐D minus CES‐D) was used to summarize congruence between the two scales (Edwards, 2001). Ordinary least squares (OLS) models were then used to assess the predictors of incongruence (Buber and Engelhardt, 2011; Cairney and Krause, 2005). All multiple linear regression models included gender, age in three categories (50 to 60, 61 to 70, over 70), marital status (married or in a partnership; divorced, widowed or single), education in three categories (primary education or less; secondary education; post‐secondary education), a measure of economic strain (household is able to make ends meet with difficulty or with some difficulty; household is able to make ends meet easily or fairly easily), the number of chronic illnesses (less than two chronic illnesses; two or more chronic illnesses), limitations in activities of daily living (ADLs) (less than one limitation with ADLs; more than one limitation with ADLs) reported by the respondent; and country of residence.
The Euro‐D and CES‐D scales use different cutoff points to determine depression caseness, i.e. whether respondents are likely to be clinically depressed. We estimated Cohen's kappa (κ) scores to assess the level of agreement between the two scores in identifying depression caseness. Values range between zero (agreement equivalent to chance) and one (perfect agreement) (Altman, 1991). Next, the sensitivity (proportion of depressed individuals identified as depressed) and the specificity (proportion of non‐depressed individuals categorized as non‐depressed) of the CES‐D were estimated, using the Euro‐D scale as reference. A perfect match would be described as 100% sensitive (all respondents classified as depressed by the Euro‐D scale are classified as depressed by the CES‐D scale) and 100% specific (all respondents classified as non‐depressed in the Euro‐D scale are classified as non‐depressed by the CES‐D scale). We used the recommended threshold for caseness for depression for both scales. In sensitivity analyses, we examined alternative cutoff points (e.g. a threshold of three for the Euro‐D scale, as sometimes recommended in the literature). We found that results were not sensitive to the specific thresholds and therefore decided to report only the results for the optimal combination between two scores (four for Euro‐D and three for CES‐D). The Receiver Operating Characteristic (ROC) curve was also used to examine whether the CES‐D scale identified the same depressed respondents as the Euro‐D scale. The ROC curve (Hanley and McNeil, 1982) measures the overall ability of the CES‐D scale to discriminate against the criterion of the Euro‐D score. The area under the ROC curve measures accuracy: an area of one represents a “perfect match”, while an area of 0.5 represents a “worthless match”. A value between 0.90 and 1 was considered as excellent, between 0.80 and 0.90 as good, and between 0.70 and 0.80 as fair (Hanley and McNeil, 1982).
Finally, the associations between each normalized depression score and selected well‐established risk factors for depression were explored. Multiple linear regression models were first estimated to assess whether the associations of depressive symptoms with risk factors differed for the two scales. Coefficients report the association between each explanatory variable and the continuous outcome score. Logistic regression was then used to estimate the association between each risk factor and depressive symptomatology. Cross‐equation tests were performed to determine whether the associations between depressive symptom scores and explanatory variables were statistically different across the two scales.
All analyses were conducted using Stata 13 (StataCorp, 2013).
Results
Descriptive statistics
The correlation between the two scores was 0.6819 (p < 0.000). The scales had a similar level of internal consistency as measured by the Cronbach's alpha (eight‐item CES‐D, α = 0.82; 12‐item Euro‐D, α = 0.72), which are indicative of high reliability in measuring depressing symptoms.
Distributions of the CES‐D and Euro‐D scores are presented in Figure 1. The Kernel density plot shows that the CES‐D scale is more skewed to the left than the Euro‐D scale (i.e. CES‐D scores fall under lower depressive symptoms scores than Euro‐D scores). Table 1 reports the summary statistics for the two scores for the entire sample and separately by gender and age group. The mean is 0.20 for both scales, but the larger standard deviation of the CES‐D (0.26) compared to the Euro‐D (0.20) illustrates the wider spread and left tale of the CES‐D scale. Paired t‐tests indicated that differences in means were significant only for the youngest age group (higher depression scores using the Euro‐D scale) and for respondents aged 70+ (higher depression scores using the CES‐D scale).
Figure 1.
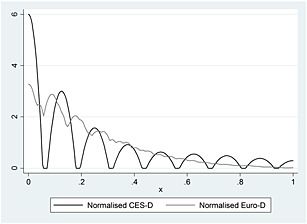
Kernel density plot of the normalized CES‐D and Euro‐D scales.
Table 1.
Summary statistics of the normalized CES‐D and Euro‐D scores (N = 15,487)
| Euro‐D | CES‐D | Comparison | ||||||
|---|---|---|---|---|---|---|---|---|
| N | Mean | Standard deviation | N | Mean | Standard deviation | Paired t‐test | P Value | |
| Entire sample | 15,487 | 0.20 | 0.20 | 15,487 | 0.20 | 0.26 | 0.5192 | 0.6036 |
| Females | 8,445 | 0.23 | 0.20 | 8,445 | 0.23 | 0.28 | −1.3634 | 0.1728 |
| Males | 7,042 | 0.15 | 0.17 | 7,042 | 0.15 | 0.22 | 0.9244 | 0.3553 |
| 50 to 60 | 6,372 | 0.18 | 0.18 | 6,372 | 0.17 | 0.24 | 3.8248 | 0.0001 |
| 61 to 70 | 4,812 | 0.18 | 0.18 | 4,812 | 0.18 | 0.25 | 1.4147 | 0.1572 |
| Over 70 | 4,303 | 0.24 | 0.21 | 4,303 | 0.25 | 0.25 | −6.6647 | 0.0000 |
Intra‐individual differences
The determinants of intra‐individual differences in scores are formally explored in Table 2, which presents estimates from the linear regression analyses with the difference between the Euro‐D and the CES‐D score as dependent variable [Mean = 0.009; standard deviation (SD) = 0.192]. A value of zero for males, for example, would indicate that males do not display different levels of incongruence as compared to females. In contrast, a positive value would indicate that males display a larger positive discrepancy between the Euro‐D and CES‐D scales than do females. Results show that most variables examined significantly predict the difference scores. Males, those over 70 years of age, those with lower educational attainment, those with 2+ chronic diseases, those with one or more limitations in ADLs, those divorced, widowed or single, and those experiencing economic strain are significantly more likely to have a negative discrepancy between the Euro‐D and CES‐D scales than their respective counterparts. Significant score differences were also found between countries. Respondents in Sweden, the Netherlands, France, Denmark, Greece, Switzerland, Belgium, and Poland were more likely to score higher on the Euro‐D than the CES‐D score compared to respondents in Austria (the reference country), while the opposite was true for Italy.
Table 2.
Estimated differences in CES‐D and Euro‐D depressive symptoms scores (fully adjusted model)
| Score difference | |
|---|---|
| Male | −0.0116** (0.00382) |
| 61 to 70 (ref.: 50 to 60) | 0.00184 (0.00448) |
| Over 70 | −0.0102* (0.00503) |
| Divorced, widowed or single | −0.0374*** (0.00418) |
| Secondary education (ref.: primary education or less) | 0.00889 (0.00504) |
| Post‐secondary education | 0.0122* (0.00569) |
| Economic strain | −0.0384*** (0.00453) |
| 2+ chronic diseases | −0.0176*** (0.00399) |
| 1+ limitations in ADLs | −0.0494*** (0.00778) |
| Germany (ref.: Austria) | −0.00997 (0.0107) |
| Sweden | 0.0506*** (0.0103) |
| Netherlands | 0.0648*** (0.0101) |
| Spain | 0.0220 (0.0115) |
| Italy | −0.0226* (0.0112) |
| France | 0.0598*** (0.0108) |
| Denmark | 0.0737*** (0.00998) |
| Greece | 0.0288** (0.0111) |
| Switzerland | 0.0411*** (0.0114) |
| Belgium | 0.0418*** (0.0103) |
| Czechia | −0.0113 (0.0107) |
| Poland | 0.0395*** (0.0118) |
| Constant | 0.00805 (0.0104) |
| Observations | 10,536 |
| R‐Squared | 0.068 |
Robust standard errors in parentheses.
p < 0.001,
p < 0.01,
p < 0.05.
1Chronic diseases include high blood pressure, high blood cholesterol, stroke, diabetes, chronic lung disease, asthma, arthritis, osteoporosis, cancer, stomach or duodenal ulcer, Parkinson disease, cataract and hip fracture.
2Activities of daily living (ADLs) include putting on shoes and socks, walking across a room, bathing or showering, eating, getting in and out of bed, using the toilet, including getting up and down.
3Low education levels correspond to having a high school degree or lower qualifications.
4Economic strain is defined as reporting difficulties to make ends meet in the past month.
Predicted score differences can be estimated for different individual profiles to illustrate the magnitude of these differences. For example, an Austrian male respondent, aged over 70, single or widowed, with secondary education, reporting both more than one limitation in ADL and more than two chronic conditions will score 0.0844 points higher on the CES‐D scale than on the Euro‐D scale. In contrast, an Austrian female in the youngest age group without health limitations, higher levels of education and married or in a partnership will have a smaller score difference of 0.054 point.
Discriminability of the two scales
The Euro‐D and the CES‐D score use different cutoff points to screen for older people with depression. The level of agreement between the two scores, as measured by the kappa score, was moderate [κ = 0.529, 95% confidence interval (CI) 0.514–0.545]. Table 3 reports the results of the sensitivity and specificity levels of the CES‐D scale, taking the Euro‐D scale as reference. Sensitivity was 62.6%, indicating that from all respondents identified as depressed by the Euro‐D scale, 62.6% are also classified as depressed by the CES‐D scale. This implies that 37.4% of respondents who were identified as depressed by the Euro‐D went “undetected” by the CES‐D scale. In turn, the specificity level was 89.5%, indicating that the CES‐D scale identifies as non‐depressed 89.5% of respondents categorized as non‐depressed by the Euro‐D scale. Table 3 also displays a positive predictive value of 65.7%, which corresponds to the proportion of respondents identified by the CES‐D scale as reporting high depressive symptoms who were also identified by the Euro‐D scale as reporting high depressive symptomatology.
Table 3.
Cross‐tabulation of the depression thresholds of the Euro‐D and CES‐D scores and associated sensitivity and specificity values
| Depressed Euro‐D | Non‐depressed Euro‐D | Total | |
|---|---|---|---|
| Depressed CES‐D | 2,389 | 1,413 | 3,802 |
| Non‐depressed CES‐D | 1,258 | 10,427 | 11,685 |
| Total | 3,647 | 11,840 | 15,487 |
| % | 95% CI | ||
| Sensitivity | 62.8 | 61.3–64.4 | |
| Specificity | 89.2 | 88.7–89.8 | |
| Positive predicted value | 65.5 | 63.9–67 | |
| Negative predicted value | 88.1 | 87.5–88.6 |
The ROC curve in Figure 2 plots the false (discordant) positives (non‐depressed individuals according to the Euro‐D scale who were classified as depressed by the CES‐D scale) against the true (concordant) positives for the cutoff points determined earlier. The area under the curve determines the accuracy of the CES‐D cutoff point compared to that of the Euro‐D scale, i.e. how well the scale separates the sample into those with and without high levels of depressive symptoms with the results of the Euro‐D scores as reference. The area under the ROC curve for our sample is 0.7603 (95% CI 0.7522–0.7684), which is considered as fair.
Figure 2.
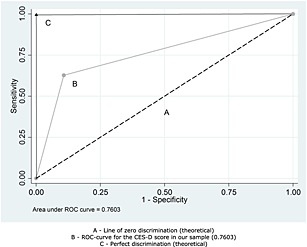
Receiver operating characteristic (ROC) curve for the CES‐D scale of depressive symptoms. A, Line of zero discrimination (theoretical); B, ROC‐curve for the CES‐D score in our sample (0.7603); C, perfect discrimination (theoretical).
Associations with established risk factors
Table 4 summarizes results from models that assess whether associations between depressive symptoms scores and established risk factors for depression in old age vary by scale. Findings from the linear regressions indicate that all predictors were significantly associated with both scales, with the exception of the oldest age group (over 70) for the normalized Euro‐D score. Associations with gender were larger for the Euro‐D than the CES‐D scale, but for most other variables, associations were stronger for the CES‐D. The largest difference between coefficients was found for marital status. Compared to their married counterparts, divorced, widowed or single respondents scored on average 0.0689 points higher (95% CI 0.0583–0.0789) on the CES‐D scale but only 0.0299 points higher (95% CI 0.0220–0.0371) on the Euro‐D. The two health variables included in the models (number of chronic diseases and of limitations in ADLs) were more strongly associated with the normalized CES‐D score. For instance, having more than one limitation in ADLs was associated with scoring 0.176 points higher (95% CI 0.1624–0.2027) on the normalized CES‐D scale compared to 0.126 points higher (95% CI 0.1154–0.1448) on the normalized Euro‐D score. Similarly, reporting two or more chronic illnesses was associated with scoring 0.0868 points higher (95% CI 0.0809–0.1007) on the normalized CES‐D score, versus 0.0692 (95% CI 0.0641–0.0787) on the Euro‐D score. Cross‐equation tests indicate that associations of depression with age, chronic diseases, marital status, ADLs, educational level and economic strain were significantly stronger for the CES‐D than for the Euro‐D scale. Only associations with gender were stronger for the Euro‐D. In order to understand how these differences translate back into original scores, Table A1 in the Appendix displays the OLS estimates using the original scale rather than the normalized scores. In the first two columns, we report results of the main regression for the normalized Euro‐D and CES‐D scores. The next two columns present estimates using original scales.
Table 4.
Linear regressions for the normalized CES‐D and Euro‐D depressive symptoms scores and odds ratios for caseness for depression (fully adjusted models)
| Linear regressions | Cross‐equation tests | Logistic regressions | Cross‐equation tests | |||||
|---|---|---|---|---|---|---|---|---|
| Normalized CES‐D | Normalized Euro‐D | Chi‐squared | P‐Value | CES‐D | Euro‐D | Chi‐squared | P‐Value | |
| Male | −0.0510*** | −0.0626*** | 2.57 | 0.1087 | 0.608*** | 0.470*** | 20.88 | 0.0000 |
| (0.00467) | (0.00353) | (0.0325) | (0.0251) | |||||
| 61 to 70 (ref.: 50 to 60) | −0.0188*** | −0.0170*** | 3.95 | 0.0470 | 0.816** | 0.749*** | 0.00 | 0.9946 |
| (0.00544) | (0.00402) | (0.0523) | (0.0473) | |||||
| Over 70 | 0.0116 | 0.00138 | 63.24 | 0.0000 | 1.012 | 0.860* | 18.72 | 0.0000 |
| (0.00622) | (0.00458) | (0.0665) | (0.0567) | |||||
| 2+ chronic illnesses | 0.0868*** | 0.0692*** | 120.68 | 0.0000 | 2.295*** | 2.249*** | 0.36 | 0.5501 |
| (0.00499) | (0.00370) | (0.121) | (0.118) | |||||
| 1+ limitations with ADLs | 0.176*** | 0.126*** | 152.44 | 0.0000 | 3.3365*** | 2.973*** | 2.51 | 0.1128 |
| (0.0101) | (0.00746) | (0.260) | (0.228) | |||||
| Divorced, single or widowed | 0.0653*** | 0.0279*** | 148.24 | 0.0000 | 1.861*** | 1.319*** | 41.67 | 0.0000 |
| (0.00523) | (0.00381) | (0.100) | (0.0707) | |||||
| Secondary education (ref.: primary education or less | −0.0313*** | −0.0224*** | 2.73 | 0.0986 | 0.760*** | 0.755*** | 1.48 | 0.2244 |
| (0.00638) | (0.00462) | (0.0469) | (0.0458) | |||||
| Post‐secondary education | −0.0348*** | −0.0226*** | 56.66 | 0.0000 | 0.650*** | 0.715*** | 1.61 | 0.2039 |
| (0.00704) | (0.00531) | (0.0523) | (0.0555) | |||||
| Economic strain | 0.0942*** | 0.0558*** | 262.06 | 0.0000 | 1.841*** | 1.659*** | 10.86 | 0.0010 |
| (0.00571) | (0.00411) | (0.132) | (0.114) | |||||
| Germany (ref.: Austria) | 0.0347** | 0.0247** | 35.22 | 0.0000 | 1.408* | 1.245 | 49.92 | 0.0000 |
| (0.0133) | (0.00934) | (0.207) | (0.199) | |||||
| Sweden | −0.0158 | 0.0348*** | 46.11 | 0.0000 | 0.739* | 1.074 | 0.18 | 0.6673 |
| (0.0130) | (0.00958) | (0.113) | (0.168) | |||||
| Netherlands | −0.0310* | 0.0338*** | 84.18 | 0.0000 | 0.632** | 1.236 | 9.98 | 0.0016 |
| (0.0127) | (0.00931) | (0.1000) | (0.195) | |||||
| Spain | 0.0274 | 0.0494*** | 4.68 | 0.0305 | 1.379* | 2.004*** | 0.25 | 0.6198 |
| (0.0158) | (0.0109) | (0.210) | (0.313) | |||||
| Italy | 0.0790*** | 0.0563*** | 129.64 | 0.0000 | 1.977*** | 2.433*** | 1.32 | 0.2508 |
| (0.0148) | (0.0101) | (0.280) | (0.357) | |||||
| France | 0.00220 | 0.0620*** | 44.90 | 0.0000 | 1.095 | 2.181*** | 40.03 | 0.0000 |
| (0.0137) | (0.00946) | (0.158) | (0.320) | |||||
| Denmark | −0.0658*** | 0.00785 | 98.76 | 0.0000 | 0.387*** | 0.915 | 12.94 | 0.0003 |
| (0.0127) | (0.00942) | (0.0674) | (0.151) | |||||
| Greece | −0.0409** | −0.0120 | 12.57 | 0.0004 | 0.829 | 1.004 | 15.18 | 0.0001 |
| (0.0137) | (0.00976) | (0.122) | (0.154) | |||||
| Switzerland | −0.0179 | 0.0232* | 9.80 | 0.0017 | 0.734 | 1.239 | 0.45 | 0.5012 |
| (0.0145) | (0.0106) | (0.136) | (0.225) | |||||
| Belgium | −0.00145 | 0.0404*** | 17.93 | 0.0000 | 1.047 | 1.532** | 2.18 | 0.1396 |
| (0.0133) | (0.00945) | (0.152) | (0.230) | |||||
| Czechia | 0.00954 | −0.00174 | 103.79 | 0.0000 | 1.244 | 1.261 | 46.65 | 0.0000 |
| (0.0139) | (0.00947) | (0.176) | (0.190) | |||||
| Poland | 0.0581*** | 0.0976*** | 7.43 | 0.0064 | 1.694*** | 3.708*** | 43.19 | 0.0000 |
| (0.0153) | (0.0104) | (0.244) | (0.548) | |||||
| Constant | 0.133*** | 0.141*** | 0.127*** | 0.141*** | ||||
| (0.0136) | (0.00955) | (0.0196) | (0.0221) | |||||
| Observations | 10,536 | 10,536 | 10,536 | 10,536 | ||||
| R‐Squared | 0.236 | 0.220 | 0.159 | 0.144 | ||||
Robust standard errors in parentheses.
p < 0.001,
p < 0.01,
p < 0.05.
Table 4 also displays the results of the logistic regression models, which summarize the association between explanatory variables and depressive symptomatology as ascertained by each scale. With the exception of three country dummies and age above 70 for the CES‐D scale, all variables were significantly associated with the odds of being classified as depressed by the two scales. In line with the results from the linear regressions, the largest difference between the two scales was found for marital status. Being divorced, single or widowed is associated with higher odds of being classified as depressed by the CES‐D scale (1.861, 95% CI 1.6750–2.0681) than by the Euro‐D scale (1.319, 95% CI 1.1873–1.4648). Cross‐equation tests suggest no significant difference between the two scales in their associations with health measures and educational level. However, the association with gender, being over 70, marital status and economic strain was stronger for the CES‐D score.
Country‐specific models
In supplementary analyses, separate models as presented in Table 4 were fitted for each country (see Appendix, Table A2). These models revealed no clear systematic differences between countries. Although it is difficult to identify a common pattern, in most countries, associations between health measures and education tended to be systematically stronger for the CES‐D than the Euro‐D. Gender differences were larger for the Euro‐D than for the CES‐D scale in many countries, confirming results from Table 4. In most countries, the largest difference between the Euro‐D and CES‐D scores was for associations with gender and marital status.
Discussion
Our aim was to assess the comparability of the Euro‐D and CES‐D scales, two measures commonly used in ageing surveys. We found a high correlation between the two scores, but there are important differences in their properties. The CES‐D scale is more skewed to the left resulting in a higher standard deviation compared to the Euro‐D scale. Being male, as well as characteristics associated with social disadvantage (older age, divorced/widowed/single, low education, economic strain) and higher levels of physical limitations (two or more chronic diseases and one or more ADLs limitations) are associated with significantly more negative discrepancies in assessments between the Euro‐D and CES‐D scales. Sensitivity estimates suggest that the CES‐D scale captures a more extreme pool of depressed individuals than the Euro‐D scale. As a result, the association between risk factors and depressive symptom scores is often stronger for the CES‐D than for the Euro‐D scale. Our findings highlight the need for some caution in interpreting comparisons of levels and associations with risk factors between surveys using different measures of depressive symptoms.
Limitations and strengths
Our study is unique by assessing depressive symptoms using the Euro‐D and CES‐D scales for the same respondents in representative samples of Europeans in 13 countries. However, several limitations should be considered. The scales use different reference periods: Euro‐D asks about depressive symptoms in the past month while CES‐D asks about symptoms in the past week (Zamarro et al., 2008). However, both scales have been shown to have relatively high test–retest reliability over short to medium periods of assessment, suggesting that although differences in reference periods might contribute to differences in scores, they are unlikely to fully account for the systematic differences in distributions observed in our study (Larraga et al., 2006; Radloff, 1977). In addition, the cross‐sectional nature of CES‐D and Euro‐D measures in SHARE did not enable us to examine comparatively in‐score changes. Moreover, our paper focused only on participants who responded to the questions used to build the two scores. Although focusing on these respondents was necessary in order to compare the scales, caution should be exercised when interpreting the results as respondents included in the study may not be representative of the full sample.
Despite these limitations, our study expands upon previous research by assessing the comparability of these two depression scales. An important question is why the same individual (presumably having a single underlying true depression state) reports different scores depending on the scale being used, resulting in more cases identified as depressed by the CES‐D than by the Euro‐D scale. A possible explanation is that the CES‐D scale includes items not included in the Euro‐D scale. In particular, the CES‐D includes two positive affect items (happiness and enjoyment of life), while the Euro‐D scale includes only negative affect items. The positive affect items in CES‐D may lead to sharper identification of depressed individuals, as those reporting no positive affect are more likely to have higher number of symptoms in the CES‐D, while those with no positive affect are not identified by the Euro‐D scale, which only asks about negative affect. This may partly explain why individuals with the same level of depression report more depressive symptoms in the CES‐D than the Euro‐D scale.
Implications for future research
Despite high levels of correlation between the two scales, caution in the interpretation of associations with risk factors is required. Our results highlight some differences in associations between CES‐D and Euro‐D with established risk factors for depression. This would suggest that differences in these associations reported in previous comparative studies are to some extent due to the use of different scales. However, an important question is whether differences between estimates for CES‐D and Euro‐D are clinically meaningful. In order to provide an estimate of the magnitude of differences in the associations between risk factors and depressive scores, we computed partial Eta‐squared (Richardson, 2011). This measure provides an estimate of the clinical significance of the results by comparing the relative sizes of the effects from different risk factors on depressive symptoms levels as measured by the two scales. Figure 3 displays the estimates for the two scores side by side, together with their 95% CI. For all variables, we find a small to medium effect size, according to Cohen's criterion (Cohen, 1988). More importantly for the validity of previous comparative studies using these scales together, we find that the 95% CI overlap for most risk factors, but gender and marital status. Based on the results presented in Table 2 (differences in CES‐D and Euro‐D depressive symptoms scores), we estimated the effect sizes of the differences between the two scales for gender and marital status. The effect size of the difference between two scores for these two risk factors is of 0.006 and 0.0087, respectively, values which correspond to very small effect sizes according to Cohen's criterion. Together, these results suggest that while the relationship between risk factors and depressive symptoms sometimes differ between the CES‐D and Euro‐D scales, conclusions on the clinical significance of the effects are often very similar between the two scales. This adds to the argument in favour of the comparability of the two measures.
Figure 3.
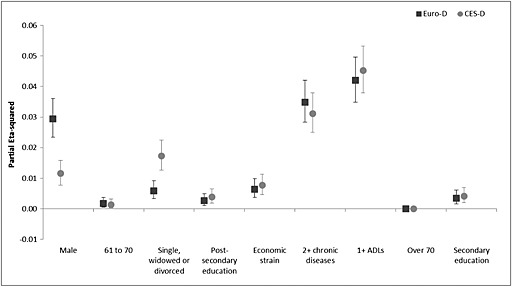
Effect sizes for the Euro‐D and CES‐D scores per risk factor.
There may also be several alternatives to address the differences between the two measures of depressive symptoms. A first approach would be to identify the items that are similar across both scales (e.g. depression, sleep, energy to do things), as done in earlier studies for robustness check (Riumallo‐Herl et al., 2014). This approach is still limited by the fact that the internal consistency of the two measures is compromised by using selected items individually. A second approach might be to use a more comprehensive set of measures of well‐being across surveys and to compare their findings with those of the depressive symptoms scale. For example, SHARE, ELSA and HRS include a 12‐item or 19‐item version of the CASP scale of well‐being (Control, Autonomy, Self‐realization and Pleasure), specifically designed to measure well‐being in old age (Wiggins et al., 2004). Using this scale in combination with depression scores and self‐reports of anti‐depressant use has been shown to provide a more comprehensive assessment of mental health in old age (Kruk and Reinhold, 2014; Ploubidis and Grundy, 2009). However, these extensive measures are costly and unlikely to be available always across different studies and across waves. In addition, the prescription of anti‐depressives may differ substantially across countries, again introducing a source of potential bias. A third, and potentially more feasible approach derived from our study would be to achieve comparability by rescaling the Euro‐D items to reflect the levels of depression as measured by the CES‐D scale. Following Jürges et al. (2008), it would be possible to make the two measures more comparable by imputing conditional probabilities. Assuming an individual with value x in the Euro‐D scale has systematically lower depressive symptom levels than an individual with the same value in the CES‐D scale, it is in principle possible to rescale down the Euro‐D values to match the same levels of depressive symptoms captured with the CES‐D scale. This would enhance cross‐national comparisons of depressive symptoms across countries, and it would diminish the systematic tendency of the CES‐D to show stronger associations with risk factors than the Euro‐D scale.
In conclusion, we find that despite a high correlation between the two scales, there are differences in the way individuals report depressive symptoms when using the Euro‐D and CES‐D scales. Our results suggest that while direct comparisons of depressive symptoms levels between countries and using different measures should be avoided, studies that compare associations between risk factors and depressive symptoms across countries using these measures can still be valid. Although the strength of associations differs, our study shows that associations between each scale and risk factors are often in the same direction and display similar levels of clinical significance. Rescaling one of the scales or using more comprehensive assessments of well‐being may be helpful in minimizing bias. Our findings imply that both scales measure the same underlying concept and, with some adjustments, can be used in comparative studies of the determinants of depression in old age.
Declaration of interest statement
The authors have no competing interests.
Table A1.
Linear regressions (fully adjusted) for the normalized and original CES‐D and Euro‐D scores
| Normalized CES‐D | Normalized Euro‐D | Original CES‐D | Original Euro‐D | |
|---|---|---|---|---|
| Male | −0.0510*** | −0.0626*** | −0.428*** | −0.732*** |
| (0.00467) | (0.00353) | (0.0377) | (0.0405) | |
| 61 to 70 | −0.0188*** | −0.0170*** | −0.174*** | −0.202*** |
| (0.00544) | (0.00402) | (0.0440) | (0.0462) | |
| Over 70 | 0.0116 | 0.00138 | 0.0421 | −0.0179 |
| (0.00622) | (0.00458) | (0.0503) | (0.0527) | |
| 2+ chronic illnesses | 0.0868*** | 0.0692*** | 0.727*** | 0.819*** |
| (0.00499) | (0.00370) | (0.0403) | (0.0425) | |
| 1+ limitations with ADLS | 0.176*** | 0.126*** | 1.461*** | 1.492*** |
| (0.0101) | (0.00746) | (0.0821) | (0.0859) | |
| Divorced, single or widowed | 0.0653*** | 0.0279*** | 0.549*** | 0.335*** |
| (0.00523) | (0.00381) | (0.0421) | (0.0438) | |
| Secondary education | −0.0313*** | −0.0224*** | −0.318*** | −0.323*** |
| (0.00638) | (0.00462) | (0.0514) | (0.0533) | |
| Post‐secondary education | −0.0348*** | −0.0226*** | −0.367*** | −0.333*** |
| (0.00704) | (0.00531) | (0.0566) | (0.0606) | |
| Economic strain | 0.0942*** | 0.0558*** | 0.417*** | 0.389*** |
| (0.00571) | (0.00411) | (0.0397) | (0.0437) | |
| Germany (ref.: Austria) | 0.0347** | 0.0247** | 0.314** | 0.148 |
| (0.0133) | (0.00934) | (0.108) | (0.109) | |
| Sweden | −0.0158 | 0.0348*** | −0.128 | 0.0439 |
| (0.0130) | (0.00958) | (0.105) | (0.108) | |
| Netherlands | −0.0310* | 0.0338*** | −0.232* | 0.239* |
| (0.0127) | (0.00931) | (0.103) | (0.108) | |
| Spain | 0.0274 | 0.0494*** | 0.348** | 0.708*** |
| (0.0158) | (0.0109) | (0.128) | (0.131) | |
| Italy | 0.0790*** | 0.0563*** | 0.797*** | 0.819*** |
| (0.0148) | (0.0101) | (0.119) | (0.121) | |
| France | 0.00220 | 0.0620*** | 0.0712 | 0.790*** |
| (0.0137) | (0.00946) | (0.112) | (0.114) | |
| Denmark | −0.0658*** | 0.00785 | −0.504*** | −0.0428 |
| (0.0127) | (0.00942) | (0.103) | (0.110) | |
| Greece | −0.0409** | −0.0120 | −0.0849 | −0.108 |
| (0.0137) | (0.00976) | (0.109) | (0.113) | |
| Switzerland | −0.0179 | 0.0232* | −0.0925 | 0.157 |
| (0.0145) | (0.0106) | (0.117) | (0.122) | |
| Belgium | −0.00145 | 0.0404*** | 0.0591 | 0.346** |
| (0.0133) | (0.00945) | (0.108) | (0.110) | |
| Czechia | 0.00954 | −0.00174 | 0.230* | 0.116 |
| (0.0139) | (0.00947) | (0.112) | (0.113) | |
| Poland | 0.0581*** | 0.0976*** | 0.710*** | 1.401*** |
| (0.0153) | (0.0104) | (0.123) | (0.124) | |
| Constant | 0.133*** | 0.141*** | ||
| (0.0136) | (0.00955) | |||
| Observations | 10,536 | 10,536 | 10,536 | 10,536 |
| R‐Squared | 0.236 | 0.220 | 0.219 | 0.226 |
Robust standard errors in parentheses.
p < 0.001,
p < 0.01,
p < 0.05.
Table A2.
Linear regressions for the normalized CES‐D and Euro‐D depressive symptoms scores and odds ratios for caseness for depression per country (fully adjusted)
| Linear regressions | Logistic regressions | |||
|---|---|---|---|---|
| Normalized CES‐D | Normalized Euro‐D | CES‐D | Euro‐D | |
| Austria | ||||
| Male | −0.0112 | −0.0432** | 0.999 | 0.390** |
| (0.0240) | (0.0157) | (0.262) | (0.119) | |
| 61 to 70 | 0.00259 | 0.0229 | 1.533 | 1.404 |
| (0.0264) | (0.0170) | (0.500) | (0.495) | |
| Over 70 | 0.0386 | 0.0425* | 2.461** | 1.670 |
| (0.0270) | (0.0189) | (0.780) | (0.599) | |
| 2+ chronic illnesses | 0.0837*** | 0.0662*** | 2.068** | 2.161** |
| (0.0240) | (0.0165) | (0.486) | (0.569) | |
| 1+ limitations with ADLs | 0.154*** | 0.122*** | 3.049*** | 3.893*** |
| (0.0432) | (0.0291) | (0.909) | (1.201) | |
| Divorced, single or widowed | 0.0474* | 0.0149 | 1.421 | 0.978 |
| (0.0239) | (0.0152) | (0.385) | (0.290) | |
| Secondary education | −0.0834* | 0.000159 | 0.762 | 0.831 |
| (0.0373) | (0.0235) | (0.219) | (0.263) | |
| Tertiary education | −0.101* | 8.56e − 05 | 0.373** | 0.957 |
| (0.0392) | (0.0260) | (0.142) | (0.372) | |
| Economic strain | 0.0752*** | 0.0467** | 2.348** | 2.047* |
| (0.0215) | (0.0149) | (0.677) | (0.668) | |
| Constant | 0.127** | 0.0740* | 0.0679*** | 0.0806*** |
| (0.0434) | (0.0292) | (0.0326) | (0.0451) | |
| Observations | 473 | 473 | 473 | 473 |
| R‐Squared | 0.168 | 0.171 | 0.142 | 0.134 |
| Belgium | ||||
| Male | −0.0805*** | −0.0921*** | 0.555** | 0.390*** |
| (0.0157) | (0.0120) | (0.102) | (0.0707) | |
| 61 to 70 | −0.0304 | −0.0253 | 0.820 | 0.767 |
| (0.0184) | (0.0143) | (0.170) | (0.156) | |
| Over 70 | −0.0527** | −0.0475*** | 0.630* | 0.576* |
| (0.0185) | (0.0143) | (0.137) | (0.125) | |
| 2+ chronic illnesses | 0.0882*** | 0.0591*** | 2.180*** | 1.653** |
| (0.0161) | (0.0123) | (0.379) | (0.289) | |
| 1+ limitations with ADLs | 0.214*** | 0.147*** | 4.337*** | 4.248*** |
| (0.0314) | (0.0247) | (1.073) | (1.041) | |
| Divorced, single or widowed | 0.0596*** | 0.0246 | 1.965*** | 1.249 |
| (0.0170) | (0.0126) | (0.353) | (0.225) | |
| Secondary education | −0.0328 | −0.00956 | 0.848 | 1.029 |
| (0.0199) | (0.0148) | (0.173) | (0.206) | |
| Tertiary education | −0.0374 | −0.0109 | 0.754 | 0.780 |
| (0.0216) | (0.0163) | (0.182) | (0.184) | |
| Economic strain | 0.0325* | 0.0157 | 1.400 | 1.356 |
| (0.0151) | (0.0119) | (0.264) | (0.243) | |
| Constant | 0.175*** | 0.213*** | 0.174*** | 0.290*** |
| (0.0261) | (0.0196) | (0.0497) | (0.0757) | |
| Observations | 978 | 978 | 978 | 978 |
| R‐Squared | 0.193 | 0.178 | 0.129 | 0.105 |
| Czechia | ||||
| Male | −0.0233 | −0.0401*** | 0.754 | 0.666* |
| (0.0168) | (0.0112) | (0.126) | (0.119) | |
| 61 to 70 | −0.0358 | −0.0273* | 0.736 | 0.790 |
| (0.0192) | (0.0128) | (0.144) | (0.166) | |
| Over 70 | 0.0336 | 0.0264 | 1.194 | 1.335 |
| (0.0224) | (0.0153) | (0.229) | (0.275) | |
| 2+ chronic illnesses | 0.101*** | 0.0719*** | 2.168*** | 2.297*** |
| (0.0169) | (0.0116) | (0.349) | (0.403) | |
| 1+ limitations with ADLs | 0.164*** | 0.131*** | 2.961*** | 2.418** |
| (0.0365) | (0.0282) | (0.796) | (0.651) | |
| Divorced, single or widowed | 0.101*** | 0.0441*** | 2.041*** | 1.698** |
| (0.0179) | (0.0117) | (0.331) | (0.293) | |
| Secondary education | −0.0245 | −0.0350* | 0.815 | 0.807 |
| (0.0249) | (0.0169) | (0.159) | (0.165) | |
| Tertiary education | −0.0831** | −0.0542** | 0.470* | 0.488* |
| (0.0295) | (0.0200) | (0.141) | (0.154) | |
| Economic strain | 0.0607* | 0.0100 | 2.081* | 1.058 |
| (0.0256) | (0.0159) | (0.666) | (0.308) | |
| Constant | 0.110** | 0.154*** | 0.127*** | 0.184*** |
| (0.0365) | (0.0238) | (0.0515) | (0.0688) | |
| Observations | 940 | 940 | 940 | 940 |
| R‐Squared | 0.175 | 0.180 | 0.112 | 0.0975 |
| Switzerland | ||||
| Male | −0.0663*** | −0.0740*** | 0.397** | 0.343*** |
| (0.0182) | (0.0151) | (0.121) | (0.0992) | |
| 61 to 70 | −0.0410 | −0.0504** | 0.719 | 0.643 |
| (0.0214) | (0.0173) | (0.251) | (0.207) | |
| Over 70 | −0.0219 | −0.0276 | 0.847 | 0.726 |
| (0.0251) | (0.0209) | (0.276) | (0.235) | |
| 2+ chronic illnesses | 0.0304 | 0.0408* | 1.418 | 1.527 |
| (0.0213) | (0.0179) | (0.391) | (0.420) | |
| 1+ limitations with ADLs | 0.0356 | 0.0634 | 1.008 | 1.150 |
| (0.0702) | (0.0508) | (0.574) | (0.572) | |
| Divorced, single or widowed | 0.0498* | 0.0386* | 1.749* | 1.825* |
| (0.0211) | (0.0168) | (0.496) | (0.494) | |
| Secondary education | −0.0200 | −0.0441 | 0.815 | 0.426* |
| (0.0350) | (0.0277) | (0.314) | (0.158) | |
| Tertiary education | −0.0336 | −0.0328 | 0.617 | 0.580 |
| (0.0365) | (0.0302) | (0.276) | (0.235) | |
| Economic strain | 0.0698*** | 0.0518*** | 2.853*** | 1.742* |
| (0.0186) | (0.0153) | (0.900) | (0.477) | |
| Constant | 0.144*** | 0.195*** | 0.120*** | 0.315** |
| (0.0404) | (0.0324) | (0.0598) | (0.141) | |
| Observations | 497 | 497 | 497 | 497 |
| R‐Squared | 0.113 | 0.156 | 0.110 | 0.103 |
| Germany | ||||
| Male | −0.0206 | −0.0523*** | 0.797 | 0.633* |
| (0.0162) | (0.0120) | (0.162) | (0.139) | |
| 61 to 70 | −0.0271 | −0.0181 | 0.614* | 0.613* |
| (0.0169) | (0.0124) | (0.143) | (0.147) | |
| Over 70 | 0.0348 | −0.0162 | 1.241 | 0.674 |
| (0.0208) | (0.0147) | (0.302) | (0.173) | |
| 2+ chronic illnesses | 0.105*** | 0.0855*** | 3.491*** | 3.085*** |
| (0.0170) | (0.0118) | (0.701) | (0.666) | |
| 1+ limitations with ADLs | 0.207*** | 0.149*** | 3.696*** | 3.391*** |
| (0.0361) | (0.0270) | (1.070) | (0.977) | |
| Divorced, single or widowed | 0.0754*** | 0.00761 | 2.130*** | 0.987 |
| (0.0185) | (0.0124) | (0.444) | (0.221) | |
| Secondary education | −0.132 | −0.0883 | 0.315 | 0.271 |
| (0.124) | (0.0618) | (0.287) | (0.182) | |
| Tertiary education | −0.172 | −0.110 | 0.160* | 0.204* |
| (0.124) | (0.0623) | (0.148) | (0.141) | |
| Economic strain | 0.0644*** | 0.0183 | 1.911** | 1.300 |
| (0.0142) | (0.0112) | (0.417) | (0.302) | |
| Constant | 0.228 | 0.237*** | 0.323 | 0.572 |
| (0.123) | (0.0627) | (0.300) | (0.409) | |
| Observations | 782 | 782 | 782 | 782 |
| R‐Squared | 0.255 | 0.204 | 0.196 | 0.108 |
| Denmark | ||||
| Male | −0.00116 | −0.0174 | 1.064 | 0.812 |
| (0.0130) | (0.0118) | (0.281) | (0.180) | |
| 61 to 70 | −0.0389** | −0.0668*** | 0.668 | 0.310*** |
| (0.0132) | (0.0122) | (0.212) | (0.0826) | |
| Over 70 | 0.00590 | −0.0427** | 0.928 | 0.419** |
| (0.0168) | (0.0151) | (0.298) | (0.121) | |
| 2+ chronic illnesses | 0.0293* | 0.0522*** | 1.628 | 2.782*** |
| (0.0124) | (0.0111) | (0.436) | (0.632) | |
| 1+ limitations with ADLs | 0.151*** | 0.113*** | 3.074** | 3.222*** |
| (0.0362) | (0.0267) | (1.117) | (1.026) | |
| Divorced, single or widowed | 0.0368** | 0.00697 | 1.989** | 1.019 |
| (0.0139) | (0.0125) | (0.526) | (0.240) | |
| Secondary education | −0.0174 | −0.00357 | 0.629 | 0.937 |
| (0.0192) | (0.0173) | (0.212) | (0.291) | |
| Tertiary education | 0.00802 | 0.00259 | 1.025 | 1.378 |
| (0.0203) | (0.0176) | (0.352) | (0.447) | |
| Economic strain | 0.0378** | 0.0518*** | 1.693* | 1.975** |
| (0.0122) | (0.0113) | (0.419) | (0.434) | |
| Constant | 0.0643** | 0.136*** | 0.0520*** | 0.104*** |
| (0.0233) | (0.0210) | (0.0236) | (0.0402) | |
| Observations | 826 | 826 | 826 | 826 |
| R‐Squared | 0.118 | 0.118 | 0.0830 | 0.0911 |
| Spain | ||||
| Male | −0.110*** | −0.0885*** | 0.430*** | 0.410*** |
| (0.0227) | (0.0165) | (0.0848) | (0.0815) | |
| 61 to 70 | −0.0107 | −0.0173 | 0.958 | 0.661 |
| (0.0268) | (0.0199) | (0.235) | (0.168) | |
| Over 70 | 0.0715* | 0.0353 | 1.376 | 1.054 |
| (0.0302) | (0.0207) | (0.348) | (0.253) | |
| 2+ chronic illnesses | 0.140*** | 0.0928*** | 2.344*** | 2.534*** |
| (0.0244) | (0.0174) | (0.463) | (0.494) | |
| 1+ limitations with ADLs | 0.172*** | 0.119*** | 2.944*** | 2.367** |
| (0.0405) | (0.0299) | (0.908) | (0.685) | |
| Divorced, single or widowed | 0.0389 | 0.0179 | 1.376 | 1.017 |
| (0.0246) | (0.0175) | (0.275) | (0.204) | |
| Secondary education | −0.00136 | −0.0150 | 0.882 | 0.698 |
| (0.0275) | (0.0190) | (0.207) | (0.163) | |
| Tertiary education | −0.0506 | −0.0250 | 0.535 | 0.877 |
| (0.0327) | (0.0257) | (0.208) | (0.297) | |
| Economic strain | 0.0889** | 0.0324 | 2.152* | 2.000* |
| (0.0292) | (0.0204) | (0.758) | (0.626) | |
| Constant | 0.112** | 0.182*** | 0.160*** | 0.251*** |
| (0.0377) | (0.0273) | (0.0652) | (0.0943) | |
| Observations | 646 | 646 | 646 | 646 |
| R‐Squared | 0.219 | 0.198 | 0.136 | 0.120 |
| France | ||||
| Male | −0.0882*** | −0.0760*** | 0.392*** | 0.401*** |
| (0.0165) | (0.0119) | (0.0732) | (0.0674) | |
| 61 to 70 | 0.00629 | 0.00972 | 1.101 | 0.896 |
| (0.0200) | (0.0138) | (0.227) | (0.168) | |
| Over 70 | −0.0306 | −0.0275 | 0.752 | 0.526** |
| (0.0210) | (0.0148) | (0.165) | (0.111) | |
| 2+ chronic illnesses | 0.0961*** | 0.0558*** | 2.306*** | 1.813*** |
| (0.0182) | (0.0123) | (0.398) | (0.291) | |
| 1+ limitations with ADLs | 0.138*** | 0.109*** | 2.720*** | 2.809*** |
| (0.0348) | (0.0219) | (0.750) | (0.717) | |
| Divorced, single or widowed | 0.114*** | 0.0425*** | 2.575*** | 1.621** |
| (0.0185) | (0.0126) | (0.451) | (0.260) | |
| Secondary education | −0.0590** | −0.0305* | 0.644* | 0.661* |
| (0.0196) | (0.0139) | (0.122) | (0.117) | |
| Tertiary education | −0.0391 | −0.0435** | 0.727 | 0.477** |
| (0.0226) | (0.0162) | (0.173) | (0.108) | |
| Economic strain | 0.0441* | 0.0576*** | 1.390 | 1.939** |
| (0.0173) | (0.0128) | (0.301) | (0.403) | |
| Constant | 0.149*** | 0.196*** | 0.184*** | 0.365*** |
| (0.0264) | (0.0196) | (0.0568) | (0.104) | |
| Observations | 944 | 944 | 944 | 944 |
| R‐Squared | 0.194 | 0.183 | 0.149 | 0.120 |
| Greece | ||||
| Male | −0.0677*** | −0.0869*** | 0.447*** | 0.339*** |
| (0.0155) | (0.0124) | (0.0897) | (0.0728) | |
| 61 to 70 | −0.0514** | −0.0186 | 0.494** | 0.785 |
| (0.0178) | (0.0135) | (0.119) | (0.196) | |
| Over 70 | −0.0144 | 0.0252 | 0.656 | 1.156 |
| (0.0217) | (0.0169) | (0.158) | (0.285) | |
| 2+ chronic illnesses | 0.0689*** | 0.0454*** | 2.024*** | 1.667* |
| (0.0163) | (0.0137) | (0.374) | (0.339) | |
| 1+ limitations with ADLs | 0.200*** | 0.165*** | 3.639*** | 3.413*** |
| (0.0386) | (0.0307) | (1.080) | (0.991) | |
| Divorced, single or widowed | 0.0822*** | 0.0306* | 2.061*** | 1.430 |
| (0.0168) | (0.0130) | (0.395) | (0.284) | |
| Secondary education | −0.0534** | −0.0379** | 0.683 | 0.646 |
| (0.0178) | (0.0137) | (0.145) | (0.147) | |
| Tertiary education | −0.0702** | −0.0304 | 0.361** | 0.609 |
| (0.0213) | (0.0175) | (0.112) | (0.182) | |
| Economic strain | 0.0798*** | 0.0403* | 2.283* | 1.907 |
| (0.0207) | (0.0162) | (0.863) | (0.728) | |
| Constant | 0.122*** | 0.149*** | 0.141*** | 0.143*** |
| (0.0291) | (0.0222) | (0.0600) | (0.0632) | |
| Observations | 955 | 955 | 955 | 955 |
| R‐Squared | 0.203 | 0.204 | 0.150 | 0.136 |
| Italy | ||||
| Male | −0.0897*** | −0.0864*** | 0.536*** | 0.339*** |
| (0.0193) | (0.0133) | (0.0855) | (0.0728) | |
| 61 to 70 | 0.00986 | 0.0112 | 1.070 | 0.785 |
| (0.0238) | (0.0157) | (0.201) | (0.196) | |
| Over 70 | 0.0349 | 0.0347 | 1.174 | 1.156 |
| (0.0276) | (0.0186) | (0.254) | (0.285) | |
| 2+ chronic illnesses | 0.139*** | 0.109*** | 2.835*** | 1.667* |
| (0.0200) | (0.0136) | (0.455) | (0.339) | |
| 1+ limitations with ADLs | 0.229*** | 0.170*** | 4.496*** | 3.413*** |
| (0.0347) | (0.0256) | (1.367) | (0.991) | |
| Divorced, single or widowed | 0.0805*** | 0.0325* | 1.616** | 1.430 |
| (0.0224) | (0.0153) | (0.278) | (0.284) | |
| Secondary education | −0.0679** | −0.0374* | 0.674* | 0.646 |
| (0.0225) | (0.0147) | (0.118) | (0.147) | |
| Tertiary education | −0.0836** | −0.0576* | 0.583 | 0.609 |
| (0.0305) | (0.0234) | (0.172) | (0.182) | |
| Economic strain | 0.0987** | 0.0429 | 2.287* | 1.907 |
| (0.0327) | (0.0256) | (0.789) | (0.728) | |
| Constant | 0.161*** | 0.166*** | 0.179*** | 0.143*** |
| (0.0412) | (0.0311) | (0.0711) | (0.0632) | |
| Observations | 895 | 895 | 895 | 895 |
| R‐Squared | 0.234 | 0.263 | 0.146 | 0.163 |
| Netherlands | ||||
| Male | −0.0346** | −0.0568*** | 0.638 | 0.339*** |
| (0.0128) | (0.0111) | (0.147) | (0.0728) | |
| 61 to 70 | −0.0301* | −0.00637 | 0.420** | 0.785 |
| (0.0145) | (0.0132) | (0.140) | (0.196) | |
| Over 70 | −0.00847 | −0.0220 | 0.802 | 1.156 |
| (0.0184) | (0.0142) | (0.219) | (0.285) | |
| 2+ chronic illnesses | 0.0617*** | 0.0645*** | 2.577*** | 1.667* |
| (0.0158) | (0.0133) | (0.598) | (0.339) | |
| 1+ limitations with ADLs | 0.192*** | 0.107*** | 4.827*** | 3.413*** |
| (0.0425) | (0.0309) | (1.540) | (0.991) | |
| Divorced, single or widowed | 0.0710*** | 0.0722*** | 2.262*** | 1.430 |
| (0.0156) | (0.0130) | (0.517) | (0.284) | |
| Secondary education | −0.0352 | −0.0264 | 0.609 | 0.646 |
| (0.0232) | (0.0188) | (0.167) | (0.147) | |
| Tertiary education | −0.0380 | −0.0322 | 0.633 | 0.609 |
| (0.0261) | (0.0210) | (0.216) | (0.182) | |
| Economic strain | 0.0413*** | 0.0179 | 2.028** | 1.907 |
| (0.0123) | (0.0110) | (0.501) | (0.728) | |
| Constant | 0.104*** | 0.167*** | 0.0849*** | 0.143*** |
| (0.0255) | (0.0215) | (0.0322) | (0.0632) | |
| Observations | 859 | 859 | 859 | 859 |
| R‐Squared | 0.175 | 0.172 | 0.158 | 0.110 |
| Poland | ||||
| Male | −0.0654** | −0.0822*** | 0.689* | 0.339*** |
| (0.0205) | (0.0139) | (0.114) | (0.0728) | |
| 61 to 70 | 0.0215 | −0.00303 | 1.162 | 0.785 |
| (0.0266) | (0.0171) | (0.242) | (0.196) | |
| Over 70 | 0.0229 | 0.0237 | 1.314 | 1.156 |
| (0.0283) | (0.0184) | (0.282) | (0.285) | |
| 2+ chronic illnesses | 0.155*** | 0.113*** | 2.824*** | 1.667* |
| (0.0216) | (0.0141) | (0.483) | (0.339) | |
| 1+ limitations with ADLs | 0.171*** | 0.0953*** | 3.073*** | 3.413*** |
| (0.0273) | (0.0176) | (0.599) | (0.991) | |
| Divorced, single or widowed | 0.102*** | 0.0268 | 1.872*** | 1.430 |
| (0.0235) | (0.0155) | (0.327) | (0.284) | |
| Secondary education | −0.0102 | −0.0306* | 0.819 | 0.646 |
| (0.0233) | (0.0155) | (0.153) | (0.147) | |
| Tertiary education | −0.0769** | −0.0508* | 0.571* | 0.609 |
| (0.0291) | (0.0213) | (0.156) | (0.182) | |
| Economic strain | 0.0778* | 0.0494 | 2.319 | 1.907 |
| (0.0382) | (0.0293) | (1.063) | (0.728) | |
| Constant | 0.127** | 0.221*** | 0.122*** | 0.143*** |
| (0.0433) | (0.0325) | (0.0602) | (0.0632) | |
| Observations | 825 | 825 | 825 | 825 |
| R‐Squared | 0.227 | 0.230 | 0.152 | 0.142 |
| Sweden | ||||
| Male | −0.0171 | −0.0374** | 0.767 | 0.339*** |
| (0.0133) | (0.0118) | (0.148) | (0.0728) | |
| 61 to 70 | −0.0366* | −0.0347** | 0.539* | 0.785 |
| (0.0159) | (0.0134) | (0.135) | (0.196) | |
| Over 70 | 0.0135 | 0.00739 | 0.988 | 1.156 |
| (0.0201) | (0.0162) | (0.247) | (0.285) | |
| 2+ chronic illnesses | 0.0529*** | 0.0567*** | 1.796** | 1.667* |
| (0.0148) | (0.0121) | (0.362) | (0.339) | |
| 1+ limitations with ADLs | 0.173*** | 0.149*** | 4.202*** | 3.413*** |
| (0.0352) | (0.0288) | (1.143) | (0.991) | |
| Divorced, single or widowed | 0.0262 | 0.0157 | 1.359 | 1.430 |
| (0.0141) | (0.0125) | (0.257) | (0.284) | |
| Secondary education | −0.0153 | 9.00e − 05 | 0.856 | 0.646 |
| (0.0169) | (0.0148) | (0.209) | (0.147) | |
| Tertiary education | 0.00583 | 0.00229 | 1.174 | 0.609 |
| (0.0178) | (0.0150) | (0.295) | (0.182) | |
| Economic strain | 0.0564*** | 0.0561*** | 1.970*** | 1.907 |
| (0.0133) | (0.0114) | (0.396) | (0.728) | |
| Constant | 0.102*** | 0.139*** | 0.0990*** | 0.143*** |
| (0.0216) | (0.0184) | (0.0326) | (0.0632) | |
| Observations | 916 | 916 | 916 | 916 |
| R‐Squared | 0.127 | 0.147 | 0.0980 | 0.103 |
Robust standard errors in parentheses.
p < 0.001,
p < 0.01,
p < 0.05.
Courtin, E. , Knapp, M. , Grundy, E. , and Avendano‐Pabon, M. (2015) Are different measures of depressive symptoms in old age comparable? An analysis of the CES‐D and Euro‐D scales in 13 countries. Int. J. Methods Psychiatr. Res., 24: 287–304. doi: 10.1002/mpr.1489.
References
- Alexopoulos G.S. (2005) Depression in the elderly. The Lancet, 365(9475), 1961–1971. [DOI] [PubMed] [Google Scholar]
- Altman D.G. (1991) Practical Statistics for Medical Research, London: Chapman and Hall. [Google Scholar]
- Banks J., Nazroo J., Steptoe A. (2012) The Dynamics of Ageing: Evidence from the English Longitudinal Study of Ageing 2002–2010, London: Institute for Fiscal Studies. [Google Scholar]
- Beekman A., Copeland J., Prince M. (1999) Review of community prevalence of depression in later life. British Journal of Psychiatry, 174, 307–311. [DOI] [PubMed] [Google Scholar]
- Börsch‐Supan A., Hank K., Jürges H. (2005) A new comprehensive and international view on ageing: Introducing the survey of health, ageing and retirement in Europe. European Journal of Ageing, 2(4), 245–253. [DOI] [PMC free article] [PubMed] [Google Scholar]
- Börsch‐Supan A., Jürges H. (eds) (2005) The Survey of Health, Ageing and Retirement in Europe – Methodology, Mannheim, Germany: University of Mannheim, Mannheim Research Institute for the Economics of Aging. [Google Scholar]
- Buber I., Engelhardt H. (2011) The association between age and depressive symptoms among older men and women in Europe. Findings from SHARE. Comparative Population Studies, 36(1), 103–126. [Google Scholar]
- Cairney J., Krause N. (2005) The social distribution of psychological distress and depression in older adults. Journal of Aging and Health, 17(6), 807–835. [DOI] [PubMed] [Google Scholar]
- Castro‐Costa E., Dewey M., Stewart R., Banerjee S., Huppert F., Mendonca‐Lima C., Bula C., Reisches F., Wancata J., Ritchie K., Tsolaki M., Mateos R., Prince M. (2007) Prevalence of depressive symptoms and syndromes in later life in ten European countries: The SHARE study. British Journal of Psychiatry, 191(5), 393–401. [DOI] [PubMed] [Google Scholar]
- Castro‐Costa E., Dewey M., Stewart R., Banerjee S., Huppert F., Mendonca‐Lima C., Bula C., Reisches F., Wancata J., Ritchie K., Tsolaki M., Mateos R., Prince M. (2008) Ascertaining late‐life depressive symptoms in Europe: an evaluation of the survey version of the EURO‐D scale in 10 nations. The SHARE project. International Journal of Methods in Psychiatric Research, 17(1), 12–29. [DOI] [PMC free article] [PubMed] [Google Scholar]
- Cohen J. (1988) Statistical Power Analysis for the Behavioral Sciences, New York: Routledge Academic. [Google Scholar]
- Crimmins E.M., Kim J.K., Solé‐Auró A. (2011) Gender differences in health: Results from SHARE, ELSA and HRS. European Journal of Public Health, 21(1), 81–91. [DOI] [PMC free article] [PubMed] [Google Scholar]
- Dewey M., Prince M. (2005) Mental health In Borsch‐Supan A. (ed) Health, Ageing and Retirement in Europe. First Results from the Survey of Health, Ageing and Retirement in Europe, pp. 108–117, Mannheim: Mannheim Research Institute for the Economics of Ageing. [Google Scholar]
- Di Gessa G., Grundy E. (2014) The relationship between active ageing and health using longitudinal data from Denmark, France, Italy and England. Journal of Epidemiology and Community Health, 68(3), 261–267. [DOI] [PubMed] [Google Scholar]
- Djernes J.K. (2006) Prevalence and predictors of depression in populations of elderly: A review. Acta Psychiatrica Scandinavica, 113(5), 372–387. [DOI] [PubMed] [Google Scholar]
- Edwards J.R. (2001) Ten difference score myths. Organizational Research Methods, 4(3), 264–286. [Google Scholar]
- Ferrari A., Charlson F., Norman R., Patten S., Freedman G., Murray C., Vos T., Whiteford H. (2013) Burden of depressive disorders by country, sex, age and year. Findings from the Global Burden of Disease study 2010. PLoS Medicine, 10(11). [DOI] [PMC free article] [PubMed] [Google Scholar]
- Fuhrer R., Rouillon F. (1989) Version française de l'échelle CES‐D (Center for Epidemiologic Studies‐Depression scale). Description et traduction de l'échelle d'autoévaluation. Psychiatrie Psychobiologie, 4(3), 163–166. [Google Scholar]
- Goncalves B., Fagulha T. (2004) The portuguese version of the Center for Epidemiologic Studies Depression scale (CES‐D). European Journal of Psychological Assessment, 20(4), 339–348. [Google Scholar]
- Han B. (2002) Depressive symptoms and self‐rated health in community‐dwelling older adults: A longitudinal study. Journal of the American Geriatrics Society, 50(9), 1549–1556. [DOI] [PubMed] [Google Scholar]
- Hanley J.A., McNeil B.J. (1982) The meaning and use of the area under a receiver operating characteristic (ROC) curve. Radiology, 143(1), 29–36. [DOI] [PubMed] [Google Scholar]
- Jürges H., Avendano M., Mackenbach J. (2008) Are different measures of self‐rated health comparable? An assessment in five European countries. European Journal of Epidemiology, 23(12), 773–781. [DOI] [PubMed] [Google Scholar]
- Kohout F.J., Berkman L.F., Evans D.A., Cornoni‐Huntley J. (1993) Two shorter forms of the CES‐D Depression Symptoms Index. Journal of Aging and Health, 5(2), 179–193. [DOI] [PubMed] [Google Scholar]
- Kok R., Avendano‐Pabon M., Bago d'Uva T., Mackenbach J.P. (2012) Can reporting heterogeneity explain differences in depressive symptoms across Europe? Social Indicators Research, 105(2), 191–210. [DOI] [PMC free article] [PubMed] [Google Scholar]
- Kruk K.E., Reinhold S. (2014) The effect of children on depression in old age. Social Science & Medicine, 100, 1–11. [DOI] [PubMed] [Google Scholar]
- Larraga L., Saz P., Dewey M., Marcos G., Lobo A. (2006) Validation of the Spanish version of the EURO‐D scale: An instrument for detecting depression in older people. International Journal of Geriatric Psychiatry, 21(12), 1199–1205. [DOI] [PubMed] [Google Scholar]
- Lunau T., Wahrendorf M., Dragano N., Siegrist J. (2013) Work stress and depressive symptoms in older employees: impact of national labour and social policies. BMC Public Health, 13(1), 1086. [DOI] [PMC free article] [PubMed] [Google Scholar]
- Missinne S., Vandevive C., Van de Velde S., Bracke P. (2014) Measurement equivalence of the CES‐D 8 depression‐scale among the ageing population in eleven European countries. Social Science Research, 46, 38–47. [DOI] [PubMed] [Google Scholar]
- National Institute on Ageing (2014) Growing older in America. The Health and Retirement Study, Washington, DC: US Department of Health and Human Services.3 [Google Scholar]
- Ploubidis G.B., Grundy E. (2009) Later‐life mental health in Europe: A country‐level comparison. Journal of Gerontology: Social Sciences, 64B(5), 666–676. [DOI] [PubMed] [Google Scholar]
- Prince M. (2002) The development of the EURO‐D scale In Copeland J., Abou‐Saleh M., Blazer D. (eds) Principles and Practice of Geriatric Psychiatry, pp. 159–160, London: John Wiley & Sons. [Google Scholar]
- Prince M., Reischies F., Beekman A.T., Fuhrer R., Jonker C., Kivela S.L., Lawlor B.A., Lobo A., Magnusson H., Fichter M., van Oyen H., Roelands M., Skoog I., Turrina C., Copeland J.R. (1999) Development of the EURO‐D scale – a European Union initiative to compare symptoms of depression in 14 European centres. British Journal of Psychiatry, 174(4), 330–338. [DOI] [PubMed] [Google Scholar]
- Radloff L.S. (1977) The CES‐D scale. A self‐report depression scale for research in the general population. Applied Psychological Measurement, 1(3), 385–401. [Google Scholar]
- Richardson J.T.E. (2011) Eta squared and partial eta squared as measures of effect size in educational research. Educational Research Review, 6(2), 135–147. [Google Scholar]
- Riumallo‐Herl C., Basu S., Stuckler D., Courtin E., Avendano‐Pabon M. (2014) Job loss and depression during the 2008 Great Recession in the US and Europe. International Journal of Epidemiology, 43(5), 1508–1517. [DOI] [PMC free article] [PubMed] [Google Scholar]
- Siegrist J., Lunau T., Wahrendorf M., Dragano N. (2012) Depressive symptoms and psychosocial stress at work among older employees in three continents. Globalization and Health, 8(27). [DOI] [PMC free article] [PubMed] [Google Scholar]
- StataCorp (2013) Stata Statistical Software: Release 13, College Station, TX: StataCorp LP. [Google Scholar]
- Turvey C.L., Wallace R.B., Herzog R. (1999) A Revised CES‐D measure of depressive symptoms and a DSM‐based measure of major depressive episodes in the elderly. International Psychogeriatrics, 11(02), 139–148. [DOI] [PubMed] [Google Scholar]
- Van de Velde S., Bracke P., Levecque K. (2010a) Gender differences in depression in 23 European countries. Cross‐national variation in the gender gap in depression. Social Science & Medicine, 71(2), 305–313. [DOI] [PubMed] [Google Scholar]
- Van de Velde S., Bracke P., Levecque K., Meuleman B. (2010b) Gender differences in depression in 25 European countries after eliminating measurement bias in the CES‐D 8. Social Science Research, 39(3), 396–404. [Google Scholar]
- Wiggins R.D., Higgs P.F.D., Hyde M., Blane D.B. (2004) Quality of life in the third age: Key predictors of the CASP‐19 measure. Ageing and Society, 24(5), 693–708. [Google Scholar]
- Zamarro G., Meijer E., Fernandes M. (2008) Mental health and cognitive ability. Comparison between SHARE, ELSA and HRS In Börsh‐Supan A., Brugiavini A., Jürges H., Kapteyn A., Mackenbach J.P., Siegrist J., Weber G. (eds) First Results from the Survey of Health, Ageing and Retirement in Europe (2004–2007). Starting the Longitudinal Dimension, pp. 40–48, Mannheim: Mannheim Research Institute for the Economics of Ageing. [Google Scholar]