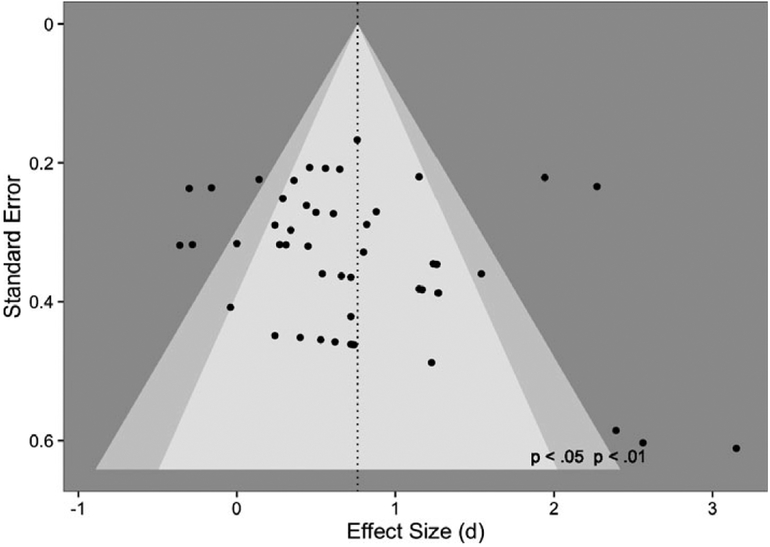
Figure 2.
Funnel plot showing the relationship between standard error and effect size for studies of infant-directed speech (IDS) preference, modified from http://metalab.stanford.edu. Individual dots represent studies. Larger and smaller funnel boundaries show 99% and 95% thresholds, respectively. Dotted line shows the mean effect size from a random-effects meta analytic model.

