

Abstract
Background
Screening for colorectal cancer (CRC) has been successful in decreasing the incidence and mortality from CRC. While new screening tests have become available, their relative impact on CRC outcomes remains unexplored. This study compares the outcomes of various screening strategies on CRC outcomes.
Methods
A Markov model representing the natural history of CRC was built and validated against empiric data from screening trials as well as the Microstimulation Screening Analysis (MISCAN) model. Thirteen screening strategies based on colonoscopy, sigmoidoscopy, computed tomographic colonography, as well as fecal immunochemical, occult blood, and stool DNA testing were compared with no screening. A simulated sample of the US general population ages 50 to 75 years with an average risk of CRC was followed for up to 35 years or until death. Effectiveness was measured by discounted life years gained and the number of CRCs prevented. Discounted costs and cost-effectiveness ratios were calculated. A discount rate of 3% was used in calculations. The study took a societal perspective.
Results
Colonoscopy emerged as the most effective screening strategy with the highest life years gained (0.022 life years) and CRCs prevented (n = 1068) and the lowest total costs ($2861). These values were 0.012 life years gained, 574 CRCs prevented, and a total cost of $3164, respectively, for FOBT; and 0.011 life years gained, 647 CRCs prevented, and a total cost of $4296, respectively, for DNA testing. Improved sensitivity or specificity of a screening test for CRC detection was not sufficient to close the outcomes gap compared with colonoscopy.
Conclusions
Improvement in CRC detection performance is not sufficient to improve screening outcomes. Special attention must be directed to detecting precancerous adenomas.
Introduction
Colorectal cancer (CRC) is the second leading cause of cancer death in the United States, with an estimated incidence of 134,490 new cases and 49,190 deaths in 2016. This represents a decline in incidence and mortality that is primarily attributable to increased screening and removal of precancerous adenomas, and a smaller but measureable contribution from risk factor modification and improved treatments1–3. Screening for CRC can reduce its incidence of colorectal cancer4–7, might result in a stage shift favoring earlier stage at diagnosis8, 9, and has the theoretical benefit of reducing the costs of care.
With rising costs of care for CRC as a result of newer and more expensive drugs and the improved overall survival as a result of these treatments, screening for CRC becomes even more important as the alternative becomes increasingly more expensive. A detailed study of the interactions between downstream societal outcomes of screening and the multitude of strategies available for screening is only possible through modeling.
To explore these dynamics, we evaluated various CRC screening strategies and compared them along different sets of measures of effectiveness, costs, and cost effectiveness. We examined how improved sensitivity and specificity of a screening test for detection of CRC impacts its effectiveness. We also investigated how one could engineer and define a hypothetical screening test that would be competitive to the best among these strategies by exploring the performance characteristics of this hypothetical test for detection of adenomas.
Methods
We used modeling and individual-level simulation (microsimulation) to measure and compare the benefits of screening for CRC in the US population. The study took a societal perspective, and costs and effects were discounted at the standard rate of 3%. The model, assumptions, and analyses conformed to best practices10,11 and to recommendations of the US Panel on Cost-Effectiveness in Health and Medicine12 and the Agency for Healthcare Research and Quality.13 Screening test characteristics are summarized in Table 1,14–27 and a complete list of assumptions and corresponding references is available in the Supplementary Materials (see online supporting information).
Table 1:
Screening test characteristics used in the analysis.
| Test Characteristic | Value (Range) | Varied in Sensitivity Analysis | Source |
|---|---|---|---|
| Test Characteristic | |||
| Sensitivity of FOBT | 0.643 (0.356, 0.86) | No | 14, 15 |
| Sensitivity of FIT | 0.818 (0.478, 0.968) | No | 14, 15 |
| Sensitivity of Colonoscopy | 0.95 (0.92, 0.99) | No | 15–17 |
| Sensitivity of Diagnostic Colonoscopy | 0.95 (0.92, 0.99) | No | 15, 16 |
| Sensitivity of Flex Sig | 0.75 (0.72, 0.85) | No | 15, 18 |
| Sensitivity of DNA | 0.923 (0.83, 0.975) | No | 15, 19, 20 |
| Sensitivity of CT Colonography | 0.922 (0.84, .93) | No | 15, 21, 22 |
| Sensitivity of Test X (Set to match DNA) | 0.923 (0.83, 0.975) | No | |
| Sensitivity of DNA Testing for Adenoma | 0.424 (0.389–0.46) | No | 15, 19, 20 |
| Sensitivity of CT Colonography for Adenoma | 0.8 (0.045–1) | No | 15, 22 |
| Sensitivity of Test X for Adenoma (relative to colonoscopy) | 0.5 (0.5–1) | No | |
| Specificity of FOBT | 0.901 (0.893, 0.908) | No | 14, 15 |
| Specificity of FIT | 0.969 (0.964, 0.974) | No | 14, 15 |
| Specificity of Colonoscopy | 0.9 (0.9, 1) | No | 15, 16 |
| Specificity of Diagnostic Colonoscopy | 0.9 (0.9, 1) | No | 15, 16 |
| Specificity of Flex Sig | 0.92 (0.92, 1) | No | 15, 16, 18, 23 |
| Specificity of DNA | 0.866 (0.859, 0.872) | No | 15, 19, 20 |
| Specificity of CT Colonography | 0.82 (0.796, 0.88) | No | 15, 21, 22 |
| Specificity of Test X (Set to match DNA) | 0.866 (0.859, 0.872) | No | |
| Test Compliance | |||
| Compliance Referent | 1 | ||
| Compliance with FOBT | 0.462 (0.462, 1) | Yes | 24 |
| Compliance with FIT- extrapolated using FOBT | 0.462 (0.462, 1) | Yes | 24 |
| Compliance with FOBT + Flex Sig- extrapolated using Flex Sig | 0.63 (0.63, 1) | Yes | 25 |
| Compliance with FIT + Flex Sig- extrapolated using Flex Sig | 0.63 (0.63, 1) | Yes | 25 |
| Compliance with Colonoscopy- extrapolated using Flex Sig | 0.63 (0.63, 1) | Yes | 25, 26 |
| Compliance with Flex Sig | 0.63 (0.63, 1) | Yes | 25 |
| Compliance with FOBT 2 | 0.597 (0.597, 1) | Yes | 24, 27 |
| Compliance with FIT 2 | 0.597 (0.597, 1) | Yes | 24, 27 |
| Compliance with FOBT 2 + Flex Sig | 0.63 (0.63, 1) | Yes | 25 |
| Compliance with FIT 2 + Flex Sig | 0.63 (0.63, 1) | Yes | 25 |
| Compliance with DNA 1- extrapolated using FOBT | 0.462 (0.462, 1) | Yes | 24 |
| Compliance with DNA 3- extrapolated using FOBT 2 | 0.597 (0.597, 1) | Yes | 24, 27 |
| Compliance with Test X - extrapolated using FOBT | 0.462 (0.462, 1) | Yes | 24 |
| Compliance with Test X 3 - extrapolated using FOBT 2 | 0.597 (0.597, 1) | Yes | 24, 27 |
| Compliance with Test X 5- extrapolated using Flex Sig | 0.63 (0.63, 1) | Yes | 25 |
| Compliance with CT Colonography- extrapolated using Flex Sig | 0.63 (0.63, 1) | Yes | 25 |
Study Design
Thirteen screening strategies (ST 1 through ST 13) were compared with no screening as the referent strategy. Each screening strategy comprised 1 or 2 screening tests that would be performed over prescribed intervals. The following screening strategies were evaluated:
| 1) | ST 1: | Fecal occult blood testing (FOBT) annually |
| 2) | ST 2: | Fecal immunochemical testing (FIT) annually |
| 3) | ST 3: | FOBT annually and flexible sigmoidoscopy (Flex Sig) every 5 years |
| 4) | ST 4: | FIT annually and Flex Sig every 5 years |
| 5) | ST 5: | Colonoscopy every 10 years (3 or 5 years, with adenoma) |
| 6) | ST 6: | Flex Sig every 5 years |
| 7) | ST 7: | FOBT 2 (FOBT every other year) |
| 8) | ST 8: | FIT 2 (FIT every other year) |
| 9) | ST 9: | FOBT 2 and Flex Sig every 5 years |
| 10) | ST 10: | FIT 2 + Flex Sig every 5 years |
| 11) | ST 11: | DNA (stool DNA testing annually) |
| 12) | ST 12: | DNA 2 (stool DNA testing every other year) |
| 13) | ST 13: | Computed tomography (CT) colonography every 10 years |
Events, including screening tests, cancer diagnoses, treatment, and mortality, and the associated costs were recorded. The effectiveness of each screening strategy was measured in life years (LY) and reductions in cancer incidence and mortality. Costs of screening tests were based on Centers for Medicare and Medicaid payments and published material in peer-reviewed articles. A second cost estimate for screening tests that included patient out-of-pocket expenses was also used.28,29 These cost models were designated cost models A and B, respectively, and simulations were run using both models.
Costs of cancer therapy were inclusive of the newer therapeutic agents used as part of standard of care. A Cost Effectiveness Analysis (CEA) was performed and Incremental Cost Effectiveness Ratios (ICERs) for each strategy calculated.
Study Population
The study population was designed to be representative of the US general population in terms of age, sex, and risk for CRC using data from Surveillance, Epidemiology, and End Results (SEER) program.30,31 The incidence of CRC in the non-screened population was modeled using SEER incidence data from 1990 and 1995 (before the presumed impact of screening incidence reduction was reflected in the SEER data) and the incidence reduction attributable to screening was modeled using long-term lower endoscopy data6, 31. Individuals diagnosed with colorectal cancer were staged in a manner representative of stage distribution for screened and non-screened populations8, 9, 31 as appropriate and treatments were offered in keeping with standards of care32. Individual preferences for compliance with screening was modeled using published data for various screening modalities. Mortality, colorectal cancer specific and non-specific, were modeled based on stage specific mortality for colorectal cancer8, and US life tables33.
One hundred thousand individual members of the US population with average risk for colorectal cancer aged 50 to 75, as described above, were simulated and followed for up to 35 years or until the time of death.
CRC Model
A Markov model was built to represent the CRC incidence and its natural history in individual members of the US general population. The performance parameters of the screening tests (ie, sensitivity and specificity), were assumed to be conditionally independent of repeat screening.29 All positive screening tests for all strategies (except colonoscopy) resulted in a “diagnostic” colonoscopy. In the event of a negative diagnostic colonoscopy, 2 distinct possibilities were modeled for future screening:
Upgrading the screening strategy to colonoscopy in a manner consistent with colonoscopy based screening strategy (Base Case)
Resuming the original screening strategy after a period recommended by diagnostic colonoscopy (Alternate Case)
In both cases, simulated individuals were subjected to the CRC risk reduction associated with colonoscopy.31 Stage shift, in the form of a lower probability of distant metastases at the time of diagnosis for the screened population, was modeled using data from the literature.8
The impact of adenomas was modeled by attributing the observed incidence reduction associated with colonoscopy, and sigmoidoscopy to the removal of precancerous adenomas.
All simulations were performed using TreeAge Pro 2015 by TreeAge Software, Inc.
Outcome Measures
Primary and secondary outcome measures were defined as described below.
Effectiveness and Comparative Effectiveness
The primary effectiveness outcome measure for each strategy was defined in terms of discounted life years.
A secondary effectiveness outcome measure was defined as the total number of “prevented” CRCs during simulation as a result of screening.
Costs
Discounted total strategy costs, costs of screening, and costs of cancer care were calculated as cost outcome measures.
Cost Effectiveness
ICERs using discounted, incremental total strategy costs and incremental life years gained (LYG) were used as the cost-effectiveness outcome measure. A willingness to pay of $50,000 per LYG was used as a guide to identify the cost-effective strategies.34,35 If a strategy was not cost-effective, then it was designated as dominated. Absolute dominance (AD) indicates that the next strategy is more effective and less costly, and extended dominance (ED) indicates that the next strategy is more effective and costlier but has a lower ICER.
Sensitivity and Exploratory Analyses
Several one-way sensitivity analyses were performed. DNA testing is associated with a modest adenoma detection sensitivity that was included in the analysis to examine the impact of adenoma detection on effectiveness of the screening strategy19, 23. The effect of increasing compliance with screening under both Base and Alternate cases was explored. A sensitivity analysis assuming similar stage distribution for screened and non-screened populations, rejecting the stage shift assumption, was performed.
To explore the maximal benefits achievable by DNA testing, the sensitivity and specificity of the DNA test were both set at 100%, and simulations were performed.
To define the characteristics of an ideal screening test, we performed a series of 2-way analyses to explore how a hypothetical strategy could approach or outperform the most effective strategy. “Test X” was defined with performance parameters similar to the most effective stool-testing screening strategy. By using colonoscopy as the benchmark, the sensitivity of “Test X” for the detection of precancerous polyps was defined relative to that of colonoscopy with a range from 50% to 100%. A proportionate benefit in terms of incidence reduction in CRCs for the simulated individuals was given to those screened with “Test X.” A sensitivity analysis was performed over this range to determine the point at which “Test X” would dominate the most effective screening strategy by being more effective or rendering it no longer cost effective. Three strategies based on “Test X” were included with screening intervals yearly, every 3 years and every 5 years.
Validation of the Model
The model was validated by comparison of its predictions with empiric data from clinical studies as well as the widely accepted model for CRC, Microstimulation Screening Analysis (MISCAN). Schoen et al36 reported an incidence reduction of 26% (95% confidence interval [CI], 13%–37%) and a mortality reduction of 21% (95% CI, 15%–28%), given a compliance rate of 83%. In this model, when compliance was set at 80%, the percentage of cancer cases prevented (incidence reduction) increased to 27%, which was within the 95% confidence interval of Schoen et al, and the mortality risk was reduced by 38%, which was marginally higher than that reported by Schoen et al.
Given the inevitable difference between a representative sample of the population and the conditions of a clinical trial, there would be differences, but they would be small and could be explained by differences in age, comorbidities, follow-up duration, baseline risk, compliance, and improved cancer survival over the years.
Under near perfect conditions, including enrolling individuals at age 50 years and screening them with a 100% compliance until age 75, MISCAN predicted 230 LYG per 1000 screened individuals, an incidence risk reduction of 51.9% and a mortality reduction of 64.6% for colonoscopy.16,28 These numbers, as predicted by the model, were 137 LYG per 1000 screened individuals, 39% and 46%, respectively. MISCAN investigators in discussing their results pointed out that their model might overestimate the benefits of screening based on the set up of their assumptions.29 A more recent published study reporting simulation results using MISCAN, shows a smaller benefit size for colonoscopy of 151.6 LYG per 1000 screened individuals aged 65 years.7
For further details, please see Supplementary Materials (see online supporting information).
Results
Unless otherwise specified, the results refer to the Base Case using cost model A.
Effectiveness
Colonoscopy emerged as the most effective strategy under the base and alternate cases. CT colonography and flexible sigmoidoscopy were the next 2 most effective strategies, respectively. DNA testing was more effective than FOBT and FIT by a small margin. The difference in effectiveness among strategies was modest with a maximum of 0.022 discounted LYG (1.2 weeks) for colonoscopy versus no screening. Screening was associated with a 5% to 23% relative-risk reduction and a 12% to 34% cancer-specific mortality risk reduction compared with no screening. The highest risk-reduction levels were associated with the colonoscopy strategy. The incidence of CRC was lowest for the colonoscopy strategy, despite performing a colonoscopy for all positive screening tests in the remaining strategies and accruing the resulting incidence reduction after a negative colonoscopy. Including the role of adenoma detection in DNA testing strategies improved their effectiveness by increasing LYG and the number of prevented cancers (Table 2). The results for the alternate case under cost model A are presented in Table 3.
Table 2.
Results under Base Case and Cost Model A. Stage shift effect was included.
| Strategy | Comparative Effectiveness | Costs | Cost Effectiveness | |||||||||||||||
|---|---|---|---|---|---|---|---|---|---|---|---|---|---|---|---|---|---|---|
| Discounted LY | CRC Diagnosed | CRC Prevented | CRC Risk Reduction | CRC Deaths | Cancer Mortality Risk Reduction | Cancer Management | Screening | Total | Incremental Costs | Incremental Effect | ICER | Status (Rank) | ||||||
| No Screening (Referent Strategy) | 15.205 | 4,503 | 0 | 0% | 1,310 | 0% | $ | 3,415 | $ | – | $ | 3,415 | $ | 554 | −0.022 | $ | (−) | AD |
| ST 1: FOBT | 15.215 | 3,944 | 574 | 12% | 1,086 | 17% | $ | 3,078 | $ | 86 | $ | 3,164 | $ | 303 | −0.012 | $ | (−) | AD |
| ST 2: FIT | 15.211 | 4,233 | 279 | 6% | 1,156 | 12% | $ | 3,180 | $ | 123 | $ | 3,303 | $ | 442 | −0.016 | $ | (−) | AD |
| ST 3: FOBT + Flex Sig | 15.217 | 3,863 | 655 | 14% | 1,056 | 19% | $ | 3,012 | $ | 158 | $ | 3,170 | $ | 309 | −0.009 | $ | (−) | AD |
| ST 4: FIT + Flex Sig | 15.214 | 4,135 | 380 | 8% | 1,123 | 14% | $ | 3,106 | $ | 232 | $ | 3,338 | $ | 477 | −0.013 | $ | (−) | AD |
| ST 5: Colonoscopy | 15.227 | 3,462 | 1,068 | 23% | 863 | 34% | $ | 2,335 | $ | 526 | $ | 2,861 | $ | – | 0.000 | $ | 0 | UD (1) |
| ST 6: Flex Sig | 15.221 | 4,014 | 500 | 11% | 1,029 | 21% | $ | 2,875 | $ | 270 | $ | 3,145 | $ | 284 | −0.006 | $ | (−) | AD |
| ST 7: FOBT 2 | 15.218 | 3,977 | 539 | 12% | 1,052 | 20% | $ | 2,979 | $ | 75 | $ | 3,054 | $ | 193 | −0.009 | $ | (−) | AD |
| ST 8: FIT 2 | 15.215 | 4,284 | 222 | 5% | 1,121 | 14% | $ | 3,093 | $ | 93 | $ | 3,186 | $ | 325 | −0.012 | $ | (−) | AD |
| ST 9: FOBT 2 + Flex Sig | 15.219 | 3,915 | 603 | 13% | 1,036 | 21% | $ | 2,949 | $ | 178 | $ | 3,128 | $ | 267 | −0.008 | $ | (−) | AD |
| ST 10: FIT 2 + Flex Sig | 15.217 | 4,176 | 334 | 7% | 1,090 | 17% | $ | 3,026 | $ | 230 | $ | 3,256 | $ | 395 | −0.010 | $ | (−) | AD |
| ST 11: DNA | 15.216 | 3,870 | 647 | 14% | 1,071 | 18% | $ | 3,041 | $ | 1,255 | $ | 4,296 | $ | 1,435 | −0.011 | $ | (−) | AD |
| ST 12: DNA 2 | 15.219 | 3,860 | 656 | 14% | 1,031 | 21% | $ | 2,929 | $ | 1,232 | $ | 4,161 | $ | 1,300 | −0.008 | $ | (−) | AD |
| ST 13: CT Colonography* | 15.225 | 3,594 | 930 | 20% | 922 | 30% | $ | 2,568 | $ | 494 | $ | 3,062 | $ | 201 | −0.001 | $ | (−) | AD |
| ST 11: DNA (Sen=1, Ad Sen=0.424)† | 15.218 | 3,762 | 758 | 16% | 1,034 | 21% | $ | 2,931 | $ | 1,255 | $ | 4,186 | $ | 1,325 | −0.009 | $ | (−) | AD |
| ST 11: DNA (Spe=1, Ad Sen=0.424)‡ | 15.214 | 4,019 | 492 | 11% | 1,099 | 16% | $ | 2,936 | $ | 2,649 | $ | 5,585 | $ | 2,724 | −0.012 | $ | (−) | AD |
| ST 11: DNA (Sen=1, Spe=1, Ad Sen=0.424)§ | 15.214 | 4,019 | 492 | 11% | 1,099 | 16% | $ | 2,936 | $ | 2,649 | $ | 5,585 | $ | 2,724 | −0.012 | $ | (−) | AD |
Comparisons of Effectiveness, Costs, and Cost Effectiveness measures.
LY: Life Years. CRC: Colorectal Cancer. ICER: Incremental Cost Effectiveness Ratio. (−) negative value. AD: Absolute Dominance. UD: Undominated. Ad Sen: Adenoma Sensitivity. Sen: CRC Sensitivity. Spe: CRC Specificity.
CT colonography had a reported sensitivity of 80% for detection of adenomas. Therefore, a proportional CRC risk reduction was given to this strategy.
A sensitivity of 100% for CRC and a sensitivity of 42.4% for detection of adenomas was given to DNA test. Results shown for comparison.
A specificity of 100% for CRC and a sensitivity of 42.4% for detection of adenomas was given to DNA test. Results shown for comparison.
A sensitivity and a specificity of 100% for CRC and a sensitivity of 42.4% for detection of adenomas was given to DNA test. Results shown for comparison.
Table 3.
Results under Base Case and Cost Model B. Stage shift effect was excluded.
| Strategy | Comparative Effectiveness | Costs | Cost Effectiveness | |||||||||||||||
|---|---|---|---|---|---|---|---|---|---|---|---|---|---|---|---|---|---|---|
| Discounted LY | CRC Diagnosed | CRC Prevented | CRC Risk Reduction | CRC Deaths | Cancer Mortality Risk Reduction | Cancer Management | Screening | Total | Incremental Costs | Incremental Effect | ICER | Status (Rank) | ||||||
| No Screening (Referent Strategy) | 15.199 | 4,483 | 0 | 0% | 1,380 | 0% | $ | 3,494 | $ | – | $ | 3,494 | $ | 463 | −0.022 | $ | (−) | AD |
| ST 1: FOBT | 15.209 | 4,093 | 398 | 9% | 1,167 | 15% | $ | 3,258 | $ | 16 | $ | 3,274 | $ | 243 | −0.012 | $ | (−) | AD |
| ST 2: FIT | 15.205 | 4,327 | 161 | 3% | 1,238 | 10% | $ | 3,338 | $ | 100 | $ | 3,438 | $ | 407 | −0.015 | $ | (−) | AD |
| ST 3: FOBT + Flex Sig | 15.210 | 4,017 | 476 | 10% | 1,138 | 18% | $ | 3,217 | $ | 85 | $ | 3,303 | $ | 272 | −0.011 | $ | (−) | AD |
| ST 4: FIT + Flex Sig | 15.207 | 4,231 | 258 | 6% | 1,188 | 14% | $ | 3,256 | $ | 207 | $ | 3,463 | $ | 432 | −0.013 | $ | (−) | AD |
| ST 5: Colonoscopy | 15.221 | 3,453 | 1,052 | 23% | 954 | 31% | $ | 2,504 | $ | 526 | $ | 3,030 | $ | – | 0.000 | $ | 0 | UD (1) |
| ST 6: Flex Sig | 15.210 | 4,055 | 439 | 10% | 1,172 | 15% | $ | 3,104 | $ | 256 | $ | 3,360 | $ | 330 | −0.011 | $ | (−) | AD |
| ST 7: FOBT 2 | 15.210 | 4,132 | 356 | 8% | 1,160 | 16% | $ | 3,234 | $ | 14 | $ | 3,247 | $ | 217 | −0.011 | $ | (−) | AD |
| ST 8: FIT 2 | 15.206 | 4,354 | 131 | 3% | 1,228 | 11% | $ | 3,294 | $ | 74 | $ | 3,368 | $ | 337 | −0.015 | $ | (−) | AD |
| ST 9: FOBT 2 + Flex Sig | 15.210 | 4,098 | 395 | 9% | 1,148 | 17% | $ | 3,213 | $ | 119 | $ | 3,332 | $ | 301 | −0.010 | $ | (−) | AD |
| ST 10: FIT 2 + Flex Sig | 15.208 | 4,256 | 231 | 5% | 1,175 | 15% | $ | 3,233 | $ | 206 | $ | 3,440 | $ | 409 | −0.012 | $ | (−) | AD |
| ST 11: DNA | 15.210 | 4,033 | 460 | 10% | 1,156 | 16% | $ | 3,255 | $ | 1,469 | $ | 4,724 | $ | 1,694 | −0.011 | $ | (−) | AD |
| ST 12: DNA 2 | 15.210 | 4,062 | 426 | 9% | 1,143 | 17% | $ | 3,222 | $ | 1,333 | $ | 4,555 | $ | 1,524 | −0.011 | $ | (−) | AD |
| ST 13: CT Colonography* | 15.217 | 3,622 | 880 | 19% | 1,026 | 26% | $ | 2,766 | $ | 491 | $ | 3,258 | $ | 227 | −0.004 | $ | (−) | AD |
| ST 11: DNA (Sen=1, Ad Sen=0.424)† | 15.212 | 3,832 | 664 | 15% | 1,096 | 21% | $ | 3,082 | $ | 1,469 | $ | 4,551 | $ | 1,521 | −0.009 | $ | (−) | AD |
| ST 11: DNA (Spe=1, Ad Sen=0.424)‡ | 15.209 | 4,004 | 489 | 11% | 1,148 | 17% | $ | 3,032 | $ | 2,654 | $ | 5,686 | $ | 2,656 | −0.012 | $ | (−) | AD |
| ST 11: DNA (Sen=1, Spe=1, Ad Sen=0.424)§ | 15.209 | 4,004 | 489 | 11% | 1,148 | 17% | $ | 3,032 | $ | 2,654 | $ | 5,686 | $ | 2,656 | −0.012 | $ | (−) | AD |
Comparisons of Effectiveness, Costs, and Cost Effectiveness measures.
LY: Life Years. CRC: Colorectal Cancer. ICER: Incremental Cost Effectiveness Ratio. (−) negative value. AD: Absolute Dominance. UD: Undominated. Ad Sen: Adenoma Sensitivity. Sen: CRC Sensitivity. Spe: CRC Specificity.
CT colonography had a reported sensitivity of 80% for detection of adenomas. Therefore, a proportional CRC risk reduction was given to this strategy.
A sensitivity of 100% for CRC and a sensitivity of 42.4% for detection of adenomas was given to DNA test. Results shown for comparison.
A specificity of 100% for CRC and a sensitivity of 42.4% for detection of adenomas was given to DNA test. Results shown for comparison.
A sensitivity and a specificity of 100% for CRC and a sensitivity of 42.4% for detection of adenomas was given to DNA test. Results shown for comparison.
Costs
Many screening strategies had costs that were significantly lower than the costs of treatment for CRC if no screening was offered. By using cost model A or B, DNA testing strategies were significantly more expensive than colonoscopy and no screening.
Cost Effectiveness
Colonoscopy dominated all strategies by being the most effective strategy at the lowest cost. The improvement in effectiveness and reduction in costs as a result of adding adenoma detection role for DNA testing at the reported 42.4% sensitivity failed to improve their cost effectiveness to a competitive level by remaining more costly and less effective than colonoscopy- Figure 1.
Figure 1.
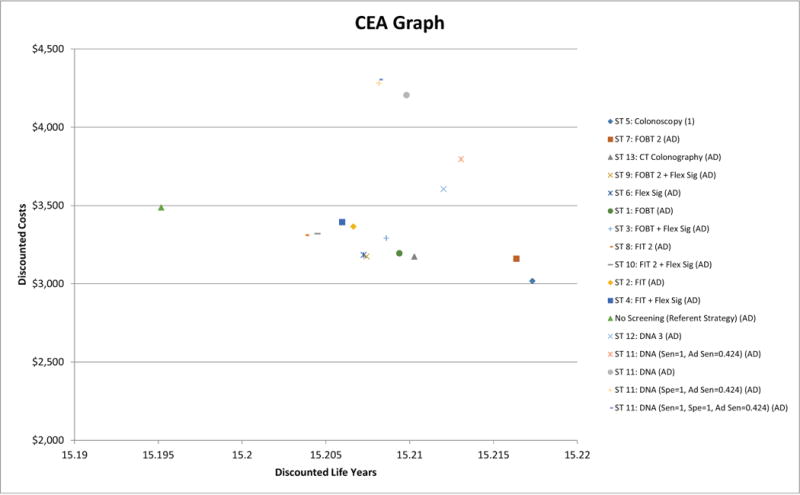
Cost effectiveness graph.
Colonoscopy was the most effective strategy at the lowest cost (right lower corner of the graph) and dominated
all other strategies and was ranked number (1).
AD: Abdolute Dominance.
Ad Sen: Sensisitivity for detection of adenoma. Sen: Sensitivity for detection of invasive cancer. Spe: Specificity for detection of invasive cancer.
The costs of cancer management for DNA testing alone exceeded the total strategy costs for colonoscopy. Unless the cost of DNA testing was reduced to $29 or less per test and adenoma detection is included in its performance, DNA testing remained more expensive, and less effective than colonoscopy.
Tables 2 and 3, which include adenoma detection and enhancing the performance of DNA testing by setting its sensitivity and specificity for detection of cancer at 100%, failed to make DNA stool testing competitive with colonoscopy.
Sensitivity Analyses
With increasing compliance the effectiveness for all strategies increased and total strategy costs decreased. Colonoscopy remained the most effective strategy and had the lowest total strategy costs, dominating other strategies.
The baseline analysis included a 7% absolute risk reduction for a diagnosis of metastatic CRC in individuals undergoing screening. Eliminating this benefit for screening resulted in negligible changes in the effectiveness of strategies under the base and alternate case assumptions and cost models A and B. Colonoscopy continued to dominate other strategies in effectiveness, costs, and cost effectiveness, including DNA testing annually or every other year, when the adenoma-detection sensitivity was included in the analysis.
Exploratory Analysis and Hypothetical Test X
Under the base and alternate assumptions, using cost models A and B, the sensitivity for detecting adenoma of 3 strategies based on “Test X” performed at intervals of 1, 3, and 5 years was set at 50%, 60%, 70%, 80%, 90%, and 100%; and costs for “Test X” were varied between $25 and $500 per test at 7 cost points. The results indicated that, except at an adenoma-detection sensitivity of 100% for “Test X,” despite consistent improvement in its effectiveness, costs remained a problem, preventing it from dominating colonoscopy. At a cost per test of $200 or less, “Test X” dominated colonoscopy in 16 of 24 simulations (66%), and an adenoma-detection sensitivity ≥70% changed this ratio to 16 of 21 simulations (76%) (Table 4).
Table 4.
Exploratory two-way analysis for the adenoma detection sensitivity and cost for Test X. Comparisons made only for colonoscopy strategy as the domiannt strategy in the primary analyses and 3 strategies built on Test X.
| Comparative Effectiveness | Cost Effectiveness | |||||||||||||||||||||||||||||||||||||||
|---|---|---|---|---|---|---|---|---|---|---|---|---|---|---|---|---|---|---|---|---|---|---|---|---|---|---|---|---|---|---|---|---|---|---|---|---|---|---|---|---|
| Test × Costs = $25 | Test × Costs = $75 | Test × Costs = $150 | Test × Costs = $200 | Test × Costs = $300 | Test × Costs = $400 | Test × Costs = $500 | ||||||||||||||||||||||||||||||||||
| Assumptions | Sensitivity for Adenoma Detection | Strategy | LY | CRC Diagnosed | CRC Prevented | Costs | ICER | Status (Rank) | Costs | ICER | Status (Rank) | Costs | ICER | Status (Rank) | Costs | ICER | Status (Rank) | Costs | ICER | Status (Rank) | Costs | ICER | Status (Rank) | Costs | ICER | Status (Rank) | ||||||||||||||
|
Base Case Cost Model A |
50% | ST 5: Colonoscopy | 15.235 | 3,521 | 1,032 | $ | 3,001 | $ | 46,231 | UD (2) | $ | 3,001 | $ | 11,296 | UD (2) | $ | 3,001 | $ | 0 | UD (1) | $ | 3,001 | $ | 0 | UD (1) | $ | 3,001 | $ | 0 | UD (1) | $ | 3,001 | $ | 0 | UD (1) | $ | 3,001 | $ | 0 | UD (1) |
| ST 14: Test X | 15.231 | 3,787 | 760 | $ | 3,037 | $ | (−) | AD | $ | 3,154 | $ | (−) | AD | $ | 3,329 | $ | (−) | AD | $ | 3,445 | $ | (−) | AD | $ | 3,679 | $ | (−) | AD | $ | 3,912 | $ | (−) | AD | $ | 4,150 | $ | (−) | AD | ||
| ST 15: Test X 3 | 15.232 | 3,643 | 903 | $ | 2,880 | $ | 0 | UD (1) | $ | 2,973 | $ | 12,668 | ED | $ | 3,113 | $ | (−) | AD | $ | 3,207 | $ | (−) | AD | $ | 3,393 | $ | (−) | AD | $ | 3,579 | $ | (−) | AD | $ | 3,770 | $ | (−) | AD | ||
| ST 16: Test X 5 | 15.231 | 3,757 | 790 | $ | 2,888 | $ | (−) | AD | $ | 2,957 | $ | 0 | UD (1) | $ | 3,062 | $ | (−) | AD | $ | 3,132 | $ | (−) | AD | $ | 3,272 | $ | (−) | AD | $ | 3,411 | $ | (−) | AD | $ | 3,554 | $ | (−) | AD | ||
| 60% | ST 5: Colonoscopy | 15.218 | 3,492 | 1,068 | $ | 3,149 | $ | 100,657 | UD (2) | $ | 3,149 | $ | 71,782 | UD (2) | $ | 3,149 | $ | 28,469 | UD (2) | $ | 3,149 | $ | 0 | UD (1) | $ | 3,149 | $ | 0 | UD (1) | $ | 3,149 | $ | 0 | UD (1) | $ | 3,149 | $ | 0 | UD (1) | |
| ST 14: Test X | 15.211 | 3,747 | 807 | $ | 3,174 | $ | (−) | AD | $ | 3,291 | $ | (−) | AD | $ | 3,465 | $ | (−) | AD | $ | 3,582 | $ | (−) | AD | $ | 3,815 | $ | (−) | AD | $ | 4,049 | $ | (−) | AD | $ | 4,287 | $ | (−) | AD | ||
| ST 15: Test X 3 | 15.215 | 3,555 | 1,003 | $ | 2,917 | $ | (−) | AD | $ | 3,011 | $ | (−) | AD | $ | 3,150 | $ | (−) | AD | $ | 3,244 | $ | (−) | AD | $ | 3,430 | $ | (−) | AD | $ | 3,617 | $ | (−) | AD | $ | 3,807 | $ | (−) | AD | ||
| ST 16: Test X 5 | 15.215 | 3,647 | 910 | $ | 2,905 | $ | 0 | UD (1) | $ | 2,975 | $ | 0 | UD (1) | $ | 3,080 | $ | 0 | UD (1) | $ | 3,150 | $ | (−) | AD | $ | 3,290 | $ | (−) | AD | $ | 3,430 | $ | (−) | AD | $ | 3,572 | $ | (−) | AD | ||
| 70% | ST 5: Colonoscopy | 15.218 | 3,470 | 1,024 | $ | 2,910 | $ | 105,984 | UD (2) | $ | 2,910 | $ | 73,999 | UD (2) | $ | 2,910 | $ | 26,021 | UD (2) | $ | 2,910 | $ | 0 | UD (1) | $ | 2,910 | $ | 0 | UD (1) | $ | 2,910 | $ | 0 | UD (1) | $ | 2,910 | $ | 0 | UD (1) | |
| ST 14: Test X | 15.211 | 3,680 | 801 | $ | 2,970 | $ | (−) | AD | $ | 3,086 | $ | (−) | AD | $ | 3,260 | $ | (−) | AD | $ | 3,376 | $ | (−) | AD | $ | 3,608 | $ | (−) | AD | $ | 3,840 | $ | (−) | AD | $ | 4,072 | $ | (−) | AD | ||
| ST 15: Test X 3 | 15.216 | 3,461 | 1,024 | $ | 2,703 | $ | (−) | AD | $ | 2,796 | $ | (−) | AD | $ | 2,936 | $ | (−) | AD | $ | 3,029 | $ | (−) | AD | $ | 3,215 | $ | (−) | AD | $ | 3,401 | $ | (−) | AD | $ | 3,587 | $ | (−) | AD | ||
| ST 16: Test X 5 | 15.216 | 3,547 | 942 | $ | 2,679 | $ | 0 | UD (1) | $ | 2,749 | $ | 0 | UD (1) | $ | 2,853 | $ | 0 | UD (1) | $ | 2,923 | $ | (−) | AD | $ | 3,063 | $ | (−) | AD | $ | 3,202 | $ | (−) | AD | $ | 3,342 | $ | (−) | AD | ||
| 80% | ST 5: Colonoscopy | 15.199 | 3,576 | 1,027 | $ | 3,073 | $ | 477,084 | UD (3) | $ | 3,073 | $ | 353,451 | UD (2) | $ | 3,073 | $ | 202,133 | UD (2) | $ | 3,073 | $ | 101,254 | UD (2) | $ | 3,073 | $ | 0 | UD (1) | $ | 3,073 | $ | 0 | UD (1) | $ | 3,073 | $ | 0 | UD (1) | |
| ST 14: Test X | 15.192 | 3,803 | 788 | $ | 3,162 | $ | (−) | AD | $ | 3,279 | $ | (−) | AD | $ | 3,454 | $ | (−) | AD | $ | 3,571 | $ | (−) | AD | $ | 3,804 | $ | (−) | AD | $ | 4,037 | $ | (−) | AD | $ | 4,270 | $ | (−) | AD | ||
| ST 15: Test X 3 | 15.199 | 3,506 | 1,093 | $ | 2,786 | $ | 302,875 | UD (2) | $ | 2,880 | $ | 564,770 | ED | $ | 3,020 | $ | 957,615 | ED | $ | 3,114 | $ | (−) | AD | $ | 3,300 | $ | (−) | AD | $ | 3,487 | $ | (−) | AD | $ | 3,674 | $ | (−) | AD | ||
| ST 16: Test X 5 | 15.198 | 3,578 | 1,023 | $ | 2,759 | $ | 0 | UD (1) | $ | 2,829 | $ | 0 | UD (1) | $ | 2,934 | $ | 0 | UD (1) | $ | 3,003 | $ | 0 | UD (1) | $ | 3,143 | $ | (−) | AD | $ | 3,282 | $ | (−) | AD | $ | 3,422 | $ | (−) | AD | ||
| 90% | ST 5: Colonoscopy | 15.225 | 3,591 | 1,007 | $ | 3,057 | $ | (−) | AD | $ | 3,057 | $ | (−) | AD | $ | 3,057 | $ | (−) | AD | $ | 3,057 | $ | (−) | AD | $ | 3,057 | $ | (−) | AD | $ | 3,057 | $ | 0 | UD (1) | $ | 3,057 | $ | 0 | UD (1) | |
| ST 14: Test X | 15.222 | 3,742 | 852 | $ | 2,940 | $ | (−) | AD | $ | 3,056 | $ | (−) | AD | $ | 3,230 | $ | (−) | AD | $ | 3,346 | $ | (−) | AD | $ | 3,578 | $ | (−) | AD | $ | 3,810 | $ | (−) | AD | $ | 4,042 | $ | (−) | AD | ||
| ST 15: Test X 3 | 15.225 | 3,427 | 1,169 | $ | 2,659 | $ | (−) | AD | $ | 2,752 | $ | (−) | AD | $ | 2,892 | $ | (−) | AD | $ | 2,986 | $ | (−) | AD | $ | 3,172 | $ | (−) | AD | $ | 3,359 | $ | (−) | AD | $ | 3,545 | $ | (−) | AD | ||
| ST 16: Test X 5 | 15.225 | 3,490 | 1,110 | $ | 2,628 | $ | 0 | UD (1) | $ | 2,698 | $ | 0 | UD (1) | $ | 2,802 | $ | 0 | UD (1) | $ | 2,872 | $ | 0 | UD (1) | $ | 3,012 | $ | 0 | UD (1) | $ | 3,152 | $ | 303,965 | UD (2) | $ | 3,291 | $ | 751,893 | UD (2) | ||
| 100% | ST 5: Colonoscopy | 15.198 | 3,536 | 1,030 | $ | 3,032 | $ | (−) | AD | $ | 3,032 | $ | (−) | AD | $ | 3,032 | $ | (−) | AD | $ | 3,032 | $ | (−) | AD | $ | 3,032 | $ | (−) | AD | $ | 3,032 | $ | (−) | AD | $ | 3,032 | $ | 0 | UD (1) | |
| ST 14: Test X | 15.193 | 3,681 | 890 | $ | 3,004 | $ | (−) | AD | $ | 3,120 | $ | (−) | AD | $ | 3,295 | $ | (−) | AD | $ | 3,412 | $ | (−) | AD | $ | 3,645 | $ | (−) | AD | $ | 3,878 | $ | (−) | AD | $ | 4,112 | $ | (−) | AD | ||
| ST 15: Test X 3 | 15.201 | 3,278 | 1,293 | $ | 2,571 | $ | (−) | AD | $ | 2,665 | $ | (−) | AD | $ | 2,804 | $ | (−) | AD | $ | 2,897 | $ | (−) | AD | $ | 3,084 | $ | (−) | AD | $ | 3,270 | $ | (−) | AD | $ | 3,456 | $ | (−) | AD | ||
| ST 16: Test X 5 | 15.201 | 3,333 | 1,238 | $ | 2,503 | $ | 0 | UD (1) | $ | 2,572 | $ | 0 | UD (1) | $ | 2,677 | $ | 0 | UD (1) | $ | 2,747 | $ | 0 | UD (1) | $ | 2,886 | $ | 0 | UD (1) | $ | 3,026 | $ | 0 | UD (1) | $ | 3,165 | $ | 36,504 | UD (2) | ||
|
Alternate
Case Cost Model A |
50% | ST 5: Colonoscopy | 15.199 | 3,503 | 989 | $ | 3,021 | $ | 94,226 | UD (2) | $ | 3,021 | $ | 48,963 | UD (2) | $ | 3,021 | $ | 0 | UD (1) | $ | 3,021 | $ | 0 | UD (1) | $ | 3,021 | $ | 0 | UD (1) | $ | 3,021 | $ | 0 | UD (1) | $ | 3,021 | $ | 0 | UD (1) |
| ST 14: Test X | 15.191 | 3,835 | 644 | $ | 3,103 | $ | (−) | AD | $ | 3,249 | $ | (−) | AD | $ | 3,468 | $ | (−) | AD | $ | 3,614 | $ | (−) | AD | $ | 3,905 | $ | (−) | AD | $ | 4,197 | $ | (−) | AD | $ | 4,494 | $ | (−) | AD | ||
| ST 15: Test X 3 | 15.196 | 3,674 | 805 | $ | 2,805 | $ | 0 | UD (1) | $ | 2,909 | $ | 0 | UD (1) | $ | 3,064 | $ | (−) | AD | $ | 3,168 | $ | (−) | AD | $ | 3,376 | $ | (−) | AD | $ | 3,584 | $ | (−) | AD | $ | 3,796 | $ | (−) | AD | ||
| ST 16: Test X 5 | 15.194 | 3,773 | 706 | $ | 2,861 | $ | (−) | AD | $ | 2,936 | $ | (−) | AD | $ | 3,048 | $ | (−) | AD | $ | 3,123 | $ | (−) | AD | $ | 3,273 | $ | (−) | AD | $ | 3,423 | $ | (−) | AD | $ | 3,576 | $ | (−) | AD | ||
| 60% | ST 5: Colonoscopy | 15.209 | 3,529 | 1,041 | $ | 3,016 | $ | 41,882 | UD (2) | $ | 3,016 | $ | 18,181 | UD (2) | $ | 3,016 | $ | 0 | UD (1) | $ | 3,016 | $ | 0 | UD (1) | $ | 3,016 | $ | 0 | UD (1) | $ | 3,016 | $ | 0 | UD (1) | $ | 3,016 | $ | 0 | UD (1) | |
| ST 14: Test X | 15.200 | 3,837 | 729 | $ | 3,158 | $ | (−) | AD | $ | 3,303 | $ | (−) | AD | $ | 3,521 | $ | (−) | AD | $ | 3,666 | $ | (−) | AD | $ | 3,957 | $ | (−) | AD | $ | 4,248 | $ | (−) | AD | $ | 4,544 | $ | (−) | AD | ||
| ST 15: Test X 3 | 15.205 | 3,649 | 923 | $ | 2,862 | $ | 0 | UD (1) | $ | 2,966 | $ | 47,627 | ED | $ | 3,122 | $ | (−) | AD | $ | 3,226 | $ | (−) | AD | $ | 3,434 | $ | (−) | AD | $ | 3,642 | $ | (−) | AD | $ | 3,854 | $ | (−) | AD | ||
| ST 16: Test X 5 | 15.204 | 3,744 | 826 | $ | 2,864 | $ | (−) | AD | $ | 2,939 | $ | 0 | UD (1) | $ | 3,051 | $ | (−) | AD | $ | 3,126 | $ | (−) | AD | $ | 3,276 | $ | (−) | AD | $ | 3,426 | $ | (−) | AD | $ | 3,579 | $ | (−) | AD | ||
| 70% | ST 5: Colonoscopy | 15.211 | 3,543 | 1,020 | $ | 2,978 | $ | 62,598 | UD (3) | $ | 2,978 | $ | 43,216 | UD (2) | $ | 2,978 | $ | 14,768 | UD (2) | $ | 2,978 | $ | 0 | UD (1) | $ | 2,978 | $ | 0 | UD (1) | $ | 2,978 | $ | 0 | UD (1) | $ | 2,978 | $ | 0 | UD (1) | |
| ST 14: Test X | 15.205 | 3,758 | 800 | $ | 2,954 | $ | (−) | AD | $ | 3,099 | $ | (−) | AD | $ | 3,318 | $ | (−) | AD | $ | 3,463 | $ | (−) | AD | $ | 3,754 | $ | (−) | AD | $ | 4,046 | $ | (−) | AD | $ | 4,343 | $ | (−) | AD | ||
| ST 15: Test X 3 | 15.207 | 3,558 | 1,003 | $ | 2,742 | $ | 54,077 | UD (2) | $ | 2,846 | $ | 203,631 | ED | $ | 3,002 | $ | (−) | AD | $ | 3,107 | $ | (−) | AD | $ | 3,315 | $ | (−) | AD | $ | 3,523 | $ | (−) | AD | $ | 3,736 | $ | (−) | AD | ||
| ST 16: Test X 5 | 15.207 | 3,641 | 922 | $ | 2,732 | $ | 0 | UD (1) | $ | 2,807 | $ | 0 | UD (1) | $ | 2,920 | $ | 0 | UD (1) | $ | 2,995 | $ | (−) | AD | $ | 3,145 | $ | (−) | AD | $ | 3,295 | $ | (−) | AD | $ | 3,449 | $ | (−) | AD | ||
| 80% | ST 5: Colonoscopy | 15.200 | 3,491 | 1,046 | $ | 2,972 | $ | 132,699 | UD (2) | $ | 2,972 | $ | 96,378 | UD (2) | $ | 2,972 | $ | 52,126 | UD (2) | $ | 2,972 | $ | 22,624 | UD (2) | $ | 2,972 | $ | 0 | UD (1) | $ | 2,972 | $ | 0 | UD (1) | $ | 2,972 | $ | 0 | UD (1) | |
| ST 14: Test X | 15.193 | 3,678 | 858 | $ | 2,976 | $ | (−) | AD | $ | 3,121 | $ | (−) | AD | $ | 3,340 | $ | (−) | AD | $ | 3,485 | $ | (−) | AD | $ | 3,777 | $ | (−) | AD | $ | 4,068 | $ | (−) | AD | $ | 4,365 | $ | (−) | AD | ||
| ST 15: Test X 3 | 15.197 | 3,402 | 1,136 | $ | 2,641 | $ | 0 | UD (1) | $ | 2,745 | $ | 354,029 | ED | $ | 2,901 | $ | 1,185,813 | ED | $ | 3,005 | $ | (−) | AD | $ | 3,213 | $ | (−) | AD | $ | 3,421 | $ | (−) | AD | $ | 3,634 | $ | (−) | AD | ||
| ST 16: Test X 5 | 15.197 | 3,486 | 1,057 | $ | 2,651 | $ | (−) | AD | $ | 2,726 | $ | 0 | UD (1) | $ | 2,839 | $ | 0 | UD (1) | $ | 2,914 | $ | 0 | UD (1) | $ | 3,065 | $ | (−) | AD | $ | 3,215 | $ | (−) | AD | $ | 3,368 | $ | (−) | AD | ||
| 90% | ST 5: Colonoscopy | 15.202 | 3,490 | 1,053 | $ | 3,025 | $ | (−) | AD | $ | 3,025 | $ | (−) | AD | $ | 3,025 | $ | (−) | AD | $ | 3,025 | $ | (−) | AD | $ | 3,025 | $ | (−) | AD | $ | 3,025 | $ | 0 | UD (1) | $ | 3,025 | $ | 0 | UD (1) | |
| ST 14: Test X | 15.195 | 3,626 | 916 | $ | 2,982 | $ | (−) | AD | $ | 3,129 | $ | (−) | AD | $ | 3,349 | $ | (−) | AD | $ | 3,495 | $ | (−) | AD | $ | 3,788 | $ | (−) | AD | $ | 4,081 | $ | (−) | AD | $ | 4,380 | $ | (−) | AD | ||
| ST 15: Test X 3 | 15.203 | 3,302 | 1,242 | $ | 2,557 | $ | 9,385 | UD (2) | $ | 2,661 | $ | 36,935 | UD (2) | $ | 2,817 | $ | 78,261 | UD (2) | $ | 2,922 | $ | 105,812 | UD (2) | $ | 3,130 | $ | 160,914 | UD (2) | $ | 3,339 | $ | 294,357 | UD (2) | $ | 3,551 | $ | 493,876 | UD (2) | ||
| ST 16: Test X 5 | 15.202 | 3,381 | 1,163 | $ | 2,547 | $ | 0 | UD (1) | $ | 2,622 | $ | 0 | UD (1) | $ | 2,735 | $ | 0 | UD (1) | $ | 2,810 | $ | 0 | UD (1) | $ | 2,961 | $ | 0 | UD (1) | $ | 3,111 | $ | 7,487,781 | ED | $ | 3,264 | $ 20,846,524 | ED | |||
| 100% | ST 5: Colonoscopy | 15.207 | 3,477 | 1,060 | $ | 3,053 | $ | (−) | AD | $ | 3,053 | $ | (−) | AD | $ | 3,053 | $ | (−) | AD | $ | 3,053 | $ | (−) | AD | $ | 3,053 | $ | (−) | AD | $ | 3,053 | $ | (−) | AD | $ | 3,053 | $ | 0 | UD (1) | |
| ST 14: Test X | 15.206 | 3,527 | 1,005 | $ | 2,877 | $ | (−) | AD | $ | 3,023 | $ | (−) | AD | $ | 3,242 | $ | (−) | AD | $ | 3,387 | $ | (−) | AD | $ | 3,679 | $ | (−) | AD | $ | 3,971 | $ | (−) | AD | $ | 4,268 | $ | (−) | AD | ||
| ST 15: Test X 3 | 15.210 | 3,149 | 1,393 | $ | 2,498 | $ | (−) | AD | $ | 2,602 | $ | (−) | AD | $ | 2,758 | $ | (−) | AD | $ | 2,862 | $ | (−) | AD | $ | 3,070 | $ | (−) | AD | $ | 3,278 | $ | (−) | AD | $ | 3,490 | $ | (−) | AD | ||
| ST 16: Test X 5 | 15.212 | 3,235 | 1,309 | $ | 2,422 | $ | 0 | UD (1) | $ | 2,497 | $ | 0 | UD (1) | $ | 2,609 | $ | 0 | UD (1) | $ | 2,684 | $ | 0 | UD (1) | $ | 2,834 | $ | 0 | UD (1) | $ | 2,983 | $ | 0 | UD (1) | $ | 3,136 | $ | 17,602 | UD (2) | ||
|
Base Case Cost Model B |
50% | ST 5: Colonoscopy | 15.186 | 3,492 | 1,028 | $ | 3,923 | $ | 80,809 | UD (3) | $ | 3,923 | $ | 62,370 | UD (2) | $ | 3,923 | $ | 38,977 | UD (2) | $ | 3,923 | $ | 23,382 | UD (2) | $ | 3,923 | $ | 0 | UD (1) | $ | 3,923 | $ | 0 | UD (1) | $ | 3,923 | $ | 0 | UD (1) |
| ST 14: Test X | 15.178 | 3,784 | 726 | $ | 3,986 | $ | (−) | AD | $ | 4,103 | $ | (−) | AD | $ | 4,277 | $ | (−) | AD | $ | 4,394 | $ | (−) | AD | $ | 4,627 | $ | (−) | AD | $ | 4,860 | $ | (−) | AD | $ | 5,098 | $ | (−) | AD | ||
| ST 15: Test X 3 | 15.183 | 3,620 | 888 | $ | 3,640 | $ | 67,867 | UD (2) | $ | 3,734 | $ | 91,940 | ED | $ | 3,874 | $ | 128,050 | ED | $ | 3,968 | $ | (−) | AD | $ | 4,155 | $ | (−) | AD | $ | 4,342 | $ | (−) | AD | $ | 4,533 | $ | (−) | AD | ||
| ST 16: Test X 5 | 15.182 | 3,736 | 771 | $ | 3,573 | $ | 0 | UD (1) | $ | 3,643 | $ | 0 | UD (1) | $ | 3,748 | $ | 0 | UD (1) | $ | 3,818 | $ | 0 | UD (1) | $ | 3,958 | $ | (−) | AD | $ | 4,097 | $ | (−) | AD | $ | 4,240 | $ | (−) | AD | ||
| 60% | ST 5: Colonoscopy | 15.216 | 3,498 | 1,023 | $ | 3,883 | $ | 86,563 | UD (2) | $ | 3,883 | $ | 69,381 | UD (2) | $ | 3,883 | $ | 43,609 | UD (2) | $ | 3,883 | $ | 26,427 | UD (2) | $ | 3,883 | $ | 0 | UD (1) | $ | 3,883 | $ | 0 | UD (1) | $ | 3,883 | $ | 0 | UD (1) | |
| ST 14: Test X | 15.210 | 3,717 | 799 | $ | 3,827 | $ | (−) | AD | $ | 3,944 | $ | (−) | AD | $ | 4,120 | $ | (−) | AD | $ | 4,237 | $ | (−) | AD | $ | 4,471 | $ | (−) | AD | $ | 4,705 | $ | (−) | AD | $ | 4,944 | $ | (−) | AD | ||
| ST 15: Test X 3 | 15.211 | 3,552 | 967 | $ | 3,552 | $ | (−) | AD | $ | 3,645 | $ | (−) | AD | $ | 3,785 | $ | (−) | AD | $ | 3,878 | $ | (−) | AD | $ | 4,064 | $ | (−) | AD | $ | 4,251 | $ | (−) | AD | $ | 4,441 | $ | (−) | AD | ||
| ST 16: Test X 5 | 15.212 | 3,654 | 868 | $ | 3,531 | $ | 0 | UD (1) | $ | 3,601 | $ | 0 | UD (1) | $ | 3,706 | $ | 0 | UD (1) | $ | 3,776 | $ | 0 | UD (1) | $ | 3,916 | $ | (−) | AD | $ | 4,056 | $ | (−) | AD | $ | 4,198 | $ | (−) | AD | ||
| 70% | ST 5: Colonoscopy | 15.200 | 3,598 | 994 | $ | 3,950 | $ | 235,646 | UD (3) | $ | 3,950 | $ | 181,858 | UD (3) | $ | 3,950 | $ | 120,075 | UD (2) | $ | 3,950 | $ | 91,763 | UD (2) | $ | 3,950 | $ | 35,138 | UD (2) | $ | 3,950 | $ | 0 | UD (1) | $ | 3,950 | $ | 0 | UD (1) | |
| ST 14: Test X | 15.194 | 3,801 | 782 | $ | 3,845 | $ | (−) | AD | $ | 3,961 | $ | (−) | AD | $ | 4,136 | $ | (−) | AD | $ | 4,253 | $ | (−) | AD | $ | 4,487 | $ | (−) | AD | $ | 4,720 | $ | (−) | AD | $ | 4,958 | $ | (−) | AD | ||
| ST 15: Test X 3 | 15.198 | 3,595 | 994 | $ | 3,542 | $ | 85,569 | UD (2) | $ | 3,635 | $ | 117,141 | UD (2) | $ | 3,774 | $ | 164,499 | ED | $ | 3,868 | $ | 196,071 | ED | $ | 4,054 | $ | (−) | AD | $ | 4,240 | $ | (−) | AD | $ | 4,430 | $ | (−) | AD | ||
| ST 16: Test X 5 | 15.197 | 3,673 | 917 | $ | 3,479 | $ | 0 | UD (1) | $ | 3,549 | $ | 0 | UD (1) | $ | 3,653 | $ | 0 | UD (1) | $ | 3,723 | $ | 0 | UD (1) | $ | 3,863 | $ | 0 | UD (1) | $ | 4,003 | $ | (−) | AD | $ | 4,145 | $ | (−) | AD | ||
| 80% | ST 5: Colonoscopy | 15.208 | 3,514 | 1,052 | $ | 4,005 | $ | 1,946,310 | UD (2) | $ | 4,005 | $ | 1,717,452 | UD (2) | $ | 4,005 | $ | 1,374,166 | UD (2) | $ | 4,005 | $ | 1,145,309 | UD (2) | $ | 4,005 | $ | 687,595 | UD (2) | $ | 4,005 | $ | 229,881 | UD (2) | $ | 4,005 | $ | 0 | UD (1) | |
| ST 14: Test X | 15.200 | 3,736 | 817 | $ | 3,996 | $ | (−) | AD | $ | 4,112 | $ | (−) | AD | $ | 4,286 | $ | (−) | AD | $ | 4,402 | $ | (−) | AD | $ | 4,633 | $ | (−) | AD | $ | 4,865 | $ | (−) | AD | $ | 5,102 | $ | (−) | AD | ||
| ST 15: Test X 3 | 15.206 | 3,430 | 1,135 | $ | 3,532 | $ | (−) | AD | $ | 3,625 | $ | (−) | AD | $ | 3,764 | $ | (−) | AD | $ | 3,857 | $ | (−) | AD | $ | 4,043 | $ | (−) | AD | $ | 4,230 | $ | (−) | AD | $ | 4,419 | $ | (−) | AD | ||
| ST 16: Test X 5 | 15.207 | 3,472 | 1,093 | $ | 3,412 | $ | 0 | UD (1) | $ | 3,482 | $ | 0 | UD (1) | $ | 3,586 | $ | 0 | UD (1) | $ | 3,656 | $ | 0 | UD (1) | $ | 3,795 | $ | 0 | UD (1) | $ | 3,935 | $ | 0 | UD (1) | $ | 4,077 | $ | (−) | AD | ||
| 90% | ST 5: Colonoscopy | 15.197 | 3,540 | 1,031 | $ | 4,039 | $ | (−) | AD | $ | 4,039 | $ | (−) | AD | $ | 4,039 | $ | (−) | AD | $ | 4,039 | $ | (−) | AD | $ | 4,039 | $ | (−) | AD | $ | 4,039 | $ | (−) | AD | $ | 4,039 | $ | (−) | AD | |
| ST 14: Test X | 15.195 | 3,701 | 866 | $ | 3,818 | $ | (−) | AD | $ | 3,935 | $ | (−) | AD | $ | 4,110 | $ | (−) | AD | $ | 4,227 | $ | (−) | AD | $ | 4,461 | $ | (−) | AD | $ | 4,694 | $ | (−) | AD | $ | 4,933 | $ | (−) | AD | ||
| ST 15: Test X 3 | 15.198 | 3,360 | 1,212 | $ | 3,407 | $ | (−) | AD | $ | 3,500 | $ | (−) | AD | $ | 3,641 | $ | (−) | AD | $ | 3,734 | $ | (−) | AD | $ | 3,921 | $ | (−) | AD | $ | 4,108 | $ | (−) | AD | $ | 4,299 | $ | (−) | AD | ||
| ST 16: Test X 5 | 15.200 | 3,418 | 1,153 | $ | 3,310 | $ | 0 | UD (1) | $ | 3,380 | $ | 0 | UD (1) | $ | 3,485 | $ | 0 | UD (1) | $ | 3,555 | $ | 0 | UD (1) | $ | 3,695 | $ | 0 | UD (1) | $ | 3,835 | $ | 0 | UD (1) | $ | 3,978 | $ | 0 | UD (1) | ||
| 100% | ST 5: Colonoscopy | 15.206 | 3,542 | 1,038 | $ | 4,138 | $ | (−) | AD | $ | 4,138 | $ | (−) | AD | $ | 4,138 | $ | (−) | AD | $ | 4,138 | $ | (−) | AD | $ | 4,138 | $ | (−) | AD | $ | 4,138 | $ | (−) | AD | $ | 4,138 | $ | (−) | AD | |
| ST 14: Test X | 15.201 | 3,643 | 932 | $ | 3,973 | $ | (−) | AD | $ | 4,090 | $ | (−) | AD | $ | 4,266 | $ | (−) | AD | $ | 4,383 | $ | (−) | AD | $ | 4,618 | $ | (−) | AD | $ | 4,853 | $ | (−) | AD | $ | 5,092 | $ | (−) | AD | ||
| ST 15: Test X 3 | 15.207 | 3,278 | 1,308 | $ | 3,392 | $ | (−) | AD | $ | 3,486 | $ | (−) | AD | $ | 3,626 | $ | (−) | AD | $ | 3,720 | $ | (−) | AD | $ | 3,908 | $ | (−) | AD | $ | 4,095 | $ | (−) | AD | $ | 4,287 | $ | (−) | AD | ||
| ST 16: Test X 5 | 15.209 | 3,346 | 1,239 | $ | 3,337 | $ | 0 | UD (1) | $ | 3,407 | $ | 0 | UD (1) | $ | 3,512 | $ | 0 | UD (1) | $ | 3,582 | $ | 0 | UD (1) | $ | 3,722 | $ | 0 | UD (1) | $ | 3,862 | $ | 0 | UD (1) | $ | 4,005 | $ | 0 | UD (1) | ||
|
Alternate
Case Cost Model B |
50% | ST 5: Colonoscopy | 15.228 | 3,527 | 1,068 | $ | 3,910 | $ | 48,143 | UD (2) | $ | 3,910 | $ | 34,571 | UD (2) | $ | 3,910 | $ | 14,212 | UD (2) | $ | 3,910 | $ | 639 | UD (2) | $ | 3,910 | $ | 0 | UD (1) | $ | 3,910 | $ | 0 | UD (1) | $ | 3,910 | $ | 0 | UD (1) |
| ST 14: Test X | 15.217 | 3,832 | 748 | $ | 4,037 | $ | (−) | AD | $ | 4,184 | $ | (−) | AD | $ | 4,404 | $ | (−) | AD | $ | 4,551 | $ | (−) | AD | $ | 4,844 | $ | (−) | AD | $ | 5,138 | $ | (−) | AD | $ | 5,437 | $ | (−) | AD | ||
| ST 15: Test X 3 | 15.222 | 3,733 | 856 | $ | 3,695 | $ | (−) | AD | $ | 3,799 | $ | (−) | AD | $ | 3,956 | $ | (−) | AD | $ | 4,061 | $ | (−) | AD | $ | 4,270 | $ | (−) | AD | $ | 4,479 | $ | (−) | AD | $ | 4,692 | $ | (−) | AD | ||
| ST 16: Test X 5 | 15.222 | 3,840 | 748 | $ | 3,643 | $ | 0 | UD (1) | $ | 3,719 | $ | 0 | UD (1) | $ | 3,832 | $ | 0 | UD (1) | $ | 3,907 | $ | 0 | UD (1) | $ | 4,057 | $ | (−) | AD | $ | 4,208 | $ | (−) | AD | $ | 4,362 | $ | (−) | AD | ||
| 60% | ST 5: Colonoscopy | 15.219 | 3,477 | 1,050 | $ | 3,853 | $ | 68,354 | UD (2) | $ | 3,853 | $ | 49,092 | UD (3) | $ | 3,853 | $ | 16,246 | UD (2) | $ | 3,853 | $ | 16,246 | UD (2) | $ | 3,853 | $ | 0 | UD (1) | $ | 3,853 | $ | 0 | UD (1) | $ | 3,853 | $ | 0 | UD (1) | |
| ST 14: Test X | 15.211 | 3,755 | 762 | $ | 3,788 | $ | (−) | AD | $ | 3,935 | $ | (−) | AD | $ | 4,300 | $ | (−) | AD | $ | 4,300 | $ | (−) | AD | $ | 4,592 | $ | (−) | AD | $ | 4,885 | $ | (−) | AD | $ | 5,183 | $ | (−) | AD | ||
| ST 15: Test X 3 | 15.214 | 3,608 | 914 | $ | 3,484 | $ | 0 | UD (1) | $ | 3,588 | $ | 33,220 | UD (2) | $ | 3,848 | $ | 155,167 | ED | $ | 3,848 | $ | 155,167 | ED | $ | 4,056 | $ | (−) | AD | $ | 4,264 | $ | (−) | AD | $ | 4,477 | $ | (−) | AD | ||
| ST 16: Test X 5 | 15.213 | 3,689 | 835 | $ | 3,494 | $ | (−) | AD | $ | 3,569 | $ | 0 | UD (1) | $ | 3,756 | $ | 0 | UD (1) | $ | 3,756 | $ | 0 | UD (1) | $ | 3,906 | $ | (−) | AD | $ | 4,056 | $ | (−) | AD | $ | 4,209 | $ | (−) | AD | ||
| 70% | ST 5: Colonoscopy | 15.205 | 3,590 | 959 | $ | 4,005 | $ | 232,391 | UD (3) | $ | 4,005 | $ | 187,455 | UD (2) | $ | 4,005 | $ | 140,232 | UD (2) | $ | 4,005 | $ | 108,751 | UD (2) | $ | 4,005 | $ | 45,788 | UD (2) | $ | 4,005 | $ | 0 | UD (1) | $ | 4,005 | $ | 0 | UD (1) | |
| ST 14: Test X | 15.198 | 3,774 | 767 | $ | 3,858 | $ | (−) | AD | $ | 4,005 | $ | (−) | AD | $ | 4,225 | $ | (−) | AD | $ | 4,372 | $ | (−) | AD | $ | 4,667 | $ | (−) | AD | $ | 4,961 | $ | (−) | AD | $ | 5,261 | $ | (−) | AD | ||
| ST 15: Test X 3 | 15.203 | 3,569 | 977 | $ | 3,572 | $ | 171,317 | UD (2) | $ | 3,677 | $ | 226,863 | ED | $ | 3,834 | $ | 310,182 | ED | $ | 3,938 | $ | 365,728 | ED | $ | 4,147 | $ | (−) | AD | $ | 4,356 | $ | (−) | AD | $ | 4,569 | $ | (−) | AD | ||
| ST 16: Test X 5 | 15.203 | 3,661 | 884 | $ | 3,482 | $ | 0 | UD (1) | $ | 3,557 | $ | 0 | UD (1) | $ | 3,670 | $ | 0 | UD (1) | $ | 3,746 | $ | 0 | UD (1) | $ | 3,896 | $ | 0 | UD (1) | $ | 4,047 | $ | (−) | AD | $ | 4,200 | $ | (−) | AD | ||
| 80% | ST 5: Colonoscopy | 15.236 | 3,573 | 1,025 | $ | 4,089 | $ | (−) | AD | $ | 4,089 | $ | (−) | AD | $ | 4,089 | $ | (−) | AD | $ | 4,089 | $ | (−) | AD | $ | 4,089 | $ | (−) | AD | $ | 4,089 | $ | 93,335 | UD (2) | $ | 4,089 | $ | 0 | UD (1) | |
| ST 14: Test X | 15.231 | 3,733 | 858 | $ | 3,897 | $ | (−) | AD | $ | 4,042 | $ | (−) | AD | $ | 4,259 | $ | (−) | AD | $ | 4,404 | $ | (−) | AD | $ | 4,694 | $ | (−) | AD | $ | 4,984 | $ | (−) | AD | $ | 5,280 | $ | (−) | AD | ||
| ST 15: Test X 3 | 15.237 | 3,416 | 1,176 | $ | 3,456 | $ | 0 | UD (1) | $ | 3,560 | $ | 27,255 | UD (2) | $ | 3,716 | $ | 69,153 | UD (2) | $ | 3,820 | $ | 97,086 | UD (2) | $ | 4,028 | $ | 152,950 | UD (2) | $ | 4,236 | $ | 510,354 | UD (3) | $ | 4,448 | $ | 1,246,300 | UD (2) | ||
| ST 16: Test X 5 | 15.236 | 3,551 | 1,045 | $ | 3,457 | $ | (−) | AD | $ | 3,532 | $ | 0 | UD (1) | $ | 3,644 | $ | 0 | UD (1) | $ | 3,719 | $ | 0 | UD (1) | $ | 3,869 | $ | 0 | UD (1) | $ | 4,019 | $ | 0 | UD (1) | $ | 4,172 | $ | (−) | AD | ||
| 90% | ST 5: Colonoscopy | 15.207 | 3,518 | 1,038 | $ | 3,949 | $ | (−) | AD | $ | 3,949 | $ | (−) | AD | $ | 3,949 | $ | (−) | AD | $ | 3,949 | $ | (−) | AD | $ | 3,949 | $ | (−) | AD | $ | 3,949 | $ | (−) | AD | $ | 3,949 | $ | (−) | AD | |
| ST 14: Test X | 15.202 | 3,644 | 907 | $ | 3,790 | $ | (−) | AD | $ | 3,937 | $ | (−) | AD | $ | 4,158 | $ | (−) | AD | $ | 4,305 | $ | (−) | AD | $ | 4,599 | $ | (−) | AD | $ | 4,893 | $ | (−) | AD | $ | 5,193 | $ | (−) | AD | ||
| ST 15: Test X 3 | 15.208 | 3,326 | 1,231 | $ | 3,281 | $ | (−) | AD | $ | 3,386 | $ | (−) | AD | $ | 3,542 | $ | (−) | AD | $ | 3,647 | $ | (−) | AD | $ | 3,856 | $ | (−) | AD | $ | 4,066 | $ | (−) | AD | $ | 4,279 | $ | (−) | AD | ||
| ST 16: Test X 5 | 15.210 | 3,389 | 1,168 | $ | 3,192 | $ | 0 | UD (1) | $ | 3,267 | $ | 0 | UD (1) | $ | 3,380 | $ | 0 | UD (1) | $ | 3,455 | $ | 0 | UD (1) | $ | 3,605 | $ | 0 | UD (1) | $ | 3,756 | $ | 0 | UD (1) | $ | 3,909 | $ | 0 | UD (1) | ||
| 100% | ST 5: Colonoscopy | 15.203 | 3,530 | 1,096 | $ | 4,018 | $ | (−) | AD | $ | 4,018 | $ | (−) | AD | $ | 4,018 | $ | (−) | AD | $ | 4,018 | $ | (−) | AD | $ | 4,018 | $ | (−) | AD | $ | 4,018 | $ | (−) | AD | $ | 4,018 | $ | (−) | AD | |
| ST 14: Test X | 15.197 | 3,627 | 997 | $ | 3,830 | $ | (−) | AD | $ | 3,976 | $ | (−) | AD | $ | 4,195 | $ | (−) | AD | $ | 4,341 | $ | (−) | AD | $ | 4,633 | $ | (−) | AD | $ | 4,925 | $ | (−) | AD | $ | 5,223 | $ | (−) | AD | ||
| ST 15: Test X 3 | 15.204 | 3,254 | 1,379 | $ | 3,304 | $ | (−) | AD | $ | 3,408 | $ | (−) | AD | $ | 3,564 | $ | (−) | AD | $ | 3,668 | $ | (−) | AD | $ | 3,876 | $ | (−) | AD | $ | 4,084 | $ | (−) | AD | $ | 4,296 | $ | (−) | AD | ||
| ST 16: Test X 5 | 15.205 | 3,328 | 1,307 | $ | 3,218 | $ | 0 | UD (1) | $ | 3,294 | $ | 0 | UD (1) | $ | 3,406 | $ | 0 | UD (1) | $ | 3,482 | $ | 0 | UD (1) | $ | 3,632 | $ | 0 | UD (1) | $ | 3,782 | $ | 0 | UD (1) | $ | 3,936 | $ | 0 | UD (1) | ||
In each analysis, the most effective strategy with an ICER of less than a willingness to pay of $50,000 per life year gained was highlighted. If this strategy was colonoscopy it was highlighted in orange, if it was Test X, it was highlighted in green.
In each group of 6 rows an upper orange triangle and a lower green triangle were formed, indicating that Test X would be competitive to colnoscopy in the middle rows and columns
LY: Life Years. CRC: Colorectal Cancer. ICER: Incremental Cost Effectiveness Ratio. (−) negative value. AD: Absolute Dominance. ED: Extended Dominance. UD: Undominated.
Discussion
Colonoscopy remained the most effective screening strategy across a wide range of sensitivity analyses. The total costs for colonoscopy were consistently the lowest among all strategies, making colonoscopy the dominant strategy in terms of effectiveness, costs, and cost-effectiveness. Choosing a different strategy resulted in lower effectiveness and higher costs, making such an option undesirable, from clinical, societal or public health standpoints. However, it must also be stated that choosing an alternative to colonoscopy may be necessary in day-to-day practice and for individual patients.
DNA stool testing, in its newest iteration (Cologuard), remained too expensive; and, even at costs approaching zero, it could not dominate colonoscopy in a CEA. This has been a concern for DNA stool testing.38
Even with higher sensitivity and specificity for detecting CRC compared with colonoscopy, DNA testing was not as effective as colonoscopy. The reason was traceable to the number of cancers prevented as a result of the detection of precancerous polyps.
Including a sensitivity of 50% for the detection of adenomas in DNA testing parameters (slightly higher than the sensitivity published for Cologuard19,23) started to close this gap. DNA testing, even at high sensitivities for adenoma detection, could not surpass colonoscopy with significant margins in terms of effectiveness. This was expected, because the sensitivity of DNA testing is measured relative to that of colonoscopy as the benchmark. Therefore, at higher ends of the cost range for DNA testing, colonoscopy was more cost effective, although it was minimally less effective.
Stage shift is an interesting part of this picture. Although it is considered a benefit of screening, the SEER data, at least on the surface, were not reflective of a tangible change over the years in the frequency of metastatic CRC, regardless of whether it could be attributed to screening. In baseline analysis, we did include a stage shift, consistent with the best information available; however, when this effect was removed, the resulting changes were negligible across a wide range of the sensitivity analyses.
Although CT colonography was dominated by colonoscopy, it would be the next most cost-effective strategy among the remaining screening strategies. Whereas further research is needed into the efficacy of CT colonography, the optimal interval for such screening and its ability to reduce CRC incidence and mortality is warranted, these results indicate that it is an effective screening tool. Indeed, the US Preventive Services Task Force included CT colonography in its most recent recommendations.39
The current results clearly illustrate the challenge investigators face in their efforts to create a more effective screening test. As a means to achieve that goal, improving the sensitivity and specificity for detecting invasive cancer is not supported by these results. Instead, improving performance for the detection of adenomas would result in better outcomes.
It is conceivable that colonoscopy will remain the most effective test for CRC screening and intervention. It is also conceivable that, for the time being, stool tests may not have the sensitivity or specificity of colonoscopy for detecting precancerous lesions. However, there is potential for stool testing to identify cancerous and precancerous lesions even before they can be detected by colonoscopy; therefore, it remains a very worthwhile area of research. With increasing sensitivity for precancerous adenoma detection, stool testing can potentially exceed the sensitivity of colonoscopy, given the estimates that it may miss 10% of polyps.40
The cost analysis in this study indicates that screening with colonoscopy (and with many other modalities) resulted in lower overall costs compared with no screening. Although this is in contrast to the findings of some prior CEAs,38 it is a reflection of the rising costs of care. In prior models, the costs of care did not include modern treatment options, such as oxaliplatin and bevacizumab.41,42
It may appear paradoxical that FOBT outperformed FIT, although it is a less sensitive test. This is because both tests are supplemented with colonoscopy in case of a positive result. Because FOBT triggers more colonoscopies due to the higher false-positive rate (lower specificity), more individuals accrue the benefits of colonoscopy.
The sensitivity analysis results indicate that “Test X” at longer intervals, with 100% compliance and a power to detect adenoma equal to that of colonoscopy, outperformed “Test X” at shorter intervals across all measures. This intriguing finding was traced to a reduction in the number of colonoscopies in longer interval applications of “Test X” due to fewer false-positive results.
The magnitude of the screening benefit in terms of LYG, incidence, and cancer mortality reduction predicted by this model were smaller compared with that predicted by the MISCAN model.16,28 When adjusted for the differences in assumptions, the predictions of the current model were in range with those of the MISCAN model.
This study offers insights into what can be achieved by various screening strategies under specific assumptions. In everyday clinical practice, other realities such as capacity and access in the healthcare system as well as individual preferences also impact the magnitude and realization of the expected benefits.
The current study is limited because it is a modeled representation of the prevailing understanding of screening for CRC in lieu of a direct, head-to-head comparison of the strategies listed here. The study is also limited by its data sources. The cost assumptions in the model are derived from the US healthcare system; therefore, costs and cost-effectiveness results and discussions are primarily applicable within that healthcare system. Care must be exercised when applying these results to healthcare systems in other countries.
Supplementary Material
Condensed Abstract.
Colonoscopy remains the most effective screening tool for colorectal cancer. DNA testing while interesting is costlier and is not as effective with an effectiveness gap that cannot be closed by improving the sensitivity and specificity of DNA testing for colorectal cancer.
Acknowledgments
This study was supported in part by the National Cancer Institute Core Grant P30 CA014089.
Footnotes
Afsaneh Barzi, MD, PhD
Contribution: Study concept and design; acquisition of data; analysis and interpretation of data; drafting of the manuscript; critical revision of the manuscript for important intellectual content; statistical analysis; technical, or material support; study supervision
Sarmad Sadeghi, MD, PhD
Contribution: Study concept and design; acquisition of data; analysis and interpretation of data; drafting of the manuscript; critical revision of the manuscript for important intellectual content; statistical analysis; technical, or material support; study supervision
Heinz-Josef Lenz, MD
Contribution: analysis and interpretation of data; critical revision of the manuscript for important intellectual content;
David I. Quinn, MD, PhD
Contribution: analysis and interpretation of data; critical revision of the manuscript for important intellectual content;
Disclosures
Authors have no conflict of interest.
Contributor Information
Afsaneh Barzi, Assistant Professor of Medicine, Norris Comprehensive Cancer Center, University of Southern California, Los Angeles, CA.
Heinz-Josef Lenz, Professor of Clinical Medicine, Norris Comprehensive Cancer Center, University of Southern California, Los Angeles, CA.
David I. Quinn, Associate Professor of Medicine, Norris Comprehensive Cancer Center, University of Southern California, Los Angeles, CA.
Sarmad Sadeghi, Assistant Professor of Medicine, Norris Comprehensive Cancer Center, University of Southern California, 1441 Eastlake Ave, Suite 3440, Los Angeles, CA 90033.
References
- 1.Siegel RL, Miller KD, Jemal A. Cancer statistics, 2016. CA Cancer J Clin. 2016;66:7–30. doi: 10.3322/caac.21332. [DOI] [PubMed] [Google Scholar]
- 2.DeSantis C, Naishadham D, Jemal A. Cancer statistics for African Americans, 2013. CA Cancer J Clin. 2013;63:151–66. doi: 10.3322/caac.21173. [DOI] [PubMed] [Google Scholar]
- 3.Vogelaar I, van Ballegooijen M, Schrag D, et al. How much can current interventions reduce colorectal cancer mortality in the U.S? Mortality projections for scenarios of risk-factor modification, screening, and treatment. Cancer. 2006;107:1624–33. doi: 10.1002/cncr.22115. [DOI] [PubMed] [Google Scholar]
- 4.Zauber AG, Winawer SJ, O’Brien MJ, et al. Colonoscopic polypectomy and long-term prevention of colorectal-cancer deaths. N Engl J Med. 2012;366:687–96. doi: 10.1056/NEJMoa1100370. [DOI] [PMC free article] [PubMed] [Google Scholar]
- 5.Cress RD, Morris C, Ellison GL, et al. Secular changes in colorectal cancer incidence by subsite, stage at diagnosis, and race/ethnicity, 1992–2001. Cancer. 2006;107:1142–52. doi: 10.1002/cncr.22011. [DOI] [PubMed] [Google Scholar]
- 6.Nishihara R, Wu K, Lochhead P, et al. Long-term colorectal-cancer incidence and mortality after lower endoscopy. N Engl J Med. 2013;369:1095–105. doi: 10.1056/NEJMoa1301969. [DOI] [PMC free article] [PubMed] [Google Scholar]
- 7.Siegel RL, Ward EM, Jemal A. Trends in colorectal cancer incidence rates in the United States by tumor location and stage, 1992–2008. Cancer Epidemiol Biomarkers Prev. 2012;21:411–6. doi: 10.1158/1055-9965.EPI-11-1020. [DOI] [PubMed] [Google Scholar]
- 8.Chang GJ, Hu CY, Eng C, et al. Practical application of a calculator for conditional survival in colon cancer. J Clin Oncol. 2009;27:5938–43. doi: 10.1200/JCO.2009.23.1860. [DOI] [PMC free article] [PubMed] [Google Scholar]
- 9.Doubeni CA, Weinmann S, Adams K, et al. Screening colonoscopy and risk for incident late-stage colorectal cancer diagnosis in average-risk adults: a nested case-control study. Ann Intern Med. 2013;158:312–20. doi: 10.7326/0003-4819-158-5-201303050-00003. [DOI] [PMC free article] [PubMed] [Google Scholar]
- 10.Weinstein MC, O’Brien B, Hornberger J, et al. Principles of good practice for decision analytic modeling in health-care evaluation: report of the ISPOR Task Force on Good Research Practices–Modeling Studies. Value Health. 2003;6:9–17. doi: 10.1046/j.1524-4733.2003.00234.x. [DOI] [PubMed] [Google Scholar]
- 11.Husereau D, Drummond M, Petrou S, et al. Consolidated Health Economic Evaluation Reporting Standards (CHEERS)–explanation and elaboration: a report of the ISPOR Health Economic Evaluation Publication Guidelines Good Reporting Practices Task Force. Value Health. 2013;16:231–50. doi: 10.1016/j.jval.2013.02.002. [DOI] [PubMed] [Google Scholar]
- 12.Gold MR, Siegel JE, Russell LB, et al. Cost-effectiveness in health and medicine. New York; Oxford: Oxford University; 1996. [Google Scholar]
- 13.Walker DG, Wilson RF, Sharma R, et al. Best Practices for Conducting Economic Evaluations in Health Care: A Systematic Review of Quality Assessment Tools. Rockville (MD): 2012. [PubMed] [Google Scholar]
- 14.Allison JE, Sakoda LC, Levin TR, et al. Screening for colorectal neoplasms with new fecal occult blood tests: update on performance characteristics. J Natl Cancer Inst. 2007;99:1462–70. doi: 10.1093/jnci/djm150. [DOI] [PubMed] [Google Scholar]
- 15.Knudsen AB, Zauber AG, Rutter CM, et al. Estimation of Benefits, Burden, and Harms of Colorectal Cancer Screening Strategies: Modeling Study for the US Preventive Services Task Force. JAMA. 2016;315:2595–609. doi: 10.1001/jama.2016.6828. [DOI] [PMC free article] [PubMed] [Google Scholar]
- 16.Zauber AG, Lansdorp-Vogelaar I, Knudsen AB, et al. Evaluating test strategies for colorectal cancer screening: a decision analysis for the U.S. Preventive Services Task Force. Ann Intern Med. 2008;149:659–69. doi: 10.7326/0003-4819-149-9-200811040-00244. [DOI] [PMC free article] [PubMed] [Google Scholar]
- 17.van Rijn JC, Reitsma JB, Stoker J, et al. Polyp miss rate determined by tandem colonoscopy: a systematic review. Am J Gastroenterol. 2006;101:343–50. doi: 10.1111/j.1572-0241.2006.00390.x. [DOI] [PubMed] [Google Scholar]
- 18.Whitlock EP, Lin J, Liles E, et al. Screening for Colorectal Cancer: An Updated Systematic Review. Rockville (MD): 2008. [PubMed] [Google Scholar]
- 19.Imperiale TF, Ransohoff DF, Itzkowitz SH. Multitarget stool DNA testing for colorectal-cancer screening. N Engl J Med. 2014;371:187–8. doi: 10.1056/NEJMc1405215. [DOI] [PubMed] [Google Scholar]
- 20.Imperiale TF, Ransohoff DF, Itzkowitz SH, et al. Multitarget stool DNA testing for colorectal-cancer screening. N Engl J Med. 2014;370:1287–97. doi: 10.1056/NEJMoa1311194. [DOI] [PubMed] [Google Scholar]
- 21.Zauber AG, Knudsen AB, Rutter CM, et al. Cost-Effectiveness of CT Colonography to Screen for Colorectal Cancer. Rockville (MD): 2009. [PubMed] [Google Scholar]
- 22.Halligan S, Altman DG, Taylor SA, et al. CT colonography in the detection of colorectal polyps and cancer: systematic review, meta-analysis, and proposed minimum data set for study level reporting. Radiology. 2005;237:893–904. doi: 10.1148/radiol.2373050176. [DOI] [PubMed] [Google Scholar]
- 23.Imperiale TF, Wagner DR, Lin CY, et al. Using risk for advanced proximal colonic neoplasia to tailor endoscopic screening for colorectal cancer. Ann Intern Med. 2003;139:959–65. doi: 10.7326/0003-4819-139-12-200312160-00005. [DOI] [PubMed] [Google Scholar]
- 24.Mandel JS, Bond JH, Church TR, et al. Reducing mortality from colorectal cancer by screening for fecal occult blood. Minnesota Colon Cancer Control Study. N Engl J Med. 1993;328:1365–71. doi: 10.1056/NEJM199305133281901. [DOI] [PubMed] [Google Scholar]
- 25.Joseph DA, King JB, Miller JW, et al. Prevalence of colorectal cancer screening among adults–Behavioral Risk Factor Surveillance System, United States, 2010. MMWR Morb Mortal Wkly Rep. 2012;61(Suppl):51–6. [PubMed] [Google Scholar]
- 26.Holme O, Loberg M, Kalager M, et al. Effect of flexible sigmoidoscopy screening on colorectal cancer incidence and mortality: a randomized clinical trial. JAMA. 2014;312:606–15. doi: 10.1001/jama.2014.8266. [DOI] [PMC free article] [PubMed] [Google Scholar]
- 27.Hardcastle JD, Chamberlain JO, Robinson MH, et al. Randomised controlled trial of faecal-occult-blood screening for colorectal cancer. Lancet. 1996;348:1472–7. doi: 10.1016/S0140-6736(96)03386-7. [DOI] [PubMed] [Google Scholar]
- 28.Zauber AG, Lansdorp-Vogelaar I, Knudsen AB, et al. Evaluating Test Strategies for Colorectal Cancer Screening-Age to Begin, Age to Stop, and Timing of Screening Intervals: A Decision Analysis of Colorectal Cancer Screening for the US Preventive Services Task Force from the Cancer Intervention and Surveillance Modeling Network (CISNET) Rockville (MD): 2009. [PubMed] [Google Scholar]
- 29.Zauber AG, Lansdorp-Vogelaar I, Wilschut J, et al. Cost-Effectiveness of DNA Stool Testing to Screen for Colorectal Cancer. Rockville (MD): 2007. [PubMed] [Google Scholar]
- 30.Volume 2015: Surveillance Research Program. National Cancer Institute; 2012. Standard Populations (Millions) for Age-Adjustment. [Google Scholar]
- 31.Surveillance, Epidemiology, and End Results (SEER) Program. National Cancer Institute, DCCPS, Surveillance Research Program, Surveillance Systems Branch; 2015. (SEER*Stat Database: Incidence - SEER 9 Regs Research Data, Nov 2014 Sub (1973–2012) posted to the SEER web site April 2015). ( http://www.seer.cancer.gov) [Google Scholar]
- 32.National Comprehensive Cancer Network (NCCN) Clinical Practice Guidelines in Oncology. 2015 http://www.ncc.org.
- 33.Period Life Table, 2010. Social Security Administration; 2010. Volume 2015. http://www.ssa.gov/oact/STATS/table4c6.html. [Google Scholar]
- 34.Hirth RA, Chernew ME, Miller E, et al. Willingness to pay for a quality-adjusted life year: in search of a standard. Med Decis Making. 2000;20:332–42. doi: 10.1177/0272989X0002000310. [DOI] [PubMed] [Google Scholar]
- 35.Neumann PJ. Using cost-effectiveness analysis to improve health care : opportunities and barriers. Oxford, New York: Oxford University Press; 2005. [Google Scholar]
- 36.Schoen RE, Pinsky PF, Weissfeld JL, et al. Colorectal-cancer incidence and mortality with screening flexible sigmoidoscopy. N Engl J Med. 2012;366:2345–57. doi: 10.1056/NEJMoa1114635. [DOI] [PMC free article] [PubMed] [Google Scholar]
- 37.Knudsen AB, Lansdorp-Vogelaar I, Rutter CM, et al. Cost-effectiveness of computed tomographic colonography screening for colorectal cancer in the medicare population. J Natl Cancer Inst. 2010;102:1238–52. doi: 10.1093/jnci/djq242. [DOI] [PMC free article] [PubMed] [Google Scholar]
- 38.Lansdorp-Vogelaar I, Kuntz KM, Knudsen AB, et al. Stool DNA testing to screen for colorectal cancer in the Medicare population: a cost-effectiveness analysis. Ann Intern Med. 2010;153:368–77. doi: 10.1059/0003-4819-153-6-201009210-00004. [DOI] [PMC free article] [PubMed] [Google Scholar]
- 39.Force USPST, Bibbins-Domingo K, Grossman DC, et al. Screening for Colorectal Cancer: US Preventive Services Task Force Recommendation Statement. JAMA. 2016 doi: 10.1001/jama.2016.5989. [DOI] [PubMed] [Google Scholar]
- 40.Mulhall BP, Veerappan GR, Jackson JL. Meta-analysis: computed tomographic colonography. Ann Intern Med. 2005;142:635–50. doi: 10.7326/0003-4819-142-8-200504190-00013. [DOI] [PubMed] [Google Scholar]
- 41.Barzi A, Sadeghi S, Kattan MW, et al. Comparative effectiveness of screening strategies for Lynch syndrome. J Natl Cancer Inst. 2015;107 doi: 10.1093/jnci/djv005. [DOI] [PMC free article] [PubMed] [Google Scholar]
- 42.Song X, Zhao Z, Barber B, et al. Cost of illness in patients with metastatic colorectal cancer. J Med Econ. 2011;14:1–9. doi: 10.3111/13696998.2010.536870. [DOI] [PubMed] [Google Scholar]
Associated Data
This section collects any data citations, data availability statements, or supplementary materials included in this article.