A change of ertapenem dosage from 500 mg daily to thrice weekly, after each hemodialysis session, can maintain the plasma concentration above 2 mg/liter and be practical for hemodialysis patients.
KEYWORDS: carbapenem, ertapenem, hemodialysis, pharmacokinetic
ABSTRACT
A change of ertapenem dosage from 500 mg daily to thrice weekly, after each hemodialysis session, can maintain the plasma concentration above 2 mg/liter and be practical for hemodialysis patients.
INTRODUCTION
The recommended dose of ertapenem for hemodialysis (HD) patients is 500 mg daily, compared to 1,000 mg daily for patients with mild to moderate renal insufficiency, because 80% of the dose of ertapenem is excreted in urine (1–3). However, pharmacokinetic (PK) data for HD patients, a prerequisite for accurate dosing, are neglected by clinicians. This prospective study aimed to investigate whether ertapenem administered at 500 mg thrice weekly, after each HD session, could maintain serum concentrations of >2 mg/liter (selected based on the MIC90 and the CLSI/FDA susceptibility breakpoint [4–6]). The study protocols were approved by the institutional review board of Taipei Veterans General Hospital (protocols 2013-08-011A and 2015-08-005A).
Twenty-two hospitalized adult HD patients with infections who were receiving empirically initiated ertapenem treatment in the ward were recruited. The first 11 of the 22 HD patients were assigned to the reference group and received intravenous infusion of ertapenem (Invanz; Merck) at 500 mg daily. The other 11 HD patients were assigned to the experimental group and received ertapenem at 500 mg thrice weekly, after each HD session. After the first dose of 500 mg ertapenem, patients in both groups started thrice-weekly HD the following morning. On HD days, 2-ml, prefilter, venous blood samples were collected prior to HD and 1 h, 2 h, 3 h, and 4 h after the initiation of HD, for biochemical tests and plasma ertapenem determinations. On non-HD days, venous blood was drawn before and 1 h after administration of 500 mg ertapenem in the reference group. Plasma was collected after centrifugation of the samples at 1,500 × g for 10 min at 4°C. To stabilize ertapenem, plasma (180 μl) was mixed with 10 μl of 1 M 2-(N-morpholino)ethanesulfonic acid (MES) buffer (pH 6.6) (7) and stored at −70°C until analysis within 2 weeks. Plasma total and free ertapenem concentrations were determined using reverse-phase high-performance liquid chromatography, and meropenem was used as an internal standard (7, 8). Ertapenem and meropenem were detected by measuring the absorbance at 304 nm.
The PK analyses of ertapenem were processed using a two-compartment open model (9, 10). The model, with 30-min infusion and first-order elimination, was established using WinNonlin 5.3 software (Pharsight, Mountain View, CA, USA) to generate ertapenem PK parameters. The curve fitting of ertapenem plasma concentrations from all patients in the reference group was conducted individually and results were collected to simulate three different ertapenem dosing regimens (500 mg daily, 250 mg daily, and 500 mg every other day), to estimate the optimal administration for HD patients. In addition, the derived equation obtained from the PK analysis of total ertapenem concentrations was used to analyze the trough plasma levels in the experimental group.
The chi-square test and the Mann-Whitney U test were used to compare gender, etiology of renal failure, body height, body weight, body fluid removal in HD, systolic and diastolic blood pressure (BP), blood and dialysate flow in HD, dialysis efficiency, urea reduction rate, albumin level, blood urea nitrogen level, and creatinine level at baseline. The tests showed no significant differences between the two groups (Table 1).
TABLE 1.
Basic characteristics and clinical data for infected HD patients who received ertapenem treatment during hospitalization (n = 22)a
| Characteristicb | Reference groupc (n = 11) | Experimental groupd (n = 11) | P |
|---|---|---|---|
| Age (yr) | 63.2 ± 16.6 | 66.4 ± 16.1 | 0.653 |
| No. male/no. female | 4/7 | 4/7 | 0.67 |
| Body height (cm) | 159.7 ± 10.8 | 159.1 ± 10.7 | 0.906 |
| Body weight (kg) | 60.3 ± 14.1 | 62.0 ± 17.4 | 0.804 |
| Total body fluid removal (liters) | 1.4 ± 1.3 | 1.7 ± 1.1 | 0.602 |
| Systolic BP (mm Hg) | 136.0 ± 25.2 | 140.8 ± 23.7 | 0.649 |
| Diastolic BP (mm Hg) | 79.7 ± 17.8 | 80.8 ± 12.0 | 0.868 |
| Blood flow in HD (ml/min) | 201.8 ± 41.4 | 210.5 ± 26.5 | 0.567 |
| Dialysate flow in HD (ml/min) | 500 | 500 | 1 |
| Kt/V | 1.6 ± 0.2 | 1.4 ± 0.4 | 0.108 |
| URR (%) | 73.5 ± 5.0 | 69.3 ± 9.3 | 0.209 |
| Albumin level (g/dl) | 3.3 ± 0.3 | 3.2 ± 0.6 | 0.934 |
| BUN level (mg/dl) | 63.7 ± 17.9 | 80.7 ± 23.1 | 0.068 |
| Cr level (mg/dl) | 8.2 ± 2.6 | 8.3 ± 1.7 | 0.929 |
All patients were local HD patients in Taiwan.
Kt/V, dialysis efficiency; URR, urea reduction rate; BUN, blood urea nitrogen; Cr, creatinine. Continuous variables are shown as mean ± standard deviation. The normal range for albumin levels is 3.5 to 5.7 mg/dl, that for blood urea nitrogen levels is 7 to 25 mg/dl, and that for creatinine levels is 0.6 to 1.3 mg/dl.
In the reference group, HD patients received ertapenem at 500 mg daily.
In the experimental group, HD patients received ertapenem at 500 mg thrice weekly, after each HD session.
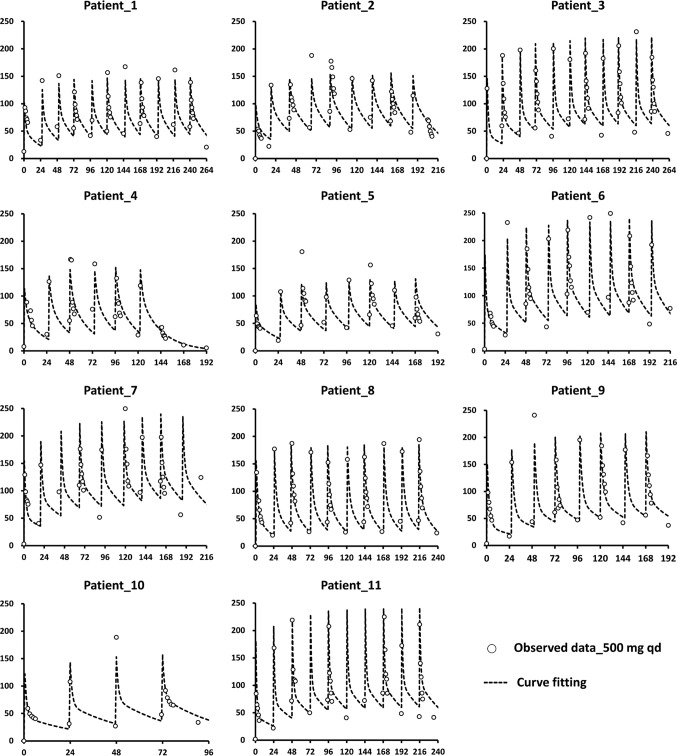
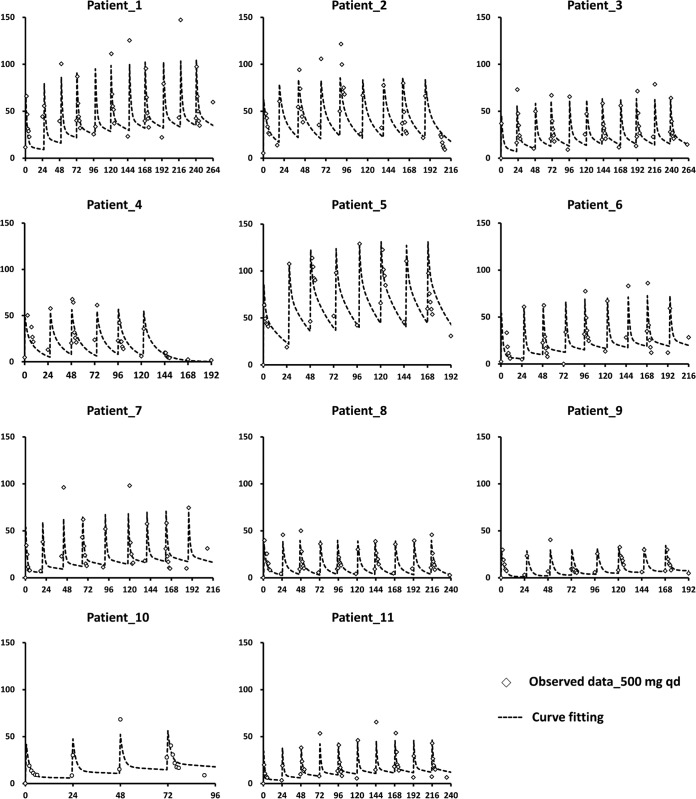
The mean total and free ertapenem plasma levels and the clearances of ertapenem in each HD session were significantly higher in the reference group (P < 0.05). The ertapenem plasma levels increased rapidly after the first dose before the first session of HD, and high plasma levels were maintained during the consecutive ertapenem therapy and HD sessions. In the reference group, ∼50% of the ertapenem was cleared during each session of HD (Table 2). The plasma trough and peak levels of total ertapenem were at least 5 to 10 times and 50 to 100 times, respectively, higher than 2 mg/liter throughout the treatment course (Fig. 1). The plasma trough levels of the free form were also >2 mg/liter (Fig. 2). These findings suggest that the daily 500-mg doses of ertapenem was more than required.
TABLE 2.
Plasma levels of total and free forms of ertapenem and clearance during each HD session for the reference and experimental groups (n = 22)
| Measurementa | Reference group (n = 11) | Experimental group (n = 11) | P |
|---|---|---|---|
| 1HD0t plasma level (mg/liter) | 96.4 ± 40.2 | 60.6 ± 17.1 | 0.013 |
| 1HD4t plasma level (mg/liter) | 49.5 ± 15.4 | 36.4 ± 11.0 | 0.032 |
| 1HDt clearance (%) | 45.4 ± 13.6 | 39.4 ± 11.9 | 0.283 |
| 2HD0t plasma level (mg/liter) | 161.9 ± 35.1 | 50.2 ± 39.3 | <0.001 |
| 2HD4t plasma level (mg/liter) | 84.5 ± 13.9 | 33.1 ± 26.8 | <0.001 |
| 2HDt clearance (%) | 46.5 ± 9.3 | 33.9 ± 9.8 | 0.006 |
| 3HD0t plasma level (mg/liter) | 182.8 ± 35.5 | 28.5 ± 14.2 | <0.001 |
| 3HD4t plasma level (mg/liter) | 89.4 ± 20.2 | 16.6 ± 7.0 | <0.001 |
| 3HDt clearance (%) | 50.7 ± 8.5 | 39.1 ± 8.6 | 0.006 |
| 4HD0t plasma level (mg/liter) | 169.3 ± 43.4 | 27.7 ± 20.6 | <0.001 |
| 4HD4t plasma level (mg/liter) | 82.2 ± 14.1 | 13.4 ± 6.5 | <0.001 |
| 4HDt clearance (%) | 49.9 ± 8.9 | 44.0 ± 14.8 | 0.315 |
| 5HD0t plasma level (mg/liter) | 195.8 ± 40.6 | 33.5 ± 26.4 | <0.001 |
| 5HD4t plasma level (mg/liter) | 90.5 ± 33.4 | 19.7 ± 10.3 | 0.008 |
| 5HDt clearance (%) | 54.0 ± 10.5 | 34.8 ± 16.2 | 0.031 |
| 1HD0f plasma level (mg/liter) | 40.2 ± 17.6 | 24.0 ± 12.4 | 0.021 |
| 1HD4f plasma level (mg/liter) | 13.0 ± 7.2 | 8.7 ± 3.1 | 0.099 |
| 1HDf clearance (%) | 67.7 ± 11.1 | 57.8 ± 13.7 | 0.07 |
| 2HD0f plasma level (mg/liter) | 58.2 ± 23.4 | 20.1 ± 15.8 | <0.001 |
| 2HD4f plasma level (mg/liter) | 18.2 ± 10.1 | 8.9 ± 5.9 | 0.016 |
| 2HDf clearance (%) | 67.2 ± 12.1 | 50.8 ± 18.2 | 0.022 |
| 3HD0f plasma level (mg/liter) | 65.7 ± 36.2 | 9.9 ± 5.5 | 0.001 |
| 3HD4f plasma level (mg/liter) | 23.2 ± 17.7 | 4.5 ± 2.1 | 0.009 |
| 3HDf clearance (%) | 57.7 ± 32.9 | 51.6 ± 13.6 | 0.581 |
| 4HD0f plasma level (mg/liter) | 54.6 ± 27.3 | 11.2 ± 12.8 | 0.001 |
| 4HD4f plasma level (mg/liter) | 17.2 ± 9.0 | 3.4 ± 1.4 | 0.002 |
| 4HDf clearance (%) | 61.5 ± 30.8 | 56.6 ± 15.2 | 0.649 |
| 5HD0f plasma level (mg/liter) | 64.8 ± 22.3 | 10.1 ± 5.7 | 0.005 |
| 5HD4f plasma level (mg/liter) | 22.4 ± 11.3 | 4.3 ± 2.1 | 0.023 |
| 5HDf clearance (%) | 66.7 ± 9.3 | 53.1 ± 12.8 | 0.052 |
Times are indicated as mHDn, with m before and n after HD indicating the session of HD and the blood sample collection time during the session of HD, respectively. For example, the first session of HD is indicated by m = 1, and the blood sample collection at the fourth hour of HD is indicated by n = 4. t, plasma level of total ertapenem; mHDt clearance, the plasma level of total ertapenem at 0 h of the m session of HD minus the plasma level of total ertapenem at 4 h of the m session of HD divided by the plasma level of total ertapenem at 0 h of the m session of HD [(mHD0t – mHD4t)/mHD0t]; f, plasma level of the free form of ertapenem; mHDf clearance, the plasma level of the free form of ertapenem at 0 h of the m session of HD minus the plasma level of free ertapenem at 4 h of the m session of HD divided by the plasma level of the free form of ertapenem at 0 h of the m session of HD [(mHD0f – mHD4f)/mHD0f].
FIG 1.
Curve fitting of total ertapenem plasma concentrations in HD patients (n = 11) after multiple-dose regimens. Ertapenem at 500 mg was administered daily to patients via 30-min intravenous infusion. The vertical axis in each diagram indicates the ertapenem plasma level (milligram per liter), and the horizontal axis indicates the time (hours). The observed data are represented by open circles, and the fitted results are depicted with dotted lines. Patients 4 and 6 developed central nervous system toxicity, presenting as self-talking and visual hallucinations, after the seventh and ninth consecutive daily doses of 500 mg ertapenem, respectively.
FIG 2.
Curve fitting of free ertapenem plasma concentrations in HD patients (n = 11) after multiple-dose regimens. Ertapenem at 500 mg was administered daily to patients via 30-min intravenous infusion. The vertical axis in each diagram indicates the ertapenem plasma level (milligram per liter), and the horizontal axis indicates the time (hours). The observed data are represented by open diamonds, and the fitted results are depicted with dotted lines.
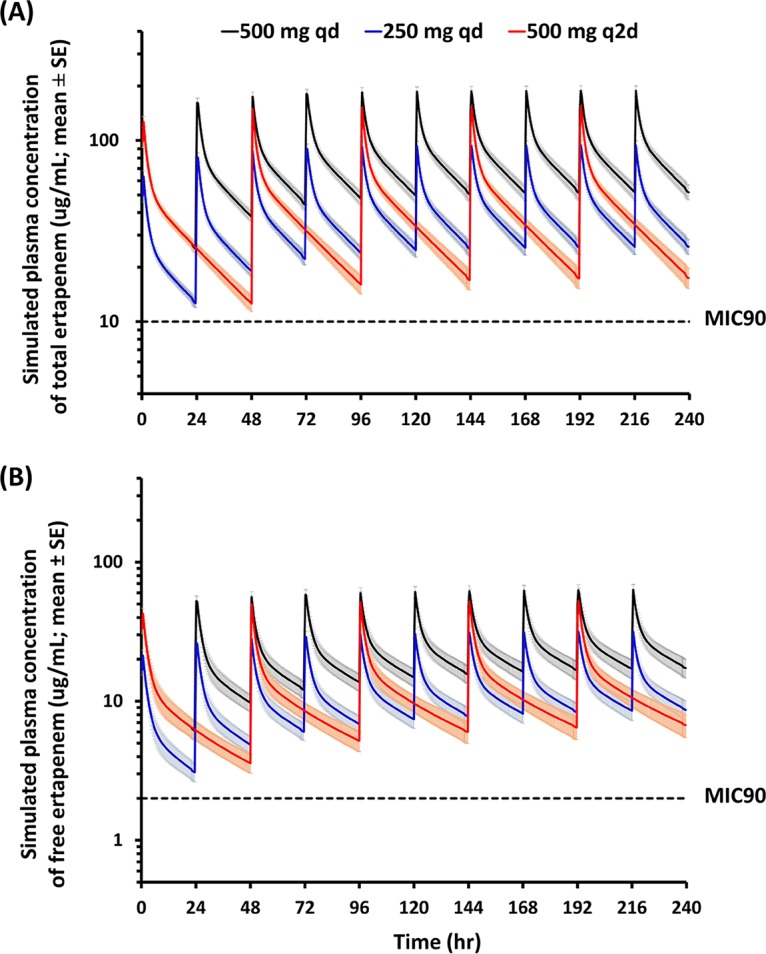
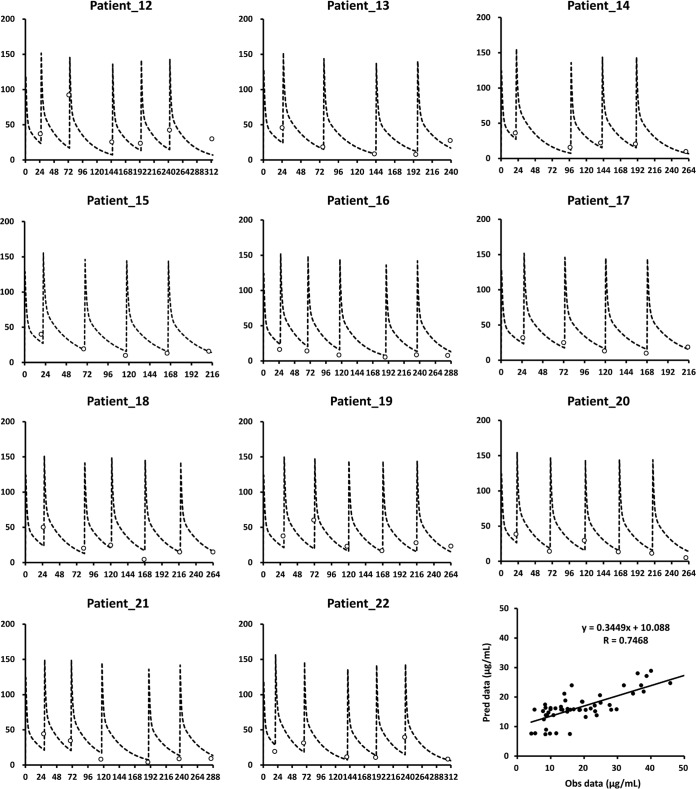
The simulations of total and free ertapenem plasma trough levels showed that, when HD patients received 500 mg daily, 250 mg daily, or 500 mg every other day, their plasma levels were above 10 mg/liter and 2 mg/liter, respectively, on HD and non-HD days (Fig. 3). The simulated plasma trough concentrations of ertapenem were similar to the trough concentrations for each dosing interval that were observed for patients in the experimental group (Fig. 4). The trough concentrations of ertapenem above 2 mg/liter in the experimental group supported the idea that the daily dose of 500 mg ertapenem was more than required for HD patients. In addition, owing to the strong correlation (r = 0.7468) between observed and predicted plasma levels, the data for patients 12 to 22 confirmed the clinical applicability of our simulations in predicting the appropriate ertapenem dosage in the experimental group (Fig. 4). This study also supported previous case reports showing that a daily dose of 500 mg ertapenem was probably not needed for HD patients and was potentially toxic due to accumulation (7, 11, 12). The higher ertapenem levels in the reference group than in the experimental group may be related to the barely eliminated ertapenem on nondialysis days (Table 2). The administration of 500 mg ertapenem after each HD session was probably a safer regimen and was practical for HD patients.
FIG 3.

Simulations of ertapenem plasma concentrations. PK parameters for ertapenem obtained from HD patients (n = 11) were used to simulate drug plasma concentrations in a clinical setting. The simulations of total (A) and free (B) ertapenem plasma levels with three different multiple-dose regimens in HD patients were graphed. The shaded regions indicate the standard errors of all concentration points from 11 simulated profiles. Ertapenem was administered via 30-min intravenous infusion at the beginning of each dosing interval. The black lines indicate 500 mg ertapenem administered daily to patients, to follow the current clinical regimen, the blue lines indicate a half dose given daily as current use, and the red lines indicate ertapenem given every other day at a dose of 500 mg. The dotted lines indicate the MICs of ertapenem in total form (10 mg/liter) and free form (2 mg/liter). The levels for all subjects were above the MIC90 therapeutic level (>2 mg/liter) for the entire dosing interval.
FIG 4.
Application of the equations derived from the simulation data to data for another 11 HD patients. The dotted line in each diagram indicates the simulated plasma concentrations of ertapenem following the 500-mg thrice-weekly administration, after each session of HD. The trough concentrations observed for each dosing interval are indicated as open circles. The vertical axis in each diagram indicates the total ertapenem plasma level (milligrams per liter), and the horizontal axis indicates the time (hours). The diagram in the bottom right shows the correlation between observed (Obs) and predicted (Pred) data for patients 12 to 22, using the simulation model.
This first PK study of ertapenem in HD patients with consecutive doses, instead of previous studies with single-dose administration (3, 13), is important for both pharmacovigilance and antimicrobial efficacy in considering ertapenem doses. The change of administration of 500 mg ertapenem from daily to thrice weekly, after each session of HD, is adequate to maintain the plasma trough level above 2 mg/liter.
This study may be partially confounded by factors such as the sequential study design. Since ertapenem is highly protein bound, our findings may not be applicable to other carbapenems and to patients undergoing peritoneal dialysis or continuous renal replacement therapy (10). Further study with a larger population of HD patients may be required to evaluate safety and tolerability.
ACKNOWLEDGMENTS
This study was supported by National Science Council grant 101-2629-B-075-001 and Taipei Veterans General Hospital-National Yang Ming University Excellent Physician Scientists Cultivation Program grant 104-V-B-013.
We have no conflicts of interest to declare.
REFERENCES
- 1.Burkhardt O, Derendorf H, Welte T. 2007. The new carbapenem 5 years after first FDA licensing for clinical practice. Expert Opin Pharmacother 8:237–256. doi: 10.1517/14656566.8.2.237. [DOI] [PubMed] [Google Scholar]
- 2.Mistry GC, Majumdar AK, Swan S, Sica D, Fisher A, Xu Y, Hesney M, Xi L, Wagner JA, Deutsch PJ. 2006. Pharmacokinetics of ertapenem in patients with varying degrees of renal insufficiency and in patients on hemodialysis. J Clin Pharmacol 46:1128–1138. doi: 10.1177/0091270006291839. [DOI] [PubMed] [Google Scholar]
- 3.Burkhardt O, Hafer C, Langhoff A, Kaever V, Kumar V, Welte T, Haller H, Fliser D, Kielstein JT. 2009. Pharmacokinetics of ertapenem in critically ill patients with acute renal failure undergoing extended daily dialysis. Nephrol Dial Transplant 24:267–271. doi: 10.1093/ndt/gfn472. [DOI] [PubMed] [Google Scholar]
- 4.Marchese A, Gualco L, Schito AM, Debbia EA, Schito GC. 2004. In vitro activity of ertapenem against selected respiratory pathogens. J Antimicrob Chemother 54:944–951. doi: 10.1093/jac/dkh445. [DOI] [PubMed] [Google Scholar]
- 5.Jones RN. 2001. In vitro evaluation of ertapenem (MK-0826), a long-acting carbapenem, tested against selected resistant strains. J Chemother 13:363–376. doi: 10.1179/joc.2001.13.4.363. [DOI] [PubMed] [Google Scholar]
- 6.Lee M, Chung HS. 2015. Different antimicrobial susceptibility testing methods to detect ertapenem resistance in Enterobacteriaceae: VITEK2, MicroScan, Etest, disk diffusion, and broth microdilution. J Microbiol Methods 112:87–91. doi: 10.1016/j.mimet.2015.03.014. [DOI] [PubMed] [Google Scholar]
- 7.Briscoe S, McWhinney BC, Lipman J, Roberts JA, Ungerer J. 2012. A method for determining the free (unbound) concentrations of ten beta-lactam antibiotics in human plasma using high performance liquid chromatography. J Chromatogr B 907:178–184. doi: 10.1016/j.jchromb.2012.09.016. [DOI] [PubMed] [Google Scholar]
- 8.Lee KH, Ueng YF, Wu CW, Chou YC, Ng YY, Yang WC. 2015. The recommended dose of ertapenem poses a potential risk for central nervous system toxicity in haemodialysis patients: case reports and literature reviews. J Clin Pharm Ther 40:240–244. doi: 10.1111/jcpt.12239. [DOI] [PubMed] [Google Scholar]
- 9.Nix DE, Majumdar AK, DiNubile MJ. 2004. Pharmacokinetics and pharmacodynamics of ertapenem: an overview for clinicians. J Antimicrob Chemother 53:ii23–ii28. doi: 10.1093/jac/dkh205. [DOI] [PubMed] [Google Scholar]
- 10.Eyler RF, Vilay AM, Nader AM, Heung M, Pleva M, Sowinski KM, DePestel DD, Sörgel F, Kinzig M, Mueller BA. 2014. Pharmacokinetics of ertapenem in critically ill patients receiving continuous venovenous hemodialysis or hemodiafiltration. Antimicrob Agents Chemother 58:1320–1326. doi: 10.1128/AAC.02090-12. [DOI] [PMC free article] [PubMed] [Google Scholar]
- 11.Wen MJ, Sung CC, Chau T, Lin SH. 2013. Acute prolonged neurotoxicity associated with recommended doses of ertapenem in 2 patients with advanced renal failure. Clin Nephrol 80:474–478. doi: 10.5414/CN107247. [DOI] [PubMed] [Google Scholar]
- 12.Seto AH, Song JC, Guest SS. 2005. Ertapenem-associated seizures in a peritoneal dialysis patient. Ann Pharmacother 39:352–356. doi: 10.1345/aph.1E421. [DOI] [PubMed] [Google Scholar]
- 13.Geerlings CJC, De Man P, Rietveld AP, Touw DJ, Tervaert J. 2013. A practical thrice weekly ertapenem dosage regime for chronic hemodialysis patients? Clin Nephrol 80:312. doi: 10.5414/CN108071. [DOI] [PubMed] [Google Scholar]


