

Abstract
Cytochrome P450 (cytP450) interacts with two redox partners, cytP450 reductase and cytochrome-b5, to metabolize substrates. Using NMR, we reveal changes in the dynamic interplay when all three proteins are incorporated into lipid nanodiscs in the absence and presence of substrates.
Graphical Abstract
Cytochrome P450s (cytP450) are a ubiquitous superfamily of enzymes responsible for the metabolism of a variety of compounds from vitamins to fatty acids to over 70% of the drugs on the pharmaceutical market.[1–5] Per turn of its catalytic cycle which requires two electrons, cytP450 inserts a molecule of activated oxygen into a hydrophobic substrate. Both electrons can be provided by cytochrome P450 reductase (CPR), cytP450’s obligate redox partner, or the second can be donated by cytochrome b5 (cytb5).[6]
CPR is an 80 kDa protein that consists of the FAD/NADPH binding domain, the FMN binding domain (FBD), a linker region connecting the two flavin domains, and an N-terminal transmembrane domain.[5, 7] After being reduced by NADPH, electrons flow from the FAD binding domain to FMN in the FBD which then directly donates the electrons to the heme in the active site of cytP450. In this study, we utilize a truncated version of CPR, the full-length FBD (flFBD), consisting of only the FBD along with the N-terminal transmembrane domain. This flFBD domain has been used previously as the minimal necessary domain of CPR to interact with cytP450 [8–10].
Cytb5, the third protein of this ternary complex, is a ~15.7 kDa protein only capable of donating the second electron to cytP450 because of the disparity in redox potentials between it and ferric cytP450.[5, 11, 12] Cytb5 has been shown to increase, decrease, or do nothing to cytP450’s metabolism depending on the isoform of cytP450 and the type of substrate involved.[2, 13, 14] In some cases, such as that of cytP450 17A1, cytb5 is known to favor a specific reaction and product formation.[15, 16, 17] Due to the mystery still surrounding cytb5’s functional properties, we further investigated cytb5’s role in regulating cytP450 drug metabolism.
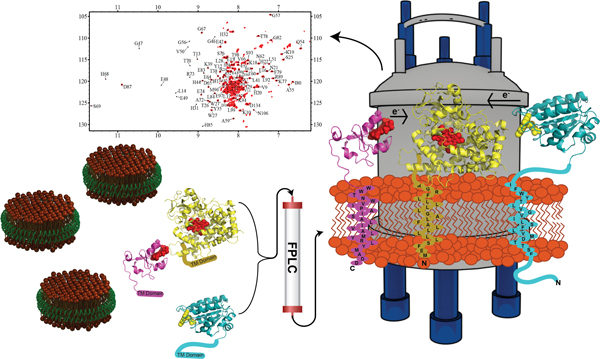
All three proteins, cytP450, cytb5, and flFBD, contain single transmembrane helices that anchor them to the membrane (Figure 1A). In cytP450’s case, even the globular, ‘soluble’ domain, specifically the F/G-loop, interacts with the lipid bilayer.[18–20] The presence of a lipid bilayer has been shown to influence these cytP450-redox partner protein-protein interactions both through dictating favorable orientations for complex formation, increasing or decreasing electron transfer rates and affecting metabolism of substrates, and altering the spin state shifts of the heme group of cytP450 when the redox partner is present.[2, 21, 22] In order to study this ternary complex in a lipid environment, herein we utilized nanodiscs (ND). Using 4F peptides as the scaffold belt for the NDs is very favorable for this ternary complex because it creates very flexible nanodiscs that are accommodating for the stepwise addition of single-pass transmembrane proteins. Our previous studies have illustrated this ability with two membrane proteins.[10]
Figure 1. Reconstitution of cytochrome proteins in a lipid nanodisc.

(A) A schematic of the three cytochrome proteins incorporated into a nanodisc. (B) and (C) both display the formation of protein-protein complexes into nanodiscs with stepwise incorporation of proteins into the nanodisc through SEC (B) and DLS (C).
As substrates have been shown to have a sizeable impact on strengthening the complex interactions between cytb5 and cytP450, we chose five substrates to probe this complex’s strength. These substrates were chosen due to their range in hydrophobicity although as cytP450 substrates, they are all hydrophobic in nature, and availability of cytP450 crystal structures solved in the presence of these compounds. They are: butylated hydroxytoluene (BHT; LogP=5.3), bifonazole (BFZ; LogP = 4.8), benzphetamine (BZ; LogP=4.1), 4-(4-Chlorophenyl)-1H-imidazole (4-CPI; LogP=2.4), and 1-(4-Chlorophenyl)-imidazole (1-CPI; LogP=2.3). Herein, we also examined the role of membrane and various substrates on the interplay between cytP450 and its two redox partners.
In order to study the ternary complex in lipid NDs, each full-length protein was expressed, purified and characterized as detailed in the SI. For this study, the 55 kDa cytP450 isoform that was utilized is cytP450 2B4, a rabbit homolog with 76% sequence identity to human cytP450 2B6.[23] Sequential incorporation of the three proteins was accomplished over the course of three days using 4F-DMPC NDs that were purified through size exclusion chromatography (SEC). Two versions of the ternary complex were assembled: one with cytb5 incorporated into the ND first, then cytP450, and then flFBD, called “cytb5-ternary complex” and the other with flFBD incorporated into the ND first, then cytP450, and then cytb5, called “flFBD-ternary complex”. Reconstitution of these proteins into NDs was accomplished by the mixing of empty NDs and protein, incubating overnight, purifying by SEC, and characterizing their size by dynamic light scattering (DLS). On the second day, one molar equivalent of cytP450 2B4 was added to form complexes of cytb5-cytP450 or flFBD-cytP450 in NDs. On the third day, the other redox partner was added to the samples in order to make the cytb5-ternary complex or flFBD-ternary complex for a final protein ratio of 1:1:1. This protein ratio of 1:1:1 was chosen to directly compare competition effects as a result of one redox partner’s ability to bind to cytP450 over the other without having concentration effects skewing the results. In Figure 1B and 1C, a gradual increase in size is displayed while creating the flFBD-ternary complex as seen by the increase in the Stoke radius in DLS or elution time growing shorter in SEC after the addition of proteins to empty NDs (blue), NDs+flFBD (green), NDs+flFBD+cytP450 (black), and NDs+flFBD+cytP450+cytb5 (red). Figure S1A and S1B show the cytb5-ternary complex formation via SEC and DLS. Previous work has revealed that substrates drive the formation of a strong complex between cytb5 and cytP450 in solution as well as in ternary complex systems with cytb5, cytP450, and FBD.[24–26] Complex formation between 15N-labeled cytb5 and cytP450 was monitored through 15N/1H TROSY HSQC NMR experiments by measuring the signal intensities and linewidths of cytb5’s amide 15N-1H peaks. As the chemical environment around amide N-H changes upon binding to cytP450, a sizeable change in linewidth and intensity of resonances were observed in the NMR spectra (Figs. S2–S14). Fig. 2 reports the average signal intensity observed for residues clustered on the lower cleft of cytb5. These residues (N62-R73) are highlighted in blue in the inset of Fig. 2 and have been identified as important residues that bind to cytP450.[27] As this lower cleft is highly involved in binding to cytP450, it is a good marker to probe if cytb5 is bound to cytP450. Upon the addition of cytP450 (Fig.2, orange) to the 15N-cytb5, the overall signal intensity of the lower cleft residues of cytb5 drops to about ~52% of the original intensity. Intriguingly, when various substrates were added to the cytb5-cytP450 complex, the binding is not strengthened based on the lack of changes observed for the signal intensities (Figs. 2 and S15). This lack of substrate effect is not completely surprising because the complex is already showing a tight binding due to the presence of the lipid membrane in the nanodiscs in comparison to the lipid-free condition as reported previously[24]. One hypothesis as to why the substrates do not increase the complex strength is that the hydrophobic compounds do partition into the lipid bilayer[28,29]. As drugs have another way of increasing hydrophobic contacts than promoting binding between the two proteins, the substrate-induced changes in the protein-protein interaction does not happen as strongly as observed in the absence of lipids. Some drugs like BFZ and BZ, slightly dislodge the complex cytb5-cytP450 (Fig. 2 light green, light blue) as shown by the slight increase in signal intensity. While we do not know what the cause for this disruption is, there could be several things happening. As hydrophobic compounds partition into membrane, they could interact with the transmembrane domains of the proteins or with other parts of cytP450.
Figure 2: 15N-cytb5 monitored ternary complex formation in nanodiscs.

Average signal intensity of cytb5 residues involved in binding to cytP450 (N62-R73) measured from TROSY-HSQC spectra.[28] Each bar in the graph as well as the contour peak in a 2D TROSY-HSQC spectrum corresponds to the addition of a protein or drug to the NDs containing 15N-labeled cytb5 sample. Peak intensity observed from nanodiscs containing 15N-labeled cytb5 alone was used as the reference (red) and set to 100%. The peak intensities were greatly reduced when cytP450 was added to the cytb5 in ND (orange). After flFBD was incorporated into the ND containing cytb5 and cytP450 (black), signal intensities were partially restored. Signal intensity depicting the effect of each of the five drugs is represented in the lighter shade bar and the darker shade bars are the measurement after the addition of flFBD to the substrate bound-cytb5-cytP450 complex: 4-CPI (pink); BFZ (yellow); BHT (green); 1-CPI (blue); BZ (purple). The average signal intensity represented by the black horizontal line. (inset) The lower cleft residues are highlighted in blue on a structure of cytb5 (PDB 2M33). Error bars were generated from the standard deviation of the average signal intensities of the mentioned residues.
Upon the addition of flFBD to the ND containing cytb5 and cytP450, we see an increase in signal intensity globally, but the cytb5 residues do not return to the same intensity level as observed for NDs containing cytb5 alone. In the presence of substrates, flFBD is unable to greatly disrupt the interaction between cytb5 and cytP450. Without a substrate present, flFBD can dislodge cytb5 from a complex with cytP450 which is demonstrated by the return of about 85% of the starting signal intensity. By dislodging cytb5, we mean that flFBD is able to disrupt the complex between cytb5 and cytP450 and interfere so some of the cytb5 is no longer bound to cytP450. Cytb5 does not leave the ND. Substrates can keep cytb5 and cytP450 bound to one another and make flFBD less capable of disrupting the complex. Drugs with highest to lowest ability of maintaining complex formation are in the following order: BZ, BFZ, BHT, 1-CPI, 4-CPI. Looking closely at one of the residues identified in binding of cytb5 to cytP450, Serine 69, we can see in Fig. 2 that its signal intensity decreases upon the addition of cytP450. After the addition of drugs to the cytb5-cytP450 ND complex, slight changes occur in the signal intensity. Once flFBD was added, varying levels of signal intensities were restored. Fig. S15 displays the extracted linewidths of S69 to illustrate the broadening of the signal upon the addition of cytP450 and the partial restoration after the addition of flFBD.
From our previous study[24], it was shown that cytb5 can dislodge FBD from the FBD-cytP450 complex. We were curious as to how the membrane would affect cytb5’s ability to disrupt the FBD-cytP450 complex as it provides both a more native membrane environment and a spatial constraint (Fig.3). 15N-labeled flFBD was expressed, purified, and reconstituted into 4F-DMPC NDs. A 15N/1H TROSY-HSQC spectrum was acquired of 15N-flFBD in ND alone (red). Stepwise reconstitution was done to incorporate cytP450 2B4 into the flFBD containing NDs and a spectrum was obtained (orange). Each of the five drugs chosen were incubated with the complex of flFBD-cytP450 (4-CPI, pink; BFZ, yellow; BHT, green; 1-CPI, blue; BZ, purple) and then NMR spectra were obtained (Figs. S16–S28). Finally, cytb5 was incorporated into flFBD-cytP450-ND with and without substrates.
Figure 3: 15N-flFBD monitored ternary complex formation demonstrates cytb5’s ability to dislodge flFBD from its complex with cytP450.

The bar graph shows the average overall signal intensity of all 15N-labeled flFBD residues. In red is the complex intensity at 100% for flFBD in complex with cytP450. After the red bar is the intensity for the complex with a substrate added (4-CPI, BFZ, BHT, 1-CPI, or BZ) or no substrate. The third bar is the addition of cytb5 to the complex with a substrate. Highlighted sections of 1H/15N TROSY-HSQC spectra of 15N-flFBD displaying residue G89 which has been shown to be involved in binding to cytP450 and S123 which is not involved. (red) 15N-flFBD; (orange) 15N-flFBD with 1xcytP450 2B4; (gray) 15N-flFBD with 1xcytP450 2B4 and 1xcytb5. The chemical structure of each of the five substrates used is displayed in the middle with the next column showing the 15N-flFBD-cytP450 complex with substrate spectrum and the rightmost column showing the 15N-flFBD-cytP450-substrate-drug spectrum. 4-CPI (pink); BFZ (yellow); BHT (green); 1-CPI (blue); BZ (purple).
The overall signal intensity of the flFBD residues was monitored as the protein complexes were formed and broken. A decrease in the signal intensity upon the addition of cytP450 indicates that a complex was formed between flFBD and cytP450. After the addition of a substrate, no significant difference in complex strength was observed. Substrates have not been shown to dramatically increase the affinity of cytP450 for FBD, so this result was not surprising. Both 4-CPI and BFZ marginally increased the complex strength while BHT and BZ’s addition did not strengthen the complex, and BZ weakened it a little. The addition of 1-CPI, however, significantly increased the complex formation which is shown in Fig. 3 (blue) and Figure S33.
Once cytb5 was incorporated into NDs, it does show the ability to disrupt the flFBD-cytP450 complex. This is demonstrated by the restoration of signal intensities of flFBD residues, particularly, looking at Gly-89 (Fig. 3) which is a residue in loop 1 of flFBD which coordinates the FMN cofactor and has been previously implicated in binding to cytP450.[10] By analyzing the signal intensity and linewidth of this residue, we obtained information about its chemical environment and the timescale of its dynamics. Upon addition of cytP450, the resonance broadens, and the intensity decreases (Fig. 3, orange). Adding in a substrate did not significantly change the peak intensity for any of the substrates chosen for G89 of flFBD. Upon cytb5 incorporation into the nanodisc, G89’s linewidth and signal intensity were greatly restored (bottom row, Fig. 3). Meanwhile other residues on flFBD that are farther away from the interaction like S123, undergo some changes but these are much more consistent with the nanodisc containing a larger complex’s tumbling rate rather than direct interaction with cytP450. Fig. 4 displays the linewidths of G89 and other important loop residues to illustrate the line broadening upon the addition of cytP450 to flFBD in ND and the restoration after the addition of cytb5 to the complex in NDs.
Figure 4. Loops of flFBD reveal changes in its complexation state.

(A) Changes in signal intensities measured from TROSY-HSQC spectra of flFBD for its four loop regions which coordinate its FMN cofactor. Each color represents the different states of flFBD as indicated. (inset) The loop regions in the structure are highlighted with loop 1 (red), loop 2 (green), loop 3 (blue), and loop 4 (magenta). B-E. 15N spectral slices extracted from 2D TROSY-HSQC spectra reveal broadening and restoration of signals for representative peaks of each loop; red trace is for flFBD alone in the ND. The error bars were determined from the standard deviation of the average from the selected residues of each loop (Table S1).
Studying the ternary complexes incorporated into lipid nanodiscs allowed us to capture some interesting behavior of cytP450’s preference for its redox partners. While cytb5 is still able to dislodge flFBD from a complex with cytP450, it is not to as great of an extent as it could in the absence of lipids in solution. Having the three proteins being spatially confined in a nanodisc could contribute to keeping flFBD bound to cytP450 better, but it is currently unclear to assign that to the influence of lipids on complex strength or the physical restraint of motion. The variety of substrates utilized in this study all behaved similarly in regard to forming a stronger complex with cytb5-cytP450, however, it was much less of an effect than what was seen in lipid-free solution [23]. flFBD was able to dislodge cytb5 from its complex with cytP450, but not completely. The highest effect was seen without substrates and flFBD was only able to slightly disrupt the complex in the presence of substrates.
One of the more interesting comparisons from this study includes the two inhibitors 4-CPI and 1-CPI in the presence of 15N-flFBD-ternary complex. In agreement with Zhao et al., we have found major differences in the interactions between cytP450 and flFBD in the presence of 1-CPI versus 4-CPI, even with their structural similarity.[30] Crystal structures of cytP450 2B4 have been solved in the presence of both inhibitors which revealed very different active site conformations. The calculated active site volume for 4-CPI was 200 Å versus 280 Å for 1-CPI bound cytP450 2B4. Our NMR data reveal that there is an increased binding and tighter complex formation between cytP450 2B4 and flFBD after the 1-CPI inhibitor addition which is in agreement with the ITC experiments performed by Zhao et al.[30] Figure 4 and Figures S29–S31 show the average signal intensities for each of the four loops that coordinate the FMN cofactor. The residues in each loop are listed in Supplemental Table 1. In the presence of 4-CPI binding to cytP450, all loops are only slightly affected. In comparison, in the presence of 1-CPI binding to cytP450, loop 2 on flFBD is strongly affected. Even the addition of cytb5 does not completely restore the signal intensity of loop 2 in the 1-CPI complex sample.
Interestingly this data reveals more residues binding of flFBD to cytP450 which was recently reported.[9] In the presence of membrane, flFBD binds to cytP450 with all four loops that surround the FMN. The major takeaway from this study is that in the presence of lipid membrane, this dynamic interplay approaches what is thought to be more physiological behavior. Although the full-length CPR is not utilized in this study, we expect a similar trend of behavior as reported recently[24] with all variants behaving similarly and having their ability to compete cytb5 for binding to cytP450 to increase in the presence of a lipid environment. Without being reconstituted in a lipid nanodisc, flFBD cannot dislodge cytb5 from binding to cytP450. Physiologically, if cytb5 is bound to cytP450 before the first electron can be donated by CPR, then the catalytic cycle ceases. Cytb5 is incapable of donating the first electron due to the disparity in redox potentials. Without the dynamic exchange between redox partner binding, drug metabolism slows or even halts. Here we see signs that add to the prevailing hypothesis that cytb5 plays not only an electron donating role, but also has conformational contributions to influencing cytP450’s behavior. A myriad of studies has illustrated that while holo-cytb5 has the largest effect, mainly an increase, in substrate turnover, apo-cytb5 as well as other metal substituted porphyrins, also have a sizeable contribution to cytP450’s substrate metabolism that is independent of the electron transfer ability.[31–32] In this study, we carry out all NMR experiments with oxidized proteins and an absence of reductants. Due to the inability of cytb5 to donate electrons to cytP450, we can assume that some conformational effects are at play.
In conclusion, as shown through NMR results, the dynamic exchange between cytP450, flFBD, and cytb5 is highly affected by the presence of a lipid environment. Cytb5 dominates the competition by weakening the flFBD’s complex with cytP450. In membrane, flFBD is more able to disrupt the cytb5-cytP450 complex than in the absence of lipids albeit not completely. The addition of substrates reveals differences in redox partner binding to cytP450 as well as the skewing of the interplay to favor cytb5 over flFBD binding. This study emphasizes the need to study these proteins in a membrane environment to fully capture their native behaviors. While the use of nanodiscs enables the probing of dynamic interactions between monomers by avoiding oligomerization and with the large patches of charged residues in the soluble domains favoring electrostatic interaction driven complex formation and native-like orientation in lipid-nanodiscs, the presence of sample heterogeneity is unavoidable. Therefore, it is worthwhile to further investigate the effect of sample heterogeneity using NMR, electron transfer kinetics and drug metabolism experiments with the ternary protein complex.
Supplementary Material
Acknowledgements
This study was supported by NIH funding.
Footnotes
Electronic Supplementary Information (ESI) available: [details of any supplementary information available should be included here]. See DOI: 10.1039/C9CC05904K
Conflicts of interest
There are no conflicts to declare.
Notes and references
- 1.Guengerich FP, Mol. Interventions, 2003, 3, 194. [DOI] [PubMed] [Google Scholar]
- 2.Barnaba C, Gentry K, Sumangala N and Ramamoorthy A, F1000 Research, 2017, 6, 662. [DOI] [PMC free article] [PubMed] [Google Scholar]
- 3.Guengerich FP, Chem. Res. Toxicol, 2008, 21, 70. [DOI] [PubMed] [Google Scholar]
- 4.Guengerich FP, Wu ZL and Bartleson CJ, Biochem. Biophys. Res. Commun, 2005, 338, 465. [DOI] [PubMed] [Google Scholar]
- 5.Dürr UH, Waskell L and Ramamoorthy A, Biochim. Biophys. Acta, 2007, 1768, 3235. [DOI] [PubMed] [Google Scholar]
- 6.Im SC and Waskell L, Arch. Biochem. Biophys, 2011, 507, 144. [DOI] [PMC free article] [PubMed] [Google Scholar]
- 7.Wang M, Roberts DL, Paschke R, Shea TM, Masters BS, and Kim JJ, Proc. Natl. Acad. Sci. U. S. A, 1997, 94, 8411. [DOI] [PMC free article] [PubMed] [Google Scholar]
- 8.Estrada DF, Laurence JS, Scott EE, J.Biol.Chem, 2016, 291, 3990. [DOI] [PMC free article] [PubMed] [Google Scholar]
- 9.Mahajan M, Ravula T, Prade E, Anantharamaiah GM, Ramamoorthy A, Chem. Commun, 2019, 55, 5777. [DOI] [PMC free article] [PubMed] [Google Scholar]
- 10.Prade E, Mahajan M, Im S-C, Zhang M, Gentry KA, Anantharamaiah GM, Waskell L, Ramamoorthy A, Angew. Chem. 2018, 57, 8458. [DOI] [PMC free article] [PubMed] [Google Scholar]
- 11.Zhang H, Hamdane D, Im SC and Waskell L, J. Biol. Chem, 2008, 283, 5217. [DOI] [PubMed] [Google Scholar]
- 12.Yang Y, Zhang H, Usharani D, Bu W, Im S, Tarasev M, Rwere F, Pearl NM, Meagher J, Sun C, Stuckey J, Shaik S, and Waskell L, Biochemistry, 2014, 53, 5080. [DOI] [PMC free article] [PubMed] [Google Scholar]
- 13.Yamazaki H, Nakamura M, Komatsu T, Ohvama K, Hatanaka N, Asahi S, Shimada N, Guengerich FP, Shimada T, Nakajima M, and Yokoi T, Protein Expression Purif, 2002, 24, 329. [DOI] [PubMed] [Google Scholar]
- 14.Chiang JY, Arch. Biochem. Biophys, 1981, 211, 662. [DOI] [PubMed] [Google Scholar]
- 15.Schenkman JB and Jansson I, Pharmacol. Ther, 2003, 97, 139. [DOI] [PubMed] [Google Scholar]
- 16.Estrada DF, Skinner AL, Laurence JS and Scott EE, J. Biol. Chem, 2014, 289, 14310. [DOI] [PMC free article] [PubMed] [Google Scholar]
- 17.Duggal R, Denisov IG, Sligar SG, FEBS Lett, 2018, 592, 228. [DOI] [PMC free article] [PubMed] [Google Scholar]
- 18.Monk BC, Tomasiak TM, Keniya MV, Huschmann FU, Tyndall JD, O’Connell JD 3rd, Cannon RD, McDonald JG, Rodriguez A, Finer-Moore JS, Stroud RM, P.N.A.S, 2014, 111, 3865. [DOI] [PMC free article] [PubMed] [Google Scholar]
- 19.McDougle DR, Baylon JL, Meling DD, Kambalyal A, Grinkova YV, Hammernik J, Tajkhorshid E, Das. A, Biochem. Biophys. Acta Biomembr, 2015, 1848, 2460. [DOI] [PMC free article] [PubMed] [Google Scholar]
- 20.Baylon JL, Lenov IL, Sligar SG, and Tajkhorshid E, J. Am. Chem. Soc, 2013, 135, 8542. [DOI] [PMC free article] [PubMed] [Google Scholar]
- 21.Ravula T, Barnaba C, Mahajan M, Anantharamaiah GM, Im S-C, Waskell L, Ramamoorthy A, Chem. Commun. 2017, 53, 12798. [DOI] [PMC free article] [PubMed] [Google Scholar]
- 22.Denisov IG, Sligar SG, Biochim. Biophys. Acta, 2011, 1814, 223. [DOI] [PMC free article] [PubMed] [Google Scholar]
- 23.Scott EE, White MA, He YA, Johnson EF, Stout CD, Halpert JR, J. Biol. Chem, 2004, 279, 27294. [DOI] [PubMed] [Google Scholar]
- 24.Gentry KA, Zhang M, Im S-C, Waskell L, Ramamoorthy A, Chem. Commun. 2017, 54, 5780. [DOI] [PMC free article] [PubMed] [Google Scholar]
- 25.Zhang M, Huang R, Ackerman R, Im S-C, Waskell L, Schwendeman A, Ramamoorthy A, Angew. Chem, 2016, 55, 4497. [DOI] [PubMed] [Google Scholar]
- 26.Zhang M, Le Clair SV, Huang R, Ahuja S, Im S-C, Waskell L, Ramamoorthy A, Sci. Rep, 2015, 5, 8392. [DOI] [PMC free article] [PubMed] [Google Scholar]
- 27.Ahuja S, Jahr N, Im S-C, Vivekanandan S, Popovych N, Le Clair S, Huang R, Soong R, Xu J, Yamamoto K, Nanga RPR, Bridges A, Waskell L, Ramamoorthy A, J. Biol. Chem, 2013, 288, 22080. [DOI] [PMC free article] [PubMed] [Google Scholar]
- 28.Paloncyova M, DeVane R, Murch B, Berka K, Otyepka M, J. Phys. Chem. B, 2014, 118, 1030. [DOI] [PubMed] [Google Scholar]
- 29.Nagar S, Korzekwa K, Drug Metab. Dispos, 2012, 40, 1649. [DOI] [PubMed] [Google Scholar]
- 30.Zhao Y, Sun L, Muralidhara BK, Kumar S, White MA, Stout CD, Halpert JR, Biochemistry, 2007, 46, 11559. [DOI] [PMC free article] [PubMed] [Google Scholar]
- 31.Murataliev MB, Guzov VM, Walker FA, Feyereisen R, Insect Biochem. Mol. Biol, 2008, 38, 1008. [DOI] [PMC free article] [PubMed] [Google Scholar]
- 32.Yamazaki H, Shimada T, Martin MV, Guengerich FP, J. Biol. Chem, 2001, 276, 30885. [DOI] [PubMed] [Google Scholar]
Associated Data
This section collects any data citations, data availability statements, or supplementary materials included in this article.