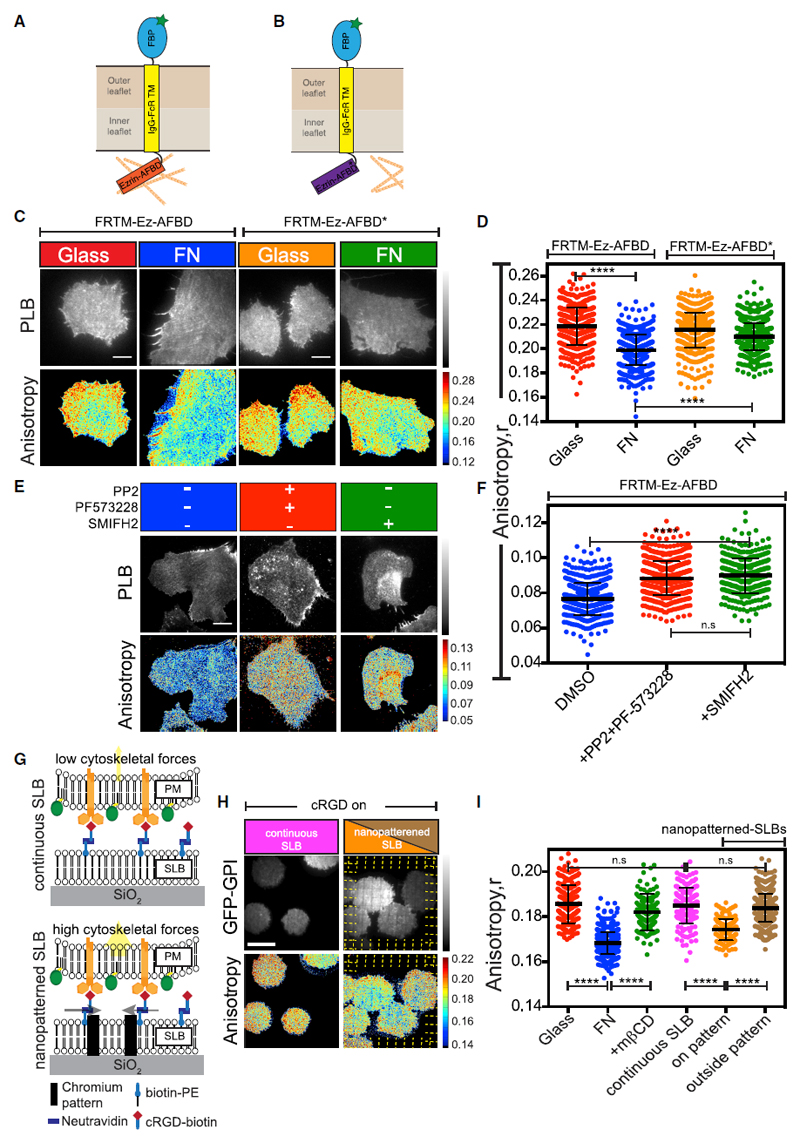
Figure 4. Integrin Activation Triggers Changes in Dynamic Actin Activity and Requires cRGD Ligand Immobilization.
(A and B) Schematic of the model transmembrane protein FRTM-Ezrin-AFBD (A) and the mutant FRTM-Ezrin-R579A (FRTM-Ez-AFBD*) (B) that impairs Ezrin-AFBD ability to interact with actin (Gowrishankar et al., 2012).
(C–F) Representative intensity and steady-state anisotropy images and scatter dot plots with mean anisotropy of ROIs obtained from CHO cells stably expressing either FRTM-Ez-AFBD or FRTM-Ez-AFBD* as indicated. The cells were labeled with fluorescent folate, Pteroyl-lysyl-Bodipy(PLB) and plated on FN (blue, green) or glass (red, orange) prior to imaging in the absence (C and D) or after pre-treatment (E and F) with either 20 μM PP2 and 10 μM PF-573228 (red) or 10 μM SMIFH2 (green) or with the vehicle (DMSO; blue).
(G–I) Schematic (G) of the supported lipid bilayer functionalized with cRGD that was prepared either on plain (continuous SLB; top) or on 5-nm-tall and 100-nm-wide chromium patterned (nanopatterned SLB, bottom) glass surfaces. (H and I) GFP-GPI-expressing CHO cells plated on glass (red) or on FN (blue) or treated with 10 mM mβCD on FN (green) or plated on either continuous SLBs with mobile ligand (magenta) or SLBs assembled on chromium nano-patterned surfaces. ROIs were drawn either on the pattern (orange) where the ligand is transiently immobile or from regions outside (brown) where the ligand is mobile.
Scale bar 10μm in all panels. All error bars represent SD. n.s. p > 0.05, *p ≤ 0.05, **p ≤ 0.01, ***p ≤ 0.001, ****p ≤ 0.0001. Sample size and p values are provided in Table S4.
See also Figure S4.

