

Abstract
Mitochondria undergo morphological and dynamic changes in response to environmental stresses. Few studies have focused on addressing mitochondrial remodeling under stress. Using the fission yeast Schizosaccharomyces pombe as a model organism, here we investigated mitochondrial remodeling under glucose starvation. We employed live-cell microscopy to monitor mitochondrial morphology and dynamics of cells in profusion chambers under glucose starvation. Our results revealed that mitochondria fragment within minutes after glucose starvation and that the dynamin GTPase Dnm1 is required for promoting mitochondrial fragmentation. Moreover, we found that glucose starvation enhances Dnm1 localization to mitochondria and increases the frequency of mitochondrial fission but decreases PKA activity. We further demonstrate that low PKA activity enhances glucose starvation–induced mitochondrial fragmentation, whereas high PKA activity confers resistance to glucose starvation–induced mitochondrial fragmentation. Moreover, we observed that AMP-activated protein kinase is not involved in regulating mitochondrial fragmentation under glucose starvation. Of note, glucose starvation–induced mitochondrial fragmentation was associated with enhanced reactive oxygen species production. Our work provides detailed mechanistic insights into mitochondrial remodeling in response to glucose starvation.
Keywords: mitochondria, stress, glucose, dynamin, fungi
Introduction
Carbon sources are fundamental for life. Generally, cells consume glucose to produce ATP through glycolysis in the cytoplasm and/or through oxidative phosphorylation in mitochondria. Mitochondria serve as not only the power plants of the cell but also as a metabolic hub. Therefore, proper mitochondrial function is crucial for maintaining cellular energy hemostasis. Many studies have revealed that nutrient availability dictates mitochondrial morphology and dynamics in different types of cells, including budding yeast, pancreatic β cells, and mouse embryonic fibroblasts (1–5). However, it has remained controversial whether poor nutrient conditions leads to fragmented mitochondria because seemingly opposite conclusions have been made in different studies (1, 3–5). For example, on one hand, excessive glucose, along with high fat, has been reported to cause mitochondrial fragmentation in β cells (4); on the other hand, glucose depletion has been reported to enhance mitochondrial fragmentation in mouse embryonic fibroblasts (5). Therefore, the response of mitochondria to glucose availability is still unclear.
Mitochondria are dynamic organelles undergoing constant fusion and fission within the cell. The conserved dynamin GTPase Drp1 (Dnm1 in yeasts) is responsible for mitochondrial fission and is recruited to mitochondria by the mitochondrial adaptor proteins Fis1, MFF, MiD49, and MiD51 (6, 7), whereas mitofusins (MFN1/2) and the dynamin family GTPase Opa1 are responsible for mitochondrial fusion (7, 8). The balance between mitochondrial fusion and fission gives rise to specific morphological patterns of mitochondria in a cell type–dependent manner. Generally, enhanced mitochondrial fission and/or inhibited mitochondrial fusion leads to mitochondrial fragmentation, whereas the opposite causes elongated mitochondria. Although some progress has been made to establish the connection between mitochondrial dynamics and glucose availability (4, 5), how mitochondria respond to the changes of glucose availability is unclear.
The fission yeast Schizosaccharomyces pombe is an excellent model organism for studying mitochondrial dynamics because of the relatively simple organization of the mitochondrial network and the availability of many genetic tools (9). In addition, most of the proteins regulating mitochondrial dynamics are conserved through evolution. Moreover, fission yeast has been developed as a model organism to characterize glucose metabolism (10), and a glucose concentration of 4.4–5.5 mm has been identified as the critical concentration for promoting cell growth (11). These findings make it convenient to delineate how mitochondria respond to the availability of glucose.
In this work, we employed live-cell microscopy to monitor mitochondrial morphology in response to glucose starvation. Our work demonstrates that mitochondrial fragmentation takes place within minutes in a Dnm1-dependent manner after glucose starvation. We further showed that PKA activity, but not AMPK,4 is involved in regulating glucose starvation-induced mitochondrial fragmentation. Therefore, this work provides mechanistic insights into mitochondrial fragmentation that is triggered by glucose starvation.
Results
Glucose starvation leads to mitochondrial fragmentation
To examine the effect of glucose starvation on mitochondria, we employed live-cell microscopy to monitor mitochondria (marked by Cox4-GFP, a mitochondrial matrix protein). Fission yeast cells were first grown in the defined medium Edinburg minimal medium (EMM) containing 2% glucose (111.1 mm) and the cells at exponential phase were then attached to the coverslips of profusion chambers for imaging. Images were acquired upon replacement of EMM containing 111.1 mm glucose (referred to as glucose-rich EMM) with glucose-free EMM. As shown in Fig. 1A, approximately two to three tubular mitochondrial structures were seen in cells grown in glucose-rich EMM (i.e. 0 min), whereas mitochondrial fragmentation became noticeable after 10 min of growing the cells in glucose-free EMM. Mitochondrial fragmentation was enhanced over time and could be reversed by glucose replenishment within ∼10 min. This result suggests that glucose starvation induces mitochondrial fragmentation within minutes in fission yeast cells.
Figure 1.

Mitochondrion numbers increase during glucose starvation. A, maximum projection time-lapse images of WT cells expressing GFP-Cox4. Cells incubated in EMM containing 111.1 mm glucose (without supplements) were attached to a coverslip coated with 5 mg/ml poly-l-lysine in a profusion chamber. Cells were then washed once with EMM containing glucose at the indicated concentration before medium replacement. Time-lapse imaging was performed to monitor mitochondrial dynamics. Note that mitochondrion numbers increased upon glucose starvation and decreased after replenishment of glucose. DIC, differential interference contrast. Scale bar = 5 μm. B, diagram illustrating quantification of mitochondrion numbers using the algorithm MiNA in ImageJ. Red arrows indicate two tubular mitochondria. C, plot of mitochondrion numbers against time. Time-lapse movies as indicated in A were used for analysis, and 22 cells at each time point were analyzed. Data represent mean ± S.D. Statistical analysis was performed by one-way repeated measurements ANOVA (p < 0.001), followed by Tukey honest significance difference test (*, p < 0.01; **, p < 0.001; versus the 0-min group). D, maximum projection time-lapse images of WT cells expressing GFP-Cox4. Cells grown in EMM containing glucose at the indicated concentrations in profusion chambers were imaged. Note that mitochondrion numbers increased significantly when cells were cultured in EMM containing glucose at 0 mm and 1.1 mm but not at 4.4 mm, 11.1 mm, and 111.1 mm. Scale bars = 5 μm. E, plots of mitochondrion numbers against time. Time-lapse movies as indicated in D were used for analysis, and 18 cells at each time point were analyzed. Data represent mean ± S.D. Statistical analysis was performed by two-way repeated measurements ANOVA (**, p < 0.001, versus 0 mm; n.s., not significant).
To be unbiased for analysis of imaging data, we took an automated method to quantify mitochondrion numbers by using the MiNA algorithm developed previously (12). Briefly, maximum projection images of mitochondria were first binarized and then skeletonized for quantification of mitochondrion numbers (Fig. 1B). The quantification results confirmed that mitochondrion numbers increased gradually after glucose starvation and were restored after glucose replenishment (Fig. 1C). It has been shown that fission yeast cells in medium containing 4.4 mm glucose or more grow equally fast as in medium containing 111.1 mm glucose but divide stochastically in length in medium containing 1.1 mm glucose (10). We then asked whether the identified critical concentration of glucose (i.e. 4.4 mm) is also a critical factor in determining mitochondrial morphology. To address this question, we examined mitochondria in cells in EMM containing 111.1, 11.1, 4.4, 1.1, and 0 mm glucose. As shown in Fig. 1, D and E, mitochondrial fragmentation was not detected in cells cultured in EMM containing 111.1, 11.1, and 4.4 mm glucose but became apparent in cells cultured in EMM containing 1.1 and 0 mm glucose. These results suggest that 4.4. mm is a critical concentration of glucose in maintaining tubular mitochondrial structures. Given the similar mitochondrial response in EMM containing 1.1 mm and 0 mm glucose, we used glucose-free EMM for all glucose starvation experiments shown below.
Glucose starvation increases the frequency of mitochondrial fission but not mitochondrial fusion
Glucose starvation–induced mitochondrial fragmentation could be caused by enhanced mitochondrial fission and/or inhibited mitochondrial fusion. To test this hypothesis, we quantified mitochondrial fusion and fission events in each cell within the first 20 min after replacement of glucose-rich EMM (111.1 mm glucose) with glucose-free EMM. Intriguingly, mitochondria in cells growing in glucose-free EMM became more dynamic and underwent more frequent fission than mitochondria in cells growing in glucose-rich EMM (Fig. 2A). Quantification confirmed that glucose starvation caused a 2-fold increase in the frequency of mitochondrial fission but did not appear to affect mitochondrial fusion (Fig. 2, B and C). Hence, we concluded that glucose starvation–induced mitochondrial fragmentation is due to enhanced mitochondrial fission.
Figure 2.

Glucose starvation enhances mitochondrial fission. A, maximum projection time-lapse images of WT cells expressing GFP-Cox4. Cells were cultured in EMM containing 111.1 mm and 0 mm glucose. Green and red arrows indicate mitochondrial fusion and fission, respectively. Shown on the left are time-lapse images at 5-min intervals. Time-lapse images on the right are the images between the 10-min and 15-min time points (red dashed rectangle). Scale bars = 10 μm. B and C, dot plots of mitochondrial fission (B) and fusion (C) frequencies. Time-lapse images as indicated in A were used for analysis. The p values were calculated by Student's t test, and n indicates cell number.
Dnm1 is required for mediating mitochondrial fragmentation upon glucose starvation
The dynamin-related GTPase Dnm1 (Drp1 in mammalian cells) is the master regulator of mitochondrial fission and is recruited to mitochondria by Fis1 via Caf4 (13, 14). Therefore, we further asked whether and how Dnm1 contributes to glucose starvation–induced mitochondrial fragmentation. We employed live-cell microscopy to monitor mitochondrial morphology in dnm1Δ cells upon replacement of glucose-rich EMM with glucose-free EMM. In glucose-rich EMM, mitochondria in dnm1Δ cells displayed an intact interconnected structure because of impairment of mitochondrial fission (Fig. 3A, 0 min). Throughout the period of glucose starvation, mitochondria in dnm1Δ cells did not appear to fragment but shrunk over time (Fig. 3A). Intriguingly, many furrows appeared along the shrinking mitochondria, indicative of incomplete mitochondrial constriction in the absence of Dnm1 during glucose starvation (Fig. 3A). Further, quantification confirmed that mitochondrion numbers remained largely unchanged during glucose starvation (Fig. 3B). These results suggested that Dnm1 is required for promoting mitochondrial fragmentation during glucose starvation.
Figure 3.

Glucose starvation–induced mitochondrial fragmentation depends on Dnm1. A, maximum projection time-lapse images of dnm1Δ cells expressing GFP-Cox4. dnm1Δ cells were cultured in EMM lacking glucose in profusion chambers. One cell (highlighted by the dashed rectangle in the differential interference contrast (DIC) image) is shown in the bottom panel at 2-min intervals. Note that mitochondria in dnm1Δ cells resisted fragmentation induced by glucose starvation, but incomplete mitochondrial constriction took place in dnm1Δ cells after prolonged glucose starvation. Scale bar = 10 μm. B, plot of mitochondrion numbers against time. Time-lapse images as indicated in A were used for quantification, and 18 cells were analyzed at each time point for each group. Data represent mean ± S.D. For comparison, the same WT plot (0 mm) as in Fig. 1E was used, and statistical analysis was performed by two-way repeated measurements ANOVA (p < 0.001). C, maximum projection images of WT cells expressing GFP-Cox4 and Dnm1-TagRFP. WT cells, initially cultured in EMM containing 111.1 mm glucose, were washed with and then cultured in glucose-free EMM, followed by imaging at the indicated time. Note that Dnm1-TagRFP signals in the cells increased after glucose starvation. Scale bars = 10 μm. D, dot plots of the average pixel intensity of Dnm1-TagRFP that localized along mitochondria at the indicated time points. The p values (*, p < 0.01, versus 0 min) were calculated by Student's t test, and cell number is indicated.
Next we examined the localization of Dnm1 to mitochondria. Fluorescently tagging Dnm1 either at the N terminus or the C terminus appeared to affect its function because cells expressing fluorescently tagged Dnm1 displayed defective mitochondrial fission, a phenotype similar to the one caused by the absence of Dnm1 (Fig. S1). To overcome this issue, we kept the endogenous Dnm1 and ectopically expressed Dnm1-TagRFP from an ase1 promoter. Because Dnm1 function as oligomers to constrict mitochondria (15, 16), the presence of both endogenous Dnm1 and Dnm1-TagRFP in Dnm1 oligomers may enable the complex to be functional and visible. Indeed, mitochondria in cells expressing endogenous Dnm1 and Dnm1-TagRFP underwent fission and fusion, indicative of proper function of Dnm1 oligomers. By using this coexpression strategy and live-cell microscopy, we monitored the localization of Dnm1 during glucose starvation. As shown in Fig. 3C, multiple Dnm1 foci were present on mitochondria before glucose starvation, and the signals of the Dnm1 foci became much brighter after glucose starvation. To confirm the observation, we quantified the average Dnm1 intensity on mitochondria (i.e. dividing the integrated intensity of Dnm1 on mitochondria by the mitochondrial area). Consistently, most of the cells displayed a stronger average intensity of Dnm1 on mitochondria after glucose starvation (Fig. 3D). Taken together, these results suggest that glucose starvation likely enhances the localization of Dnm1 to mitochondria to promote mitochondrial fragmentation.
Protein kinase A is involved in regulating mitochondrial fragmentation under glucose starvation
PKA regulates the activity of Drp1 (the ortholog of Dnm1 in mammalian cells) by phosphorylation in response to stress (25, 37). We then asked whether the fission yeast PKA is also involved in regulating glucose starvation–induced mitochondrial fragmentation.
It has been established that a glucose-sensing PKA pathway is present in fission yeast to regulate glucose metabolism in response to altered availability of extracellular glucose (17–19). In such a pathway, the adenylate cyclase Cyr1 mediates production of the second messenger cAMP, and the association of cAMP with the inhibitory subunit of PKA (i.e. Cgs1) subsequently separates Cgs1 from the catalytic subunit of PKA (i.e. Pka1), allowing activation of Pka1 (20–22). By using a β-gal assay as reported previously (17, 23, 24), we first confirmed that the absence of Cyr1 reduces Pka1 activity, whereas the absence of Cgs1 elevates Pka1 activity (Fig. 4C). We then assessed the effects of altered Pka1 activity on glucose starvation–induced mitochondrial fragmentation by live-cell microscopy. As shown in Fig. 4, A and B, mitochondria appeared to be resistant to fragmentation in cgs1Δ cells (high Pka1 activity), whereas mitochondria appeared to be prone to fragmentation in cyr1Δ cells (low Pka1 activity). These results established a connection between Pka1 activity and glucose starvation–induced mitochondrial fragmentation. It is likely that low Pka1 activity promotes mitochondrial fragmentation. Indeed, β-galactosidase assays showed that Pka1 activity decreased significantly after glucose starvation (Fig. 4D). In mammalian cells, PKA phosphorylates Drp1 at Ser-637 to prevent Drp1 from localizing to mitochondria, inhibiting mitochondrial fission (3, 5, 25–27). Interestingly, Ser-637 is not conserved in Dnm1, the fission yeast counterpart of Drp1. Nevertheless, multiple PKA phosphorylation sites (i.e. Thr-75, Ser-203, Ser-398, Ser-643, and Ser-768) were predicted to be present in Dnm1 by using the bioinformatics tool group-based prediction system (28). Therefore, it is possible that the decreased Pka1 activity caused by glucose starvation enhances the localization of Dnm1 to mitochondria through phosphoregulation of Dnm1 to promote mitochondrial fission (Fig. 3, C and D). Consistently, we found that, even in glucose-rich EMM, cyr1Δ cells (i.e. low Pka1 activity) showed fragmented mitochondrial structures, whereas, similar to WT cells, cgs1Δ cells displayed tubular mitochondrial structures (Fig. 4, E and F). Taken together, we concluded that PKA signaling plays a critical role in regulating mitochondrial dynamics under glucose starvation.
Figure 4.

PKA is involved in regulating glucose starvation–induced mitochondrial fragmentation. A, maximum projection time-lapse images of WT, cgs1Δ, and cyr1Δ cells expressing GFP-Cox4. Cells initially inoculated in EMM containing 111.1 mm glucose were washed with glucose-free EMM, and then live-cell imaging was performed to monitor the mitochondrial dynamics of cells in glucose-free EMM. Note that mitochondria became fragmented rapidly after glucose starvation in cyr1Δ cells, whereas mitochondrion numbers increased more slowly in cgs1Δ cells after glucose starvation. Scale bar = 10 μm. DIC, differential interference contrast. B, plots of mitochondrion numbers against time. Time-lapse images as indicated in A were used for quantification, and18 cells were analyzed at each time point for each group. Data represent mean ± S.D. For comparison, the same WT plot (0 mm) as in Fig. 1E was used, and statistical analysis was performed by two-way repeated measurements ANOVA (*, p = 0.011; **, p < 0.001; versus WT). C, β-gal activity of WT, cgs1Δ, and cyr1Δ cells. Note that the β-gal activity of the mutant cells was normalized to the β-gal activity of WT cells (displayed as -fold change). Five independent experiments were performed. Error bars represent confidence intervals. Single-group Student's t test was used to calculate the p values of log -fold change for each group. D, β-gal activity of WT cells starved in glucose-free EMM for the indicated time. Three independent experiments were performed. Note that the β-gal activity was normalized to the β-gal activity of the cells measured at 0 min (displayed as -fold change). Error bars are confidence intervals. Single-group Student's t test was used to calculate the p values of log -fold change for each group. E, maximum projection images of WT, cgs1Δ, and cyr1Δ cells expressing GFP-Cox4. Cells were cultured in EMM containing 111.1 mm glucose. Scale bars = 10 μm. Magnified images (×1.9) for the cells indicated by red dashed lines are shown on the right, and the white scale bars indicate 5 μm. F, quantification of mitochondrion numbers in the indicated cells. The p values were determined by Student's t test; n.s., not significant. Cell number analyzed is indicated at the top of the graph.
AMPK is not involved in regulating mitochondrial fragmentation under glucose starvation
AMPK is another important metabolic sensor that is activated when the intracellular ATP level decreases. It has been reported that AMPK promotes mitochondrial fission by phosphorylating Mff, the mitochondrial receptor of Drp1 (29). AMPK comprises three subunits: the regulatory subunits Amk2 and Cbs2 and the catalytic subunit Ssp2 (30).
To assess whether AMPK is also involved in regulating mitochondrial fragmentation under glucose starvation, we performed time-lapse imaging to examine mitochondrial morphology in WT, amk2Δ, cbs2Δ, and ssp2Δ cells after glucose starvation. As shown in Fig. 5A, the changes in mitochondrial morphology were similar within 40 min of glucose starvation in the three mutant and WT cells (Fig. 5, A and B). Indeed, no noticeable change in mitochondrial morphology or altered mitochondrion numbers were found in the three mutant cells cultured in glucose-rich EMM (Fig. 5, C and D). Therefore, it is unlikely that AMPK is involved in regulating mitochondrial morphology under glucose starvation, at least in fission yeast.
Figure 5.

AMPK is not involved in regulating glucose starvation–induced mitochondrial fragmentation. A, maximum projection time-lapse images of WT, amk2Δ, cbs2Δ, and ssp2Δ cells expressing GFP-Cox4. The cells, initially inoculated in EMM containing 111.1 mm glucose, were washed with glucose-free EMM, and time-lapse imaging was performed to monitor the mitochondrial dynamics of cells in glucose-free EMM. Scale bars = 10 μm. DIC, differential interference contrast. B, plots of mitochondrion number against time. Time-lapse images as shown in A were used for quantification, and 18 cells were analyzed at each time point for each group. Data represent mean ± S.D. Statistical analysis was performed by two-way repeated measurements ANOVA (n.s., not significant, versus WT). C, maximum projection images of WT, amk2Δ, cbs2Δ, and ssp2Δ cells expressing GFP-Cox4. Cells were cultured in EMM containing 111.1 mm glucose medium. Scale bars = 10 μm. D, quantification of mitochondrion numbers in the indicated cells. The p values were determined by Student's t test. Cell number analyzed is indicated at the top of the graph.
Glucose starvation increases intracellular ROS levels
To appreciate the biological significance of mitochondrial fragmentation caused by glucose starvation, we assessed reactive oxygen species (ROS) levels within the cell with DCDHF-DA, a ROS indicator (31). Of interest, ∼50% of WT cells displayed DCDHF-DA staining after 1 h of glucose starvation, whereas few WT cells were stained by DCDHF-DA in glucose-rich medium (Fig. 6, A and B), suggesting that ROS production is significantly enhanced by glucose starvation. This enhanced ROS production may be due to mitochondrial fragmentation induced by glucose starvation. To test this idea further, we also stained dnm1Δ cells, in which glucose starvation–induced mitochondrial fragmentation was inhibited (Fig. 3, A and B), cultured in glucose-rich and glucose-free media with DCDHF-DA. As shown in Fig. 6, A and B, ROS production under glucose starvation was reduced, but not abolished, in the absence of Dnm1 because only ∼25% of dnm1Δ cells were DCDHF-DA–positive after glucose starvation. Because mitochondria are the main source of ROS production through the respiratory chain (32), it is likely that glucose starvation enhances oxidative phosphorylation by promoting mitochondrial fragmentation. The DCDHF-DA staining result for dnm1Δ cells also suggests the existence of a Dnm1/fission-independent mechanism underlying ROS production induced by glucose starvation.
Figure 6.
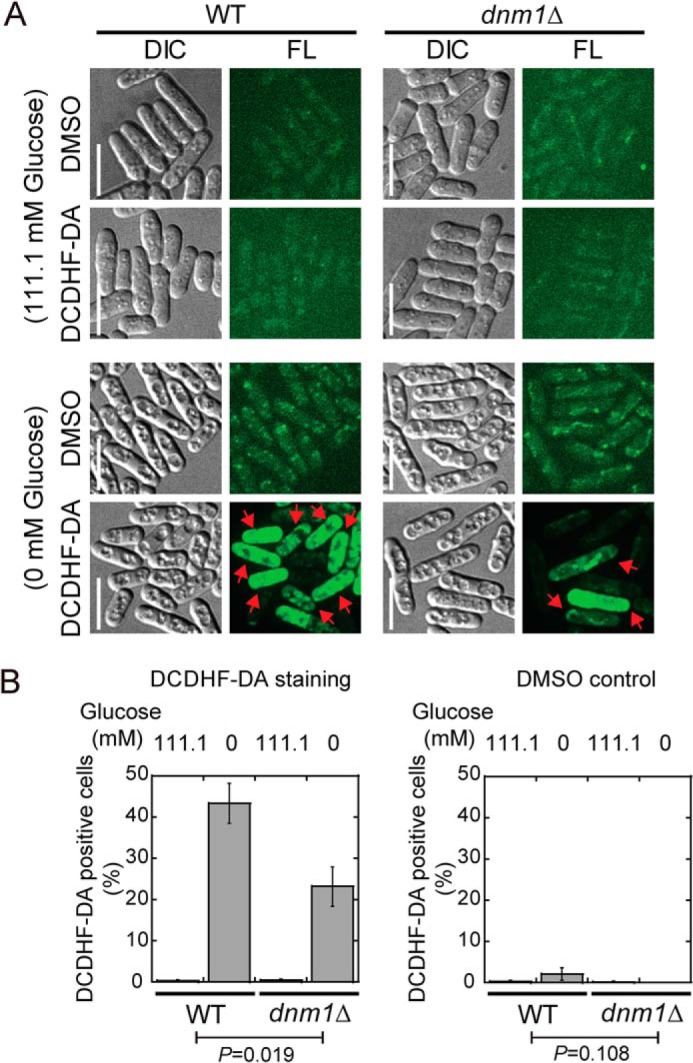
Glucose starvation elevates ROS levels. A, maximum projection images of WT and dnm1Δ cells stained with DCDHF-DA (a ROS indicator). Cells were incubated with DCDHF-D or DMSO (control, the solvent of DCDHF-D). Scale bars = 10 μm. DIC, differential interference contrast; FL, fluorescence. B, quantification of the percentage of DCDHF-D–stained cells in A. Three independent experiments were performed, and error bars represent S.D. Two-way repeated measurements ANOVA was performed to determine the p values between the WT and dnm1Δ groups.
Discussion
Mitochondria undergo morphological and dynamic changes in response to environmental stress, and the molecular mechanisms underlying such mitochondrial changes have begun to be revealed (25). However, few studies focused on addressing the rapid changes in mitochondrial morphology and dynamics under stress, and most studies instead focused on the ultimate effects of stress on mitochondrial morphology. Here we employed live-cell microscopy to examine the morphological and dynamic changes in mitochondria under glucose starvation in profusion chambers (Figs. 1 and 2). Our work reveals that mitochondria fragment in a Dnm1-dependent manner within minutes after removal of glucose (Figs. 1 and 3). We further demonstrate that PKA, but not AMPK, is involved in regulating glucose starvation–induced mitochondrial fragmentation (Figs. 4 and 5) and that glucose starvation–induced mitochondrial fragmentation is associated with elevated ROS production (Fig. 6).
Mitochondria respond to environmental stresses by changing their shape and dynamics. Interestingly, many studies have shown that mitochondria form interconnected and elongated structures under stress, indicative of attenuated fission and/or enhanced fusion (3, 5, 33, 34). Similarly, in budding yeast, mitochondria become more complex, with the tubular structure forming many branches in cells grown in medium containing the nonfermentable carbon source glycerol (2). Mitochondria are sensitive organelles. Therefore, culture media containing complex ingredients and culture conditions could have profound effects on mitochondrial morphology and dynamics, which may cause complications in data interpretation. To determine the response of mitochondria to glucose starvation, we cultured fission yeast cells in EMM containing glucose at the indicated concentration and imaged cells at the exponential phase at room temperature in a profusion chamber. Under such carefully controlled conditions, our experiments revealed that fission yeast mitochondria respond to glucose starvation by increasing the fission frequency, leading to rapid fragmentation (within minutes) (Figs. 1, A and C, and 2). The consequences are reversible, as glucose replenishment restores normal tubular mitochondrial morphology within minutes (Fig. 1, A and C). This underscores the robustness of the mechanisms orchestrating glucose sensing and mitochondrial remodeling.
The concentration of glucose in cultured media is a critical factor in dictating the response of mitochondria. We found that glucose at a concentration of less than 4.4 mm, which is close to the blood glucose concentration in humans before breakfast, is required for promoting mitochondrial fragmentation (Fig. 1, D and E). Such a concentration is the threshold concentration of glucose required for normal cell division of fission yeast cells, as shown previously (10, 11, 35). It is therefore conceivable that glucose starvation–induced mitochondrial fragmentation has a detrimental effect on cell growth. In support of this hypothesis, we found that ROS production is greatly enhanced after glucose starvation (Fig. 6). Whether the critical glucose concentration (i.e. 4.4 mm) in human cells also promotes mitochondrial remodeling and affects cell proliferation awaits further study.
Several kinases have been reported to be involved in regulating mitochondrial remodeling in response to stress (19, 25, 29, 36). Among the kinases, PKA phosphorylates Drp1 at Ser-637 to sequester Drp1 in the cytoplasm to inhibit mitochondrial fission (25, 37). Our work showed that PKA, but not AMPK, is involved in regulating mitochondrial fragmentation under glucose starvation (Figs. 4 and 5). First, glucose starvation significantly decreases Pka1 activity (Fig. 4D). Second, consecutive inactivation of Pka1 in cyr1Δ cells enhances mitochondrial fragmentation under glucose starvation and causes mitochondrial fragmentation even under glucose-rich conditions, whereas consecutive activation of Pka1 in cgs1Δ cells confers resistance to mitochondrial fragmentation under glucose starvation (Fig. 4, A–E). Dnm1 is required for promoting mitochondrial fragmentation under glucose starvation (Fig. 3, A and B). Moreover, the localization of Dnm1 to mitochondria is enhanced by glucose starvation (Fig. 3, C and D), correlating well with the decreased Pka1 activity under glucose starvation (Fig. 4D), and Drp1/Dnm1 is a substrate of PKA, as mentioned under “Results.” These findings suggest a possible model in which glucose starvation enhances the mitochondrial localization of Dnm1 by inhibiting the activity of Pka1. Nonetheless, it is worthwhile to test by biochemical approaches whether Dnm1, like its human orthologue Drp1, is a substrate of Pka1.
Four mitochondrial receptor proteins are present in human cells: Fis1, Mff, MiD49, and MiD51 (6, 7). MFF, MiD49, and MiD51, but not Fis1, play major roles in recruiting Drp1 to mitochondria. In contrast, Fis1 is the only reported receptor protein for recruiting Dnm1 to the mitochondrial membrane in yeasts. It has been established that AMPK phosphorylates Mff to promote mitochondrial fission by recruitment of Drp1 to mitochondria (29). This work shows that absence of the three subunits of AMPK (i.e. Amk2, Cbs2, and Ssp2) does not appear to affect mitochondrial fragmentation under glucose starvation and under glucose-rich growth conditions (Fig. 5). We interpreted the ineffectiveness of the AMPK mutants on glucose starvation–induced mitochondrial fragments as lack of a counterpart of Mff in fission yeast. In conclusion, our work demonstrates that mitochondria respond to glucose starvation by rapid fragmentation and that glucose starvation–induced mitochondrial fragmentation depends on Dnm1 and requires proper regulation of PKA activity.
Experimental procedures
Plasmids and yeast strains
Plasmids were created with restrictive enzymes purchased from New England Biolabs. Yeast strains were created either by random spore digestion or tetra-dissection analysis as described before (38). Gene deletion was achieved using the PCR-based homologous recombination method (39). All strains used for glucose starvation are prototrophic to adenine, leucine, uracil, lysine, and histidine (the five supplements generally used in EMM). Therefore, Edinburg minimal medium without the five supplements was used in this study. The plasmids and strains used in this study are listed in the Tables S1 and S2, respectively.
β-galactosidase activity assays
Strains containing the fbp1-LacZ plasmid were cultured in EMM containing 111.1 mm glucose at 30 °C overnight until the cells reached exponential phase. For normal conditions, exponential cells were collected for measuring β-galactosidase activity using a yeast β-galactosidase assay kit (Thermo Scientific) in a 96-well plate as described previously (40). For the starvation conditions, exponential cells were washed three times with the glucose-free medium and then cultured again in glucose-free medium at 30 °C for the indicated time. Cells collected at the indicated time points were kept in liquid N2 and used later for simultaneous measurements of β-galactosidase activity with the yeast β-galactosidase assay kit.
ROS measurement
ROS assays were performed as described previously (31). Briefly, starved and control cells were stained with the ROS indicator dye 2′,7′-dichlorodihydrofluorescein diacetate (DCDHF-DA; Molecular Probes, Eugene, OR) at a working concentration of 10 μg/ml by incubating the cells in the dark at 30 °C for 80 min. The stained cells were then collected by centrifugation and washed twice with ice-cold PBS buffer (pH 7.0), followed by microscopy analysis.
Imaging and data analysis
Time-lapse imaging was performed in profusion chambers. The profusion chambers were prepared with double-sided sticky tape and coverslips that were coated with 5 mg/ml poly-l-lysine, as described previously (41). The profusion chambers were washed with 40 μl of EMM containing 111.1 mm glucose before cells were injected. After injection of cells grown in EMM containing 111.1 mm glucose, the profusion chambers were placed upside down in a 30 °C incubator for 15 min to allow attachment of the cells onto coverslips. Unattached cells were washed away with 40 μl of EMM containing 111.1 mm glucose. Images were acquired immediately after replacement of glucose-rich EMM with 80 μl of glucose-free EMM. Regular imaging was performed on EMM–agarose pad slides as described previously (42).
All imaging data were collected with a PerkinElmer Life Sciences UltraVIEW Vox spinning-disk microscope equipped with a Hamamatsu C9100–23B electron multiplying charge coupled device camera and a CFI Apochromat total internal reflection fluorescence ×100 objective (numerical aperture = 1.49). For time-lapse imaging, stack images containing 11 planes (0.5 μm/5 μm) were acquired every 30 s. For maximum projection images, stack images containing 11 planes (0.5 μm/5 μm) were acquired. All imaging experiments were performed at room temperature. Data were analyzed with MetaMorph 7.7 (Molecular Devices, Sunnyvale, CA) and Fiji ImageJ (National Institutes of Health, Bethesda, MD). Mitochondrion number analysis was conducted with the algorithm MiNA (12). Graphs and plots were generated using KaleidaGraph 4.5 (Synergy Software, Reading, PA). Statistical analysis was performed with Microsoft Excel and KaleidaGraph 4.5.
Author contributions
F. Z. data curation; F. Z., B. J., F. D., L. L., and C. F. formal analysis; F. Z., B. J., F. D., L. L., F. R., and J. H. investigation; F. Z. and B. J. methodology; F. Z. and C. F. writing-original draft; F. D. validation; C. F. conceptualization; C. F. supervision; C. F. funding acquisition; C. F. writing-review and editing.
Supplementary Material
Acknowledgments
We thank Dr. Charles S. Hoffman (Boston College) and Dr. Phong Tran (University of Pennsylvania) for providing yeast strains.
This work was supported by National Key Research and Development Program of China Grant 2018YFC1004700; National Natural Science Foundation of China Grants 91754106, 31871350, 31671406, 31601095, and 31621002; Strategic Priority Research Program of the Chinese Academy of Sciences Grant XDB19040101; Major/Innovative Program of Development Foundation of the Hefei Center for Physical Science and Technology Grant 2017FXCX008; and China's 1000 Young Talents Recruitment Program. The authors declare that they have no conflicts of interest with the contents of this article.
This article contains Figure S1 and Tables S1 and S2.
- AMPK
- AMP-activated protein kinase
- EMM
- Edinburgh minimal medium
- ROS
- reactive oxygen species
- DCDHF-DA
- 2′,7′-dichlorodihydrofluorescein diacetate
- ANOVA
- analysis of variance
- MiNA
- mitochondrial network analysis.
References
- 1. Egner A., Jakobs S., and Hell S. W. (2002) Fast 100-nm resolution three-dimensional microscope reveals structural plasticity of mitochondria in live yeast. Proc. Natl. Acad. Sci. U.S.A. 99, 3370–3375 10.1073/pnas.052545099 [DOI] [PMC free article] [PubMed] [Google Scholar]
- 2. Jakobs S., Martini N., Schauss A. C., Egner A., Westermann B., and Hell S. W. (2003) Spatial and temporal dynamics of budding yeast mitochondria lacking the division component Fis1p. J. Cell Sci. 116, 2005–2014 10.1242/jcs.00423 [DOI] [PubMed] [Google Scholar]
- 3. Gomes L. C., Di Benedetto G., and Scorrano L. (2011) During autophagy mitochondria elongate, are spared from degradation and sustain cell viability. Nat. Cell Biol. 13, 589–598 10.1038/ncb2220 [DOI] [PMC free article] [PubMed] [Google Scholar]
- 4. Molina A. J., Wikstrom J. D., Stiles L., Las G., Mohamed H., Elorza A., Walzer G., Twig G., Katz S., Corkey B. E., and Shirihai O. S. (2009) Mitochondrial networking protects β-cells from nutrient-induced apoptosis. Diabetes 58, 2303–2315 10.2337/db07-1781 [DOI] [PMC free article] [PubMed] [Google Scholar]
- 5. Rambold A. S., Kostelecky B., Elia N., and Lippincott-Schwartz J. (2011) Tubular network formation protects mitochondria from autophagosomal degradation during nutrient starvation. Proc. Natl. Acad. Sci. U.S.A. 108, 10190–10195 10.1073/pnas.1107402108 [DOI] [PMC free article] [PubMed] [Google Scholar]
- 6. Losón O. C., Song Z., Chen H., and Chan D. C. (2013) Fis1, Mff, MiD49, and MiD51 mediate Drp1 recruitment in mitochondrial fission. Mol. Biol. Cell 24, 659–667 10.1091/mbc.e12-10-0721 [DOI] [PMC free article] [PubMed] [Google Scholar]
- 7. Okamoto K., and Shaw J. M. (2005) Mitochondrial morphology and dynamics in yeast and multicellular eukaryotes. Annu. Rev. Genet. 39, 503–536 10.1146/annurev.genet.38.072902.093019 [DOI] [PubMed] [Google Scholar]
- 8. Mishra P., and Chan D. C. (2014) Mitochondrial dynamics and inheritance during cell division, development and disease. Nat. Rev. Mol. Cell Biol. 15, 634–646 10.1038/nrm3877 [DOI] [PMC free article] [PubMed] [Google Scholar]
- 9. Fu C., Jain D., Costa J., Velve-Casquillas G., and Tran P. T. (2011) mmb1p binds mitochondria to dynamic microtubules. Curr. Biol. 21, 1431–1439 10.1016/j.cub.2011.07.013 [DOI] [PMC free article] [PubMed] [Google Scholar]
- 10. Pluskal T., Hayashi T., Saitoh S., Fujisawa A., and Yanagida M. (2011) Specific biomarkers for stochastic division patterns and starvation-induced quiescence under limited glucose levels in fission yeast. FEBS J. 278, 1299–1315 10.1111/j.1742-4658.2011.08050.x [DOI] [PMC free article] [PubMed] [Google Scholar]
- 11. Takeda K., Starzynski C., Mori A., and Yanagida M. (2015) The critical glucose concentration for respiration-independent proliferation of fission yeast, Schizosaccharomyces pombe. Mitochondrion 22, 91–95 10.1016/j.mito.2015.04.003 [DOI] [PubMed] [Google Scholar]
- 12. Valente A. J., Maddalena L. A., Robb E. L., Moradi F., and Stuart J. A. (2017) A simple ImageJ macro tool for analyzing mitochondrial network morphology in mammalian cell culture. Acta Histochem. 119, 315–326 10.1016/j.acthis.2017.03.001 [DOI] [PubMed] [Google Scholar]
- 13. Prudent J., and McBride H. M. (2016) Mitochondrial dynamics: ER actin tightens the Drp1 noose. Curr. Biol. 26, R207–209 10.1016/j.cub.2016.01.009 [DOI] [PubMed] [Google Scholar]
- 14. Lee H., and Yoon Y. (2014) Mitochondrial fission: regulation and ER connection. Mol. Cells 37, 89–94 10.14348/molcells.2014.2329 [DOI] [PMC free article] [PubMed] [Google Scholar]
- 15. Ingerman E., Perkins E. M., Marino M., Mears J. A., McCaffery J. M., Hinshaw J. E., and Nunnari J. (2005) Dnm1 forms spirals that are structurally tailored to fit mitochondria. J. Cell Biol. 170, 1021–1027 10.1083/jcb.200506078 [DOI] [PMC free article] [PubMed] [Google Scholar]
- 16. Smirnova E., Griparic L., Shurland D. L., and van der Bliek A. M. (2001) Dynamin-related protein Drp1 is required for mitochondrial division in mammalian cells. Mol. Biol. Cell 12, 2245–2256 10.1091/mbc.12.8.2245 [DOI] [PMC free article] [PubMed] [Google Scholar]
- 17. Hoffman C. S., and Winston F. (1991) Glucose repression of transcription of the Schizosaccharomyces pombe fbp1 gene occurs by a cAMP signaling pathway. Genes Dev. 5, 561–571 10.1101/gad.5.4.561 [DOI] [PubMed] [Google Scholar]
- 18. Thevelein J. M. (1984) Cyclic-AMP content and trehalase activation in vegetative cells and ascospores of yeast. Arch. Microbiol. 138, 64–67 10.1007/BF00425409 [DOI] [PubMed] [Google Scholar]
- 19. Hoffman C. S. (2005) Glucose sensing via the protein kinase A pathway in Schizosaccharomyces pombe. Biochem. Soc. Trans. 33, 257–260 10.1042/BST0330257 [DOI] [PMC free article] [PubMed] [Google Scholar]
- 20. DeVoti J., Seydoux G., Beach D., and McLeod M. (1991) Interaction between ran1+ protein kinase and cAMP dependent protein kinase as negative regulators of fission yeast meiosis. EMBO J. 10, 3759–3768 10.1002/j.1460-2075.1991.tb04945.x [DOI] [PMC free article] [PubMed] [Google Scholar]
- 21. Kawamukai M., Ferguson K., Wigler M., and Young D. (1991) Genetic and biochemical analysis of the adenylyl cyclase of Schizosaccharomyces pombe. Cell Regul. 2, 155–164 10.1091/mbc.2.2.155 [DOI] [PMC free article] [PubMed] [Google Scholar]
- 22. Maeda T., Wurgler-Murphy S. M., and Saito H. (1994) A two-component system that regulates an osmosensing MAP kinase cascade in yeast. Nature 369, 242–245 10.1038/369242a0 [DOI] [PubMed] [Google Scholar]
- 23. Higuchi T., Watanabe Y., and Yamamoto M. (2002) Protein kinase A regulates sexual development and gluconeogenesis through phosphorylation of the Zn finger transcriptional activator Rst2p in fission yeast. Mol. Cell Biol. 22, 1–11 10.1128/MCB.22.1.1-11.2002 [DOI] [PMC free article] [PubMed] [Google Scholar]
- 24. Byrne S. M., and Hoffman C. S. (1993) Six git genes encode a glucose-induced adenylate cyclase activation pathway in the fission yeast Schizosaccharomyces pombe. J. Cell Sci. 105, 1095–1100 [DOI] [PMC free article] [PubMed] [Google Scholar]
- 25. Mishra P., and Chan D. C. (2016) Metabolic regulation of mitochondrial dynamics. J. Cell Biol. 212, 379–387 10.1083/jcb.201511036 [DOI] [PMC free article] [PubMed] [Google Scholar]
- 26. Chang C. R., and Blackstone C. (2007) Cyclic AMP-dependent protein kinase phosphorylation of Drp1 regulates its GTPase activity and mitochondrial morphology. J. Biol. Chem. 282, 21583–21587 10.1074/jbc.C700083200 [DOI] [PubMed] [Google Scholar]
- 27. Cereghetti G. M., Stangherlin A., Martins de Brito O., Chang C. R., Blackstone C., Bernardi P., and Scorrano L. (2008) Dephosphorylation by calcineurin regulates translocation of Drp1 to mitochondria. Proc. Natl. Acad. Sci. U.S.A. 105, 15803–15808 10.1073/pnas.0808249105 [DOI] [PMC free article] [PubMed] [Google Scholar]
- 28. Xue Y., Ren J., Gao X., Jin C., Wen L., and Yao X. (2008) GPS 2.0, a tool to predict kinase-specific phosphorylation sites in hierarchy. Mol. Cell Proteomics 7, 1598–1608 10.1074/mcp.M700574-MCP200 [DOI] [PMC free article] [PubMed] [Google Scholar]
- 29. Toyama E. Q., Herzig S., Courchet J., Lewis T. L. Jr., Losón O. C., Hellberg K., Young N. P., Chen H., Polleux F., Chan D. C., and Shaw R. J. (2016) Metabolism. AMP-activated protein kinase mediates mitochondrial fission in response to energy stress. Science 351, 275–281 10.1126/science.aab4138 [DOI] [PMC free article] [PubMed] [Google Scholar]
- 30. Townley R., and Shapiro L. (2007) Crystal structures of the adenylate sensor from fission yeast AMP-activated protein kinase. Science 315, 1726–1729 10.1126/science.1137503 [DOI] [PubMed] [Google Scholar]
- 31. Ahamad N., Verma S. K., and Ahmed S. (2016) Activation of checkpoint kinase Chk1 by reactive oxygen species resulting from disruption of wat1/pop3 in Schizosaccharomyces pombe. Genetics 204, 1397–1406 10.1534/genetics.116.193896 [DOI] [PMC free article] [PubMed] [Google Scholar]
- 32. Murphy M. P. (2009) How mitochondria produce reactive oxygen species. Biochem. J. 417, 1–13 10.1042/BJ20081386 [DOI] [PMC free article] [PubMed] [Google Scholar]
- 33. Skulachev V. P. (2001) Mitochondrial filaments and clusters as intracellular power-transmitting cables. Trends Biochem. Sci. 26, 23–29 10.1016/S0968-0004(00)01735-7 [DOI] [PubMed] [Google Scholar]
- 34. Mitra K., Wunder C., Roysam B., Lin G., and Lippincott-Schwartz J. (2009) A hyperfused mitochondrial state achieved at G1-S regulates cyclin E buildup and entry into S phase. Proc. Natl. Acad. Sci. U.S.A. 106, 11960–11965 10.1073/pnas.0904875106 [DOI] [PMC free article] [PubMed] [Google Scholar]
- 35. Saitoh S., and Yanagida M. (2014) Does a shift to limited glucose activate checkpoint control in fission yeast? FEBS Lett. 588, 2373–2378 10.1016/j.febslet.2014.04.047 [DOI] [PubMed] [Google Scholar]
- 36. Saitoh S., Mori A., Uehara L., Masuda F., Soejima S., and Yanagida M. (2015) Mechanisms of expression and translocation of major fission yeast glucose transporters regulated by CaMKK/phosphatases, nuclear shuttling, and TOR. Mol. Biol. Cell 26, 373–386 10.1091/mbc.E14-11-1503 [DOI] [PMC free article] [PubMed] [Google Scholar]
- 37. Cribbs J. T., and Strack S. (2007) Reversible phosphorylation of Drp1 by cyclic AMP-dependent protein kinase and calcineurin regulates mitochondrial fission and cell death. EMBO Rep. 8, 939–944 10.1038/sj.embor.7401062 [DOI] [PMC free article] [PubMed] [Google Scholar]
- 38. Zheng F., Li T., Jin D. Y., Syrovatkina V., Scheffler K., Tran P. T., and Fu C. (2014) Csi1p recruits alp7p/TACC to the spindle pole bodies for bipolar spindle formation. Mol. Biol. Cell 25, 2750–2760 10.1091/mbc.e14-03-0786 [DOI] [PMC free article] [PubMed] [Google Scholar]
- 39. Bähler J., Wu J. Q., Longtine M. S., Shah N. G., McKenzie A. 3rd, Steever A. B., Wach A., Philippsen P., and Pringle J. R. (1998) Heterologous modules for efficient and versatile PCR-based gene targeting in Schizosaccharomyces pombe. Yeast 14, 943–951 [DOI] [PubMed] [Google Scholar]
- 40. Alaamery M. A., and Hoffman C. S. (2008) Schizosaccharomyces pombe Hsp90/Git10 is required for glucose/cAMP signaling. Genetics 178, 1927–1936 10.1534/genetics.107.086165 [DOI] [PMC free article] [PubMed] [Google Scholar]
- 41. Liu W., Zheng F., Wang Y., and Fu C. (2019) Alp7-Mto1 and Alp14 synergize to promote interphase microtubule regrowth from the nuclear envelope. J Mol. Cell Biol. 10.1093/jmcb/mjz038 [DOI] [PMC free article] [PubMed] [Google Scholar]
- 42. Tran P. T., Paoletti A., and Chang F. (2004) Imaging green fluorescent protein fusions in living fission yeast cells. Methods 33, 220–225 10.1016/j.ymeth.2003.11.017 [DOI] [PubMed] [Google Scholar]
Associated Data
This section collects any data citations, data availability statements, or supplementary materials included in this article.