Abstract
The separation of lipid mixtures into thermodynamically stable phase-separated domains is dependent on lipid composition, temperature, and system size. Using molecular dynamics simulations, the line tension between thermodynamically stable lipid domains formed from ternary mixtures of di-C16:0 PC:di-C18:2 PC:cholesterol at 40:40:20 mol. % ratio was investigated via two theoretical approaches. The line tension was found to be 3.1 ± 0.2 pN by capillary wave theory and 4.7 ± 3.7 pN by pressure tensor anisotropy approaches for coarse-grained models based on the Martini force field. Using an all-atom model of the lipid membrane based on the CHARMM36 force field, the line tension was found to be 3.6 ± 0.9 pN using capillary wave theory and 1.8 ± 2.2 pN using pressure anisotropy approaches. The discrepancy between estimates of the line tension based on capillary wave theory and pressure tensor anisotropy methods is discussed. Inclusion of protein in Martini membrane lipid mixtures was found to reduce the line tension by 25%–35% as calculated by the capillary wave theory approach. To further understand and predict the behavior of proteins in phase-separated membranes, we have formulated an analytical Flory-Huggins model and parameterized it against the simulation results. Taken together these results suggest a general role for proteins in reducing the thermodynamic cost associated with domain formation in lipid mixtures and quantifies the thermodynamic driving force promoting the association of proteins to domain interfaces.
INTRODUCTION
Membrane spatial heterogeneity has been proposed to play an essential role in the complex and often collective cellular functions like protein assembly, enzyme catalysis, and signaling.1 Model lipid bilayers that mimic the lateral heterogeneity observed in biological membranes are commonly used in experimental, computational, and theoretical investigations. Ternary mixtures of saturated lipids, unsaturated lipids, and cholesterol (CHOL) are commonly employed as model mixtures that exhibit lipid domain formation, in which saturated and unsaturated lipids laterally phase separate to form coexisting liquid ordered (Lo) and liquid disordered (Ld) domains.2 The free energy cost per unit length of the domain interface defines the line tension (see the supplementary material).
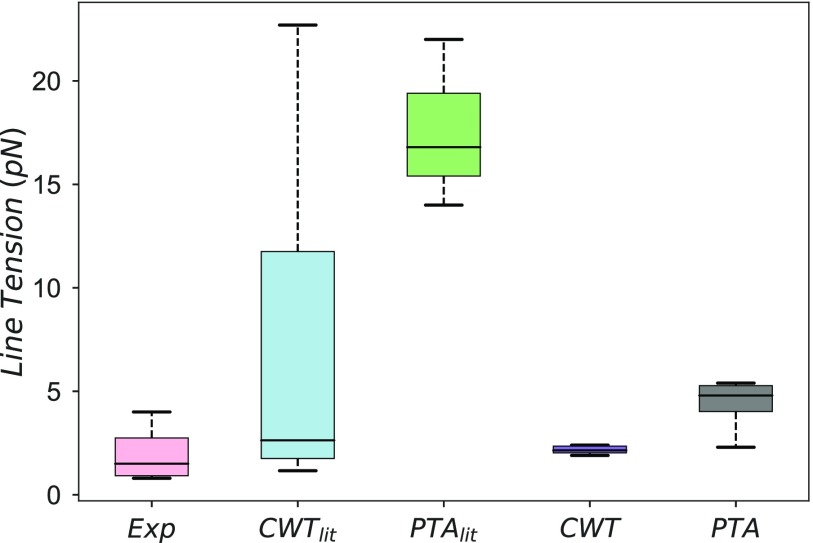
To estimate the line tension of domain interfaces, experimental studies have employed capillary wave theory analysis of fluorescence microscopy images,3–5 and empirical relationships for the line tension have been derived to describe data from fluorescence microscopy,6,7 micropipette aspiration,8 and atomic force microscopy9,10 experiments reporting estimates of line tensions ranging from 0.1 to 4 pN. Analysis of coarse-grained (CG) simulations employing capillary wave theory11–14 and pressure tensor anisotropy approaches13–15 have estimated line tensions to be 3–22 pN. Estimates of line tension between phases in single component lipid bilayers have been derived from the temperature dependence of the rate of nucleation16 and the capillary wave approach,17,18 range from 3 to 10 pN (see Fig. 1 and Table S1 in the supplementary material for further details).
FIG. 1.
Comparison of phase separated lipid domain line tensions estimated from experiments,3–10 (Exp), theoretical estimates based on capillary wave theory11–14 (CWTlit), and pressure tensor anisotropy13–15 (PTAlit) and line tension estimates from the current study using capillary wave theory (CWT) and pressure tensor anisotropy (PTA).
The majority of work on line tension in membranes has been based on studies of binary or ternary lipid mixtures.3,6,7,16,18 However, many have shown that in certain cases, the inclusion of a quaternary component to the membrane can substantially alter the thermodynamics of lipid mixtures. Safran et al. and Rosetti et al. have demonstrated that hybrid lipids with saturated and unsaturated tails can promote lateral heterogeneities by reducing interface line tension.14,19,20 Additionally, Galimzyanov and co-workers have reported chevron dependence of domain line tensions as a function of ganglioside concentration.21
Since proteins can constitute 20%–80% of the membrane mass in vivo,22 it is essential to consider the effect of proteins on the membrane line tension. Membrane proteins are believed to influence the excess free energy at the domain interface by compensating for hydrophobic mismatch at the domain interface, modulating the dielectric properties of membrane or modifying the membrane curvature.10,20 For example, using atomic force microscopy and fluorescence microscopy, Vogel et al. determined that lipid anchored N-Ras proteins localize to the domain interface, modulating the line tension.23 We recently demonstrated that 1000 lipids or more are generally required to form thermodynamically stable phase-separated states.24 As such, while studies have employed CG simulations to investigate the behavior of proteins in phase-separated membranes, there have been no studies based on simulations using all-atom (AA) models. In previous CG simulations, Duncan and co-workers observed reduction in line tension in Lo-Ld phase-separating mixtures of di-C16:0 PC (DPPC) and 16:0-18:1 PC (POPC) upon the introduction of surfactant proteins SP-B and SP-C.25 Janosi et al. observed the localization of lipid anchored H-Ras protein to domain interfaces and 40% reduction in line tension in CG simulations of DPPC, di18:2-PC (DIPC), and CHOL mixtures.11 Marrink and co-workers studied domain separating CG lipid mixtures and reported up to 57% increase in line tension with the introduction of WALP23 and 7% increase with bacterial rhodopsin.13 Camley and Brown have also explored the effect of protein on phase-separated membranes using stochastic Saffman-Delbrück hydrodynamics simulations.26 Taken together, these disparate experimental and theoretical findings demonstrate the need for an improved qualitative and quantitative understanding of the role of proteins in stabilizing phase-separated membranes and the role of membrane domains in spatial localization of proteins in heterogeneous membrane environments.
In this manuscript, we report estimates of lipid domain line tension in phase-separated membranes and the effect of protein on this line tension. We quantify the line tension using capillary wave theory on domain interfaces and pressure anisotropies. We then discuss the source of contrast between these two approaches and also the effects of model resolution on line tension estimates. We have extended an analytical Flory-Huggins model (which we previously developed24) to include the effect of protein insertions to miscible and phase-separated membranes to conceptualize the effect of proteins on line tension, the domain colocalization of proteins, and the stability of the phase-separated state.
METHODS
Molecular simulation models and methods
Coarse-grained (CG) systems
Lipid membranes consisting of 1600 lipids were constructed from the lipid mixture DPPC:DIPC:CHOL in the ratio 40:40:20, previously demonstrated to support formation of thermodynamically stable phase-separated lipid domains.27 Membrane-protein systems were prepared at approximately 1 mol. % protein to lipid fraction (9 copies of the putative protein per system). In this investigation, we simulated the trans-membrane region of the 99 residue C-terminal fragment of amyloid precursor protein (C99) [KLVFFAEDVGSNKGAIIGLMVGGVVIATVIVITLVMLKKK], which plays a central role in many recent computational28–32 and experimental33,34 investigations of the amyloid cascade hypothesis for Alzheimer’s disease, highly charged alpha helical transmembrane protein Syntaxin1A (SX1AWiLdtype) [SKARRKKIMIIICCVILGIIIASTIGGIFG], which is found in the presynaptic plasma membrane, a mutant of Syntaxin1A where all the charged residues are substituted by leucine (SX1AMutant) [SLALLLLIMIIICCVILGIIIASTIGGIFG], and synthetic alpha helical peptides WALP23 [AWWL-(AL)8-WWA] and WALP31 [AWWL-(AL)12-WWA] which have hydrophobic thicknesses compatible with the liquid disordered domain and liquid ordered domain, respectively.15 Initially proteins were placed on a uniform grid, and lipids were randomly arranged in a lipid bilayer using the CHARMM-GUI Martini Bilayer Maker.35,36 Martini 2.2 CG parameters for lipids,37 proteins,38 and cholesterol39 were used.
Membranes were prepared with a water thickness of 17.5 Å on each side, with 10% waters modeled using antifreeze parameters and Na+ and Cl− ion concentrations of 0.15M to approximate physiological conditions. Minimization and equilibration of the membrane systems were carried out according to CHARMM-GUI protocols.36 Production runs were in the NPT ensemble. Velocity rescaling to 295 K was employed using a 1 ps coupling time40 and the semi-isotropic Berendsen barostat was used with 1 bar pressure,41 5 ps coupling time, and a compressibility of 3 × 10⁻⁴ bar−1. Temperatures and pressures were selected to mirror the simulation conditions employed in previous studies of phase-separation based on the Martini CG lipid model12,42,43 and should be sufficient to observe phase separation over a wide range of concentrations.27 Lennard-Jones and Coulomb interactions were treated using the GROMACS shifting function between 0.9–1.2 nm and 0.0–1.2 nm, respectively. Five replicates of each system were simulated for 11 µs (wall clock time) employing the leap-frog integrator with a time step of 20 fs. The mixing entropy and xy-plane area were analyzed for the full 11 µs of each trajectory. The last 2 µs of each trajectory was used in the analysis of the line tension and lateral colocalization of lipids and proteins.
All-atom (AA) system
The initial system was constructed by “tiling” 2 DPPC:CHOL and 2 DIPC:CHOL patches prepared with the CHARMM-GUI Membrane Builder (Fig. S2).35,36 The composition of each DPPC:CHOL and DIPC:CHOL patch was assigned to replicate the lipid to CHOL ratios in equilibrated phase-separated CG membranes of DPPC:DIPC:CHOL (40:40:20) mixtures27 which correspond to estimates of partitioning from x-ray and Raman spectroscopy studies.44–46
To solvate the lipid bilayer, a 17.5 Å-thick water layer was set to each side of the membrane containing Na+ and Cl− ions at an approximate concentration of 0.15M, resulting in system dimensions of 20.4 nm × 20.4 nm × 9.9 nm dimensions in x, y, and z, and 428 650 particles. The CHARMM36 force field parameters47,48 and the TIP3P water model49 were used. Each DPPC:CHOL and DIPC:CHOL patch was energy-minimized and was pre-equilibrated according to the CHARMM-GUI protocols.35 After construction, the system was simulated for 3 µs with leap frog integration with a 2 fs time step.
The production run was maintained at 310 K using the Nosé-Hoover thermostat50,51 and 1 bar using the Parrinello-Rahman barostat with semi-isotropic coupling.52 The Smooth Particle-Mesh Ewald method was used to model long-range interactions.53 Mixing entropy and line tension were estimated using all frames of the production trajectory. The last 1.6 µs of the trajectory was selected to represent the equilibrated state of the AA domain interface.
Molecular-composition-based detection of domain interfaces
Estimation of line tension is often performed by determining a continuous interfacial boundary between domains of different thermodynamic phases and analyzing the fluctuating interface using capillary wave theory. Identification of domain interfaces in lipid bilayers has been undertaken via multiple strategies in the past. Katira et al.17 employed a Gaussian density field approach introduced by Willard and Chandler,54 Rosetti et al.14 used the intrinsic density profile method described by Jorge and Cordeiro,55 and Ackerman and Feigenson56 developed a Voronoi tessellation-based phase interface detection algorithm exploiting the local concentration surrounding lipids. Here, we employed a local composition-based interface detection algorithm that exploits the spatial separation between dipalmitoyl-phosphatidylcholine (DPPC) and dilinoleyl-phosphatidylcholine (DIPC) lipids to define a standing wave form that describes the domain interface in two dimensions. The algorithm is robust against appreciable membrane undulations and minor lipid miscibility. The method is readily generalizable to more complex membranes such as those containing proteins or gangliosides. The chemical identity of lipid nearest neighbors is used as an order parameter as it is the natural description of a phase-separated membrane with saturated and unsaturated lipids. This could be extended to other order parameter fields like density or bond-orientational order as appropriate to the system or phase of interest.17,54
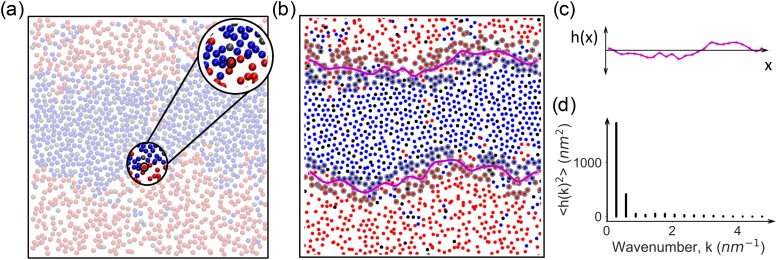
This interface detection algorithm was developed assuming a phase-separated membrane that has adopted a stripe morphology,24 where the interface may lie along the x- or y-axis [Fig. 2(a)]. We identified a two-dimensional surface defined by the C2A and C2B beads of DPPC, D2A, and D2B beads of DIPC, and the R3 bead of CHOL in top and bottom leaflets, separately. This selection is robust to CHOL flip-flops across the bilayer plane as the CHOL assigned to each leaflet is identified in every frame.24 For each selected bead (i), the neighbors in the 2D plane (within a 3.0-nm xy-distance cutoff that includes the second solvation shell and beyond) are identified [Figs. 2(a) and S1]. Then, DPPC or DIPC neighbors are extracted and the corresponding neighbor mol fractions and are computed
| (1) |
Based on the observation that a stripe-shaped phase separation of a two component mixture should present equal amounts of neighbors from each type (Xi = 0.5) at the domain interface, we optimized the cutoff of values for , , and to avoid discontinuity in the domain interface [Fig. 2(b)]. We find the DPPC (DIPC) bead to be at the interface if , such that a DPPC bead should have nearly 50% DIPC nearest neighbors or a DIPC bead should have nearly 50% DPPC nearest neighbors. We consider a CHOL bead to be at the interface when . These values were selected to capture as many interfacial beads as possible while minimizing the misassignment of miscible lipid clusters. The range of values reported here should be applicable to any CG or AA system that presents clear phase separation in a stripe morphology.
FIG. 2.
(a) Lipid membrane tail coordinates in the xy-plane. Highlight shows an arbitrary bead selected from the tail plane, with neighbors within a 3.0-nm xy-plane cut-off distance. (b) Instantaneous interfacial beads are detected via nearest neighbor composition criterion (gray circles), binned (magenta stars), and fitted through the binned interface positions using cubic spline (magenta line). Each DPPC (DIPC) bead was considered to be at interface if , and each CHOL bead was considered to be at the interface when . (c) Fluctuations of the interface h(x) from its mean position (straight line) and (d) their average power spectrum
In order to extract beads belonging to individual interfaces while respecting periodic boundary conditions, we employ the DBSCAN clustering method57 with 2.5 nm clustering threshold and 5% minimum sample fraction. For the interfaces with discontinuities across periodic boundaries, we utilized the coordinates in the neighboring periodic images to form an uninterrupted interface. A smoothening procedure is applied by averaging the points belonging to each interface in roughly 1.0 nm bins along the dimension parallel to the interface. We approximated the functional form of the interface by fitting a cubic spline with 100 grid points and a smoothening factor of 0.001 to the binned interfacial coordinates [Fig. 2(b)]. To filter artifacts, we discarded the frames for which the length of the spline fitted interface registers a change in excess of 25% of the median of the spline lengths of the corresponding interface in the simulated trajectory.
Detection of proteins at domain interfaces
Even for a phase-separated membrane including transmembrane proteins, cutoff values of , , and previously described remain robust in detecting interfacial DPPC, DIPC, and CHOL beads. Additionally, we detect protein beads at the interface in the following manner. We selected protein beads within 1.0 nm of the lipid tails of each leaflet, allowing the atom selection to be dynamic to displacement along the membrane normal or tilting of the protein in the membrane. For each protein bead, lipid tail nearest neighbors within a 3.0-nm xy-plane distance cutoff were identified as protein-lipid contacts. The protein-DPPC contacts were used to assign protein beads to the interface as the Lo domain is less fluid than the Ld domain. We considered a protein bead to be at the interface if . We adopted this composition condition as proteins in this study never fully partitioned to the Lo domain and large protein aggregates were observed at the domain interface. Once the interfacial lipid and protein beads were identified, the line interface was fit as described in the section titled Molecular-composition-based detection of domain interfaces.
Computing line tension of the domain interface
Using the capillary wave approach, the line tension of the domain interface was determined by evaluating the power spectrum [h2(k)] of the interface height fluctuations [h(x)] from a linear interface defining the minimum free energy morphology58–60 [Fig. 2(c)]. Interface height fluctuations in the wave number domain [h(k)] and line tension (λ) per individual interface are related by
| (2) |
where k is the wave number, L is the length of the linear interface, n is the wave number mode index that takes integer values 1, 2, 3, …, kB is the Boltzmann constant, T is the temperature, and is the power spectrum of interface height fluctuations in k domain, averaged over all frames [Fig. 2(d)]. We compute λ using the linear regression of vs k2. We have used the first four wave number modes corresponding to the largest wavelengths (L, L/2, L/3, and L/4) for the line of best fit (see the supplementary material for further details). Line tensions for each of the four interfaces were determined and then averaged for each replicate. The reported results and errors were estimated based on the averages and standard deviations computed over five replicates.
For comparison, the line tension was also computed via analysis of the pressure tensor anisotropy. The derivation, which follows the work of Jiang et al.,61 is included in the supplementary material. Considering an interface parallel to the x-dimension and membrane normal parallel to the z-dimension,
| (3) |
where λ is the line tension per leaflet, Pxx, Pyy, and Pzz are the pressure tensor components in x, y, and z dimensions, and Ly and Lz are the simulation box lengths in y and z dimensions, and the average is taken over all samples at equilibrium. The results and errors were estimated based on the averages and standard deviations computed over five replicates.
Software and computing systems
CG MD simulations were carried out with the GROMACS 5.062–64 simulation platform, using 16 MPI threads, achieving upward of 800 ns/day performance, while the AA simulation was performed with GROMACS2016.3 using two P100 GPUs which were each assigned 8 OMP threads, achieving 7.8 ns/day performance. Trajectories were analyzed by GROMACS packages, and in house scripts utilizing MDAnalysis,65,66 NumPy and SciPy libraries, and molecular visualization were rendered with Visual Molecular Dynamics (VMD).67
RESULTS AND DISCUSSION
Establishing membrane equilibrium and interfacial stability
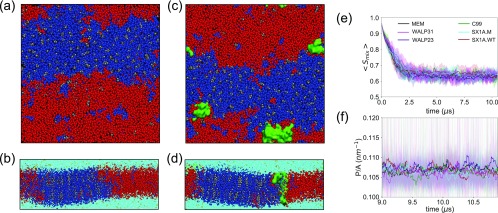
The clear identification of interfaces in stripe-shaped macroscopic phase separations depends on the presence of a stable membrane configuration that can be approximated by a quasi-two-dimensional representation. Figures 3(a)–3(d) illustrate the final configurations of a membrane system (MEM) and a membrane protein system (C99), where stripe-shaped lipid domains are formed. Binary mixing entropy in the simulated systems (Smix),24
| (4) |
where p1 and p2 are contact probabilities between similar and dissimilar types of lipids, respectively, reaches a stationary state from 2.5 µs onward, following the initial formation of the domain interface [Fig. 3(e)]. The ratio of the domain interface perimeter, estimated from the length of the spline fitted to the domain interface in the interface detection process (see the section titled Methods) to the membrane area is also stationary throughout the final 2 µs of dynamics used in the analysis [Fig. 3(f)]. Lateral box length (L) shows rapid equilibration within initial 1 µs of simulation time (Fig. S3 in the supplementary material). Taken together, these observations establish constant area per lipid justifying the assumption of negligible surface tension in the thermodynamic formulation of the line tension.68–71
FIG. 3.
Snapshots of (a) top and (b) side views of final configurations of a membrane system (MEM) and snapshots of (c) top and (d) side views of a membrane protein (C99) system. Systems are colored with DPPC (blue), DIPC (red), CHOL (gray), water (turquoise), NaCl (yellow), and proteins (green). Time evolutions of (e) binary mixing entropy [Smix = −p1 log2(p1) − p2 log2(p2)], where p1 and p2 are contact probabilities between similar types of lipids and dissimilar types of lipids and (f) ratio of domain interface perimeter to membrane area (P/A) in last 2 µs of each simulation, where stable interfaces have formed showing averages (thick lines) and standard deviations (shaded). The time series are smoothed by performing running average over a 25 ns window. Simulated systems are color-coded and designated in the following manner. The membrane only system: black (MEM), C99 in membrane: green (C99), SX1AWildtype in membrane: brown (SX1A.WT), SX1AMutant in membrane: cyan (SX1A.M), WALP23 in membrane: indigo (WALP23), and WALP31 in membrane: magenta (WALP31) (see Table S2 for further details).
Protein colocalization at the domain interface
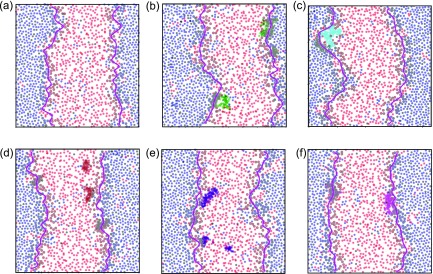
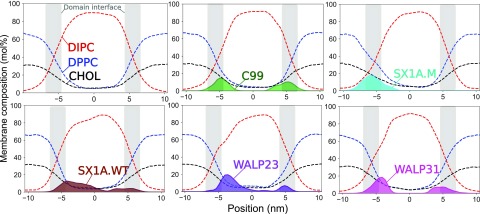
Illustrations of the interface detection method on the final frames of simulation trajectories (Fig. 4) depict the coarse shape of the interface corresponding to large wave length capillary waves. Instances of protein colocalizations along the domain interface are also evident. Lateral density profiles (Fig. 5) show pronounced protein density peaks in the interfacial regions (gray) demonstrating the preference for proteins to localize at the domain interface in phase-separated Martini membranes. We have characterized the time evolution of protein colocalization by calculating the shortest distance in the xy-plane between the center-of-mass of each protein and the membrane domain interface (see Fig. S4 in the supplementary material). Proteins generally maintain a distance between 1 and 2 nm from the interface [Fig. S4(b) in the supplementary material]. However, a moderate fraction of proteins is located near the domain interface from the onset of interface formation and continues to be colocalized along the domain interface throughout the trajectory with a minimum protein-to-interface distance of 0.1–0.2 nm [Fig. S4(c) in the supplementary material].
FIG. 4.
Domain interfaces detected in the last frames in simulation trajectories of representative systems. Detected interfaces and membrane components are colored with the same scheme adopted in Fig. 2. (a) Membrane system and membrane systems with proteins (b) C99 (green), (c) SX1A.M (cyan), (d) SX1A.WT (brown), (e) WAL23 (indigo), and (f) WALP31 (magenta).
FIG. 5.
Lateral density profiles of lipids and proteins across the domain interface, illustrating protein colocalization in the interfacial region. Gray rectangles depict the interfacial region in which DPPC and DIPC have nearly equal molar fractions.
Similar observations have been reported in Martini simulations of lipid-anchored H-Ras proteins in membrane domains by Gorfe and co-workers11,72 and for palmitoylated and unpalmitoylated transmembrane domains from the Linker for Activation of T-cells (tr-LAT) in phase-separated membranes by Lin et al.73 It has also been shown both tr-LAT and palmitoylated and unpalmitoylated synthesized peptide composed of tryptophan (W), alanine (A), and leucine (L) amino acids (WALP) reside near the domain interface by de Jong et al. in Martini simulations.74 Winter and co-workers have reported similar findings for lipid anchored N-Ras proteins in membranes using confocal laser scanning microscopy and atomic force microscopy.9,23,75,76 Glycoprotein human immunodeficiency virus (HIV) gp41 is also reported to colocalize at the domain interfaces facilitating membrane fusion.77,78
Limitations in the electrostatic description in the Martini model diminish the hydrophilic interactions of protein residues with water.37,42 These shortcomings in the CG model preclude us from investigating the effects of varying spatial localization within domains and at domain interfaces on the protein structure. In addition, even substantial variation in protein sequence does not lead to expected differences in the protein partitioning between domains observed in experimental studies (Figs. 5 and 6). Lin et al. have also observed such indifferent interfacial accumulation of peptides for palmitoylated and unpalmitoylated tr-LAT and a shorter mutant of palmitoylated tr-LAT in Martini phase-separated membranes,73 which conflicts with their previous findings in giant plasma membrane vesicles.79,80 This Martini protein model has also been reported to show an exaggerated tendency to aggregate that further hinders the assessment of membrane-protein interactions.81,82
FIG. 6.
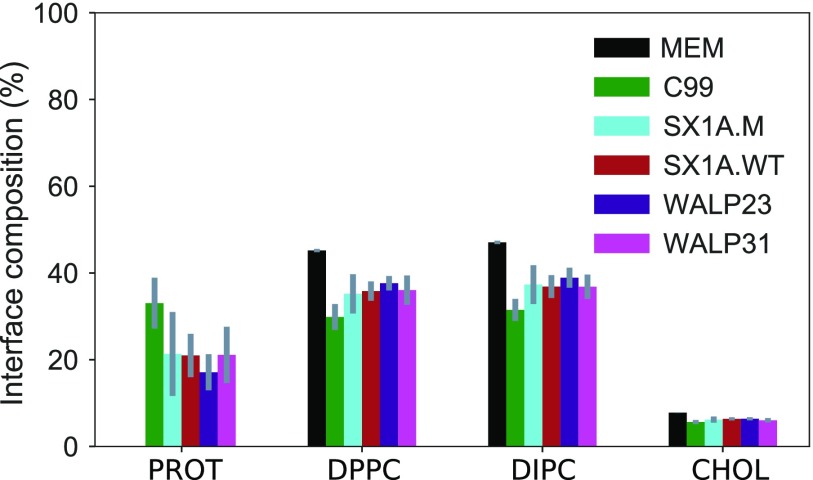
Average interface lipid (DPPC, DIPC, and CHOL) and protein (PROT) compositions defined via the instantaneous interface detection algorithm with error bars (gray).
Quantifying line tension and the linactant effect of proteins
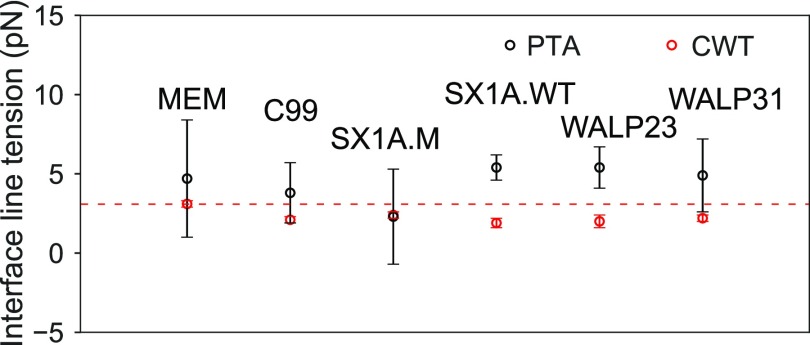
To estimate the stability of the domain interface, we calculated the line tension defined as the excess free energy per unit length of the domain interface using the capillary wave theory (CWT)58–60 and pressure tensor anisotropy (PTA) methods (see the section titled Methods and the supplementary material).12,61 CWT leads to estimates of 3.1 ± 0.2 pN for the line tension, in good agreement with recent findings by Janosi et al.11 and Risselada and Marrink12 (Table S1 in the supplementary material). The discrepancies from the early work of Schäfer and Marrink83 and Domański et al.13 may result from the older Martini CHOL model,37 while a more modern CHOL model was used in this study.39 Rosetti et al. reported systematic over-estimation of domain interfacial line tension using simulations based on the previous version of the Martini CHOL model in bilayers containing hybrid polyunsaturated lipids.14
The introduction of proteins results in 25%–35% reduction in the line tension relative to lipid-only mixtures as calculated by the CWT approach. While the PTA method is not sensitive to this effect, due to the higher uncertainty seen in the line tension estimates (see Table S1 in the supplementary material and Fig. 7), the CWT results support the hypothesis of Brewster and Safran that proteins act as linactants.20 Janosi and co-workers also reported 40% decreases in line tension calculated using the CWT method and data derived from Martini simulations of domain separating lipid mixtures after the inclusion of H-Ras protein.11 The opposite effect was observed by Marrink and co-workers who reported increases in line tension by up to 57% upon the introduction of WALP23 and a 7% increase upon introduction of Bacterial rhodopsin, as computed using the PTA approach.13 Such behavior has implications in nanoscale lipid domains as well, where proteins with GPI anchors or trans-membrane domains have been proposed to modulate domain stability.84
FIG. 7.
Comparison of line tensions per leaflet in simulated membrane systems, with and without proteins, calculated using the capillary wave (red) and pressure tensor anisotropy (black) methods. Horizontal line (red) indicates the line tension (CWT) of lipid membrane system, highlighting linactant natures of proteins in other systems captures by the CWT method. (See Table S2 for line tension reductions observed in each system.).
Comparison of capillary wave and pressure tensor anisotropy methods
The CWT and PTA methods were used to estimate the line tension in our CG simulations leading to agreement within the statistical error (see Fig. 7 and Table S1 in the supplementary material). However, PTA does not appear to be suitable for probing small changes in line tension resulting from the addition of linactants as there is a substantial statistical error, even when averaging over replicate trajectories.
The Martini model is parameterized against oil water partitioning of organic molecules,37,38,42 making it appropriate for capturing excess free energy due to lateral partitioning of lipid and proteins in membranes. The extensive simulation times and system sizes accessible to the Martini model make it possible to obtain the higher precisions observed via the CWT method. The PTA method involves appraisal of forces arising from a number of factors (electrostatically driven hydrophilic interactions of lipid head groups with water being the most prominent), which can be difficult to capture in a CG model due to reduced degrees of freedom and artefacts in the treatment of the electrostatics.42 For example, Sansom and co-workers have demonstrated that Martini membrane simulations with its nonpolarizable water model may exhibit significant deviations in modeling the lipid-water surface.85
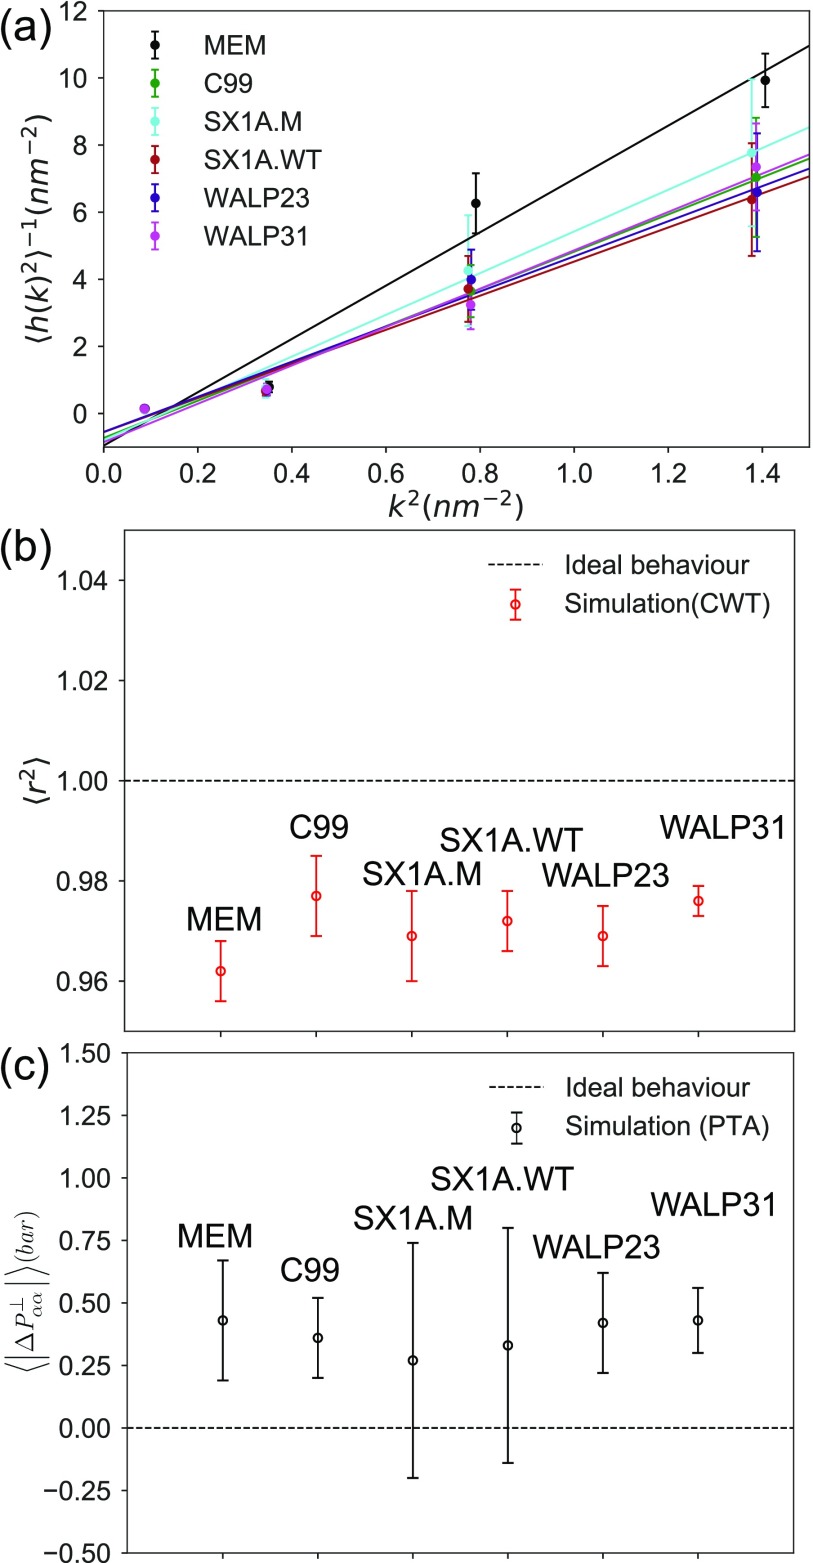
As line tension is a phenomenon that does not necessarily extend to the molecular level, methods employed to quantify the line tension using molecular simulations rely on specific assumptions.20 The CWT method employs a continuum description of the membrane and assumes a contribution to the free energy from each quadratic wave length mode of the power spectrum of the interfacial fluctuations.58–60 The inverse power spectra of height fluctuations of interfaces in each simulated system is fitted as a linear function of the square of the wave number. We have validated this assumption through the mean-squared Pearson’s correlation coefficient of the linear fit [see Figs. 8(a) and 8(b)].
FIG. 8.
(a) Inverse average power spectra of interface height fluctuations as a function of the square of wave the number (k2). (b) Mean-squared Pearson correlation coefficient in vs k2 averaged over replicates (). (c) Absolute difference between the pressure tensors in the two perpendicular dimensions to the domain interface averaged over replicates .
The PTA method assumes that in a fully equilibrated system, pressure tensors in the dimensions perpendicular to the domain interface are equal.12,83,86 As such, the bulk pressure is taken to equal the average of the transverse pressures in the derivation of the relationship between the anisotropy of the lateral pressure tensors (see the supplementary material). We have assessed this assumption in Fig. 8(c). All the systems show deviation in absolute difference between the pressure tensors in the two perpendicular dimensions to the domain interface averaged over replicates , compared to an ideal system. Reduced degrees of freedom and highly simplified electrostatic interactions in the CG model as well as the heterogeneity introduced by membrane proteins may be the contributing factors to the high uncertainty in line tension values determined using the PTA method.87,88
The Martini model employs a top-down coarse-graining strategy aiming at reproducing key experimental and bulk atomistic simulation observables. However, the resulting reduction in degrees of freedom substantially reduces the system entropy. The reduction in entropy must be compensated for by a reduction in the magnitude of terms contributing to the enthalpy. The Martini model describes nonbonded interactions through a Lennard-Jones 12-6 potential. This has been noted to sometimes manifest in over-structuring of fluids, resulting in unphysical phenomena such as the spontaneous freezing of water at physiological conditions.42 Such nonsystematic coarse-graining leads to complexities in projecting observables defined in fully atomistic frameworks to CG systems. Voth and co-workers have extensively discussed issues related to transferability in the calculation of observables from AA and CG model simulations.89 In pressure calculations, the Martini model employs a virial expression in direct analogy to an atomistic system. This approach has been shown89 to be valid only in instances where CG interactions are volume-independent. Hence, the differences in inter- or intramolecular forces, as well as limitations in the pressure calculation through the viral expression based on Martini model simulations, could detrimentally influence the line tension estimated by the PTA method. This may explain the observed discrepancy between the PTA and CWT results (Fig. 7 and Table S1 in the supplementary material). Newer CG lipid models developed by employing systematic bottom-up mapping between CG and AA representations have been developed in part to address these issues.90
Estimates of line tension using CG and AA models
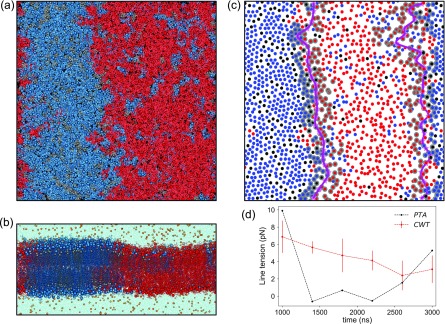
To understand differences that may arise between CG and AA representations of phase-separated domain interfaces in these DPPC:DIPC:CHOL (40:40:20) bilayers, we equilibrated a stripe-shaped AA phase-separated system using the CHARM36 force field. Figures 9(a) and 9(b) illustrate the final configuration of the AA system, where gradual formation of the interfacial standing wave and the development of impurities in each condensed phase are evident. We tracked the evolution of the interface by computing Smix of the system (see Fig. S5). The system appears to be mostly stationary after 1.4 µs of simulation time. In addition, we employed the CWT method to quantify the line tension by analyzing the interfacial height fluctuations on the quasi-two-dimensional surface formed by the lipid tail plane defined by the C27 and C37 atoms of DPPC and DIPC lipids and C8 atom of CHOL [see Fig. 9(c)]. The resulting estimate of the line tension was 3.6 ± 0.9 pN. The error estimate is based on block averaging of the final 1.6 µs portion of the trajectory with 4 uniformly sized blocks. The mean-squared Pearson’s r in the line fits of vs k2 averaged over blocks is 0.93 ± 0.03. The line tension estimate derived using the PTA method shows a block average of 1.8 ± 2.2 pN for the AA system [see Fig. 9(d)].
FIG. 9.
(a) Top and (b) side views of the final configuration of the simulated AA domain interface. System components include DPPC (blue), DIPC (red), CHOL (gray), water (cyan), and NaCl (yellow) with lipid head group P atoms and CHOL O atoms depicted as spheres. (c) Instantaneous membrane domain interface detected in the final configuration of the AA system (same color scheme as in Fig. 2). (d) Line tension per leaflet estimates based on CWT and PTA, in each 400 ns block of the AA trajectory. Error bars for the CWT estimates in each block are generated by averaging the four individual interfaces from top and bottom leaflets (see the section titled Methods), no error estimate could be given for PTA in blocks since only one replicate was simulated.
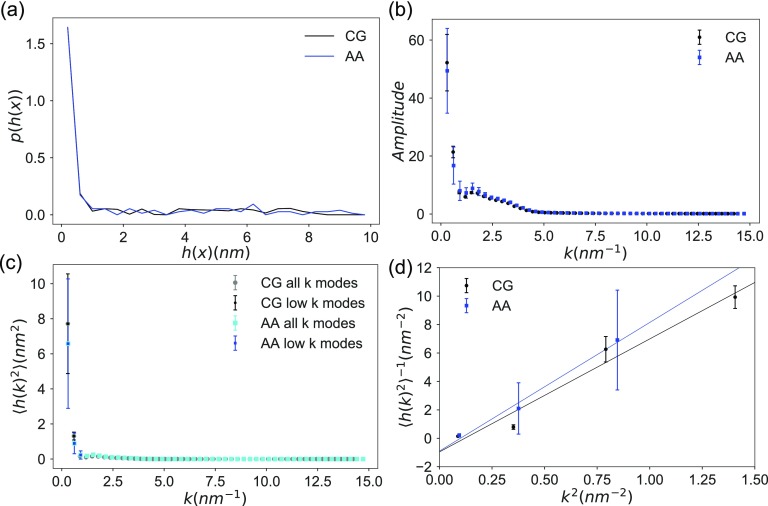
The line tension computed via the CWT method in AA simulations is comparable but slightly higher than that obtained using the CG model. The PTA method estimates a lower line tension in the AA simulations but with a substantially larger error. The change in line tension obtained with CWT arises from differences in the profile of the domain interfaces between AA and CG models [see Fig. 10(a)]. The AA model interface displays smaller amplitudes at the two lowest wave number modes [see Fig. 10(b)]. Hence, the inverse power spectrum of the AA model shows some exaggeration in the gradient in the transition between smaller to larger wavenumber modes in comparison with the CG model [see Figs. 10(c) and 10(d)]. There is significant variability in the interface height fluctuations between AA trajectory blocks [see Figs. 10(b) and 10(c)], leading to the large error estimate in the line tension of the AA interface.
FIG. 10.
(a) Distributions of the interface height fluctuations in real space (h(x)). (b) Discrete-time fast Fourier transforms of the interface height fluctuations in wave number (k)-space. (c) The average power spectrum of interface height fluctuations in k-space colored in gray for CG and cyan for AA. Low wave number modes used in fitting the line tension (black for CG and blue for AA). (d) Variations in the inverse average power spectra of interface height fluctuations as a function of k2.
The Martini model is optimized to produce accurate free energy differences, even though the magnitude of entropies and enthalpies are smaller than in AA models.42 This may be the origin of the consistency in the line tension values for CG and AA systems estimated using the CWT method, which utilizes the domain interface profile resulting from lipid partitioning. The increase in line tensions (by 0.5 pN) observed in the AA model relative to the CG model may be attributed to an underestimation of enthalpic or entropic contributions to the excess free energy at the domain interface in the CG model. Bennett et al. have demonstrated semiquantitative agreement between the Martini model and an atomistic model represented using the Berger lipid parameters for free energy differences associated with the exchange of a saturated lipid with an unsaturated lipid (ΔΔG) in a phase-separated ternary lipid mixture. However, the entropy change (−TΔΔS) and enthalpy change (ΔΔH) associated with the exchange of lipids using an atomistic model were reported to be −158 kJ/mol and 176 kJ/mol, while the entropy and enthalpy differences resulting from the Martini model showed substantial reductions to −21 kJ/mol and 38 kJ/mol, respectively.91 In the case of the PTA estimates, CG and AA line tensions differ by nearly 3 pN, with both methods having high statistical error. While simulations of the AA system extend to 3 µs, the system has not yet established its stationary state as measured by the time evolution of the mixing entropy (see Fig. S5). Given the apparent near-convergence of the mixing entropy to a stationary state, it is reasonable to expect converged values for the computed line tension to fall within the range of the noted statistical error. In summary, dissimilarities in inter- or intramolecular forces between CG and AA model and shortcomings in the PTA approach, including a large statistical error, may all contribute to the observed discrepancy in line tension estimates for AA and CG systems using the PTA approach.
Flory-Huggins model of a phase-separated membrane with a protein
We previously developed a simple analytical model24 to describe the thermodynamics of two-phase separation in a ternary lipid mixture. Although this model was based on a two-component Flory-Huggins model92,93 as an approximation, it served as a useful guide to demonstrate the thermodynamic driving force of phase separation and its finite size effects.24 Here, we extend this analytical model to incorporate the effects of a protein monomer.
We consider a two-dimensional lattice model of a membrane. Each lipid tail is represented by a single cell in a square lattice where the coordination number z = 4. We suppose that the binary mixture is composed of unsaturated tails that are structurally disordered (D) and saturated tails that are structurally ordered (O) in the phase separated state. The phase separation of these O and D lipids approximates the formation of liquid disordered (Ld) and liquid ordered (Lo) phases, respectively. We consider only the nearest neighbor interactions. The interaction energy between lipid tails are denoted by wOO, wDD, and wDO. We examine pure phase-separation into two parallel stripes where the system size is L × L in length and d is the lattice spacing. The free energy in the absence of protein is written as
| (5) |
where and xD and xO are the molar fraction of unsaturated and saturated lipid tails, respectively, with l = L/d and the free energy due to the interface, Finterface = 2lχ, where χ = wDO − (wOO + wDD)/2. By definition, the line tension is
| (6) |
Now, we consider the insertion of a protein occupying m × m cells. The free energy of the system with the protein localized at the boundary is written as
| (7) |
with and where wPO and wPD are interaction energies between proteins and saturated tails and protein and unsaturated tails, respectively. In a similar fashion, the free energy of an m × m protein localized within Lo and Ld phase can be written as
| (8) |
| (9) |
respectively.
By comparing Eqs. (5) and (7), the impact of protein insertion on the thermodynamic cost of domain formation can be measured as the line tension change per linactant
| (10) |
Let us explore this result term by term. The first term −mχ/2L captures the fact that the protein eliminates m (unfavorable) bonds between the Ld phase and the Lo phase. The second term is due to the average solvation free energy of the protein. If the protein can form favorable bonds in both the Ld phase and the Lo phase such that and , the protein works as a stronger linactant. If the protein forms only unfavorable bonds and , the protein is not expected to act as a good linactant although the protein is expected to migrate to the boundary. The third term is a purely entropic term. This final term addresses the fact that the multiple states with interaction energy differing by a multiple of η contribute to this free energy (please see the supplementary material for derivations).
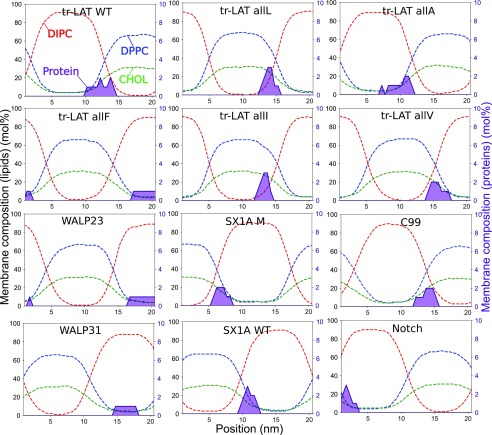
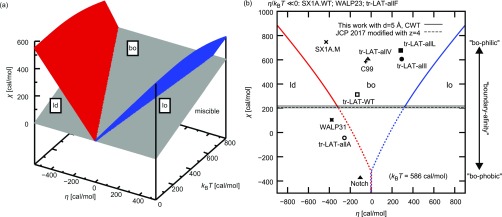
With this minimal model as a guide, we carried out series of protein monomers simulation in DPPC:DIPC:CHOL (40:40:20) lipid mixtures adopting the same Martini simulation protocols as previously discussed (see the section titled Methods and the supplementary material) to parameterize the quantities χ, η, and . Twelve proteins, listed in Table S3, were considered. As η < 0 (η > 0) is associated with the affinity of protein to the Ld (Lo) phase, the η value can be obtained from the protein’s partitioning coefficient between Ld and Lo phases which is calculated based on the minimum distance (in the xy-plane) distributions of protein monomer to the instantaneous Lo-Ld domain interface in the simulated systems (see Fig. S7). The χ value can then be estimated from protein’s affinity to the domain interface, and can also be extracted from the change of the line tension per linactant (Δλ) upon addition of protein (Fig. 11 and Tables S4 and S5 in the supplementary material). Figure 12(a) shows the general phase diagram. When affinity of protein for the Ld (Lo) phase is large, i.e., η ≪ 0 (η ≫ 0), the protein concentration in Ld (Lo) increases. In our model, the driving force to localize proteins at the boundary is −mχ, the replacement of unfavorable interactions between the Ld and Lo phases with interactions between homologous lipid pairs. Hence, when χ is larger, the protein is more likely to be found at the boundary. In addition, the localization of protein at the boundary is generally expected when |η| is small.
FIG. 11.
Lateral density profiles of lipids and protein monomers within the axis of phase separation, illustrating protein partitioning to the Lo and Ld domains and the domain boundary region.
FIG. 12.
(a) The general phase diagram predicted by the Flory-Huggins model indicating the proteins’ affinity to the Ld phase, Lo phase, or phase boundary (bo). At the red (blue) surfaces, the protein concentration of the Ld (Lo) phase is equal to the protein line density at the phase boundary. When χ is small and/or T is high, the miscible phase will form (under gray surface, calculated for N ) (b) The χ and η values obtained with protein monomer simulations are displayed on the phase diagram at T = 295 K. The black solid and black dashed lines show the χ value obtained from the current CWT result from lipid-only simulation and one that can be obtained in spirit of our previous work,24 respectively. As discussed in the main text, the deviation of χ obtained with protein monomer simulation from that obtained with a lipid-only simulation (black lines) can be thought of the protein’s affinity to the boundary. The gray line corresponds to the gray surface in panel (a).
Based on our simulations (Fig. 11), we estimated η and χ for each protein and summarized the results in the form of a phase diagram [Fig. 12(b)], together with the χ values obtained with lipid-only simulations. Our present CWT result λ = 3.1 pN with assumption of d = 5 Å translates into χ ≈ 222 cal/mol via Eq. (6). Our previous work,24 after minor modification described in the supplementary material to match the conditions of this work, suggests that χ ≈ 208 cal/mol is in remarkable agreement with the present result. On the other hand, the χ values obtained from protein monomer simulations vary around 200 cal/mol [Fig. 12(b)]. The overestimation or underestimation of χ with respect to a lipid-only simulation can be associated with protein’s property of “boundary-affinity” or “boundary-phobicity.”
While bulkier side-chain mutants have been predicted to prefer the Ld phase to the Lo phase,94 we did not necessarily observe this tendency. While tr-LAT-allF colocalized completely in the Ld phase (η ≪ 0), the η-value of tr-LAT-allL, tr-LAT-allI, and tr-LAT-allV are larger (more Lo phase prone) than tr-LAT-allA. It is also evident that tr-LAT-allL, tr-LAT-allI, and tr-LAT-allV have large χ values, suggesting the strong affinity for the boundary. In the Martini model, amino acid side chains of L, I, and V are represented by one particle, while the side chain of F is represented by a three-particle ring, and A has no side chain particle. This suggests that one-particle protein side chains allow for Martini proteins to preferentially partition to the Lo side of the interface, perhaps due to more favorable packing with ordered lipid tails. It is possible that the coarse-graining in the Martini model is too severe and that the difference in packing between the Ld phase and the Lo phase is not well reproduced. These observations suggest that a more detailed representation such as an all-atom model is needed to accurately predict the protein partitioning behavior.
CONCLUSIONS
Using molecular dynamics simulations employing the Martini 2.2 coarse-grained model and the CHARMM36 all-atom model, the line tension between thermodynamically stable lipid domains formed from ternary mixtures of di-C16:0:PC:di-C18:2:PC:cholesterol at 40:40:20 mol. % ratio was investigated using capillary wave theory and pressure tensor anisotropy approaches. Using a capillary wave theory approach, the line tension was estimated to be 3.1 ± 0.2 pN for the Martini model and 3.6 ± 0.9 pN for the CHARMM36 model of Lo-Ld domain interfaces. Line tension calculations based on the pressure tensor anisotropy method were in agreement with the capillary wave theory estimates but presented a larger statistical uncertainty.
The impact of protein acting as a linactant on the structure and fluctuations of the interface formed between Lo and Ld domains in ternary lipid mixtures was investigated using molecular dynamics simulations employing the Martini model. In the Martini model, proteins were generally observed to migrate to the domain interface and to lower the line tension by 25%–35% as calculated by the capillary wave theory approach. The pressure tensor anisotropy method was unable to capture this effect due to the higher statistical error.
The Martini model has the ability to appropriately reproduce the lateral partitioning of lipids but suffers from inaccuracies resulting from the approximate treatment of electrostatics and under estimation of changes in entropies and enthalpies resulting from lipid partitioning associated with phase separation. In general, dissimilarities in inter- or intramolecular forces between coarse-grained and all-atom models and shortcomings in the pressure tensor anisotropy approach contribute to the observed discrepancy in line tension estimates for all-atom and coarse-grained systems. We conclude that the capillary wave theory approach provides the most accurate estimates of the change in line tension associated with the introduction of transmembrane proteins in phase-separated lipid bilayers using the Martini model.
We expanded a Flory-Huggins-like model of lipid phase separation to conceptualize the effect of protein on the free energy of phase-separation. This model provides a way of organizing our thinking about the thermodynamic driving forces determining the location of proteins in phase-separated lipid bilayer systems as a function of the line tension and protein-lipid affinities.
Further investigation of domain interfaces using all-atom models or a coarse-grained protein model that can appropriately change the structure in response to a heterogeneous membrane environment is needed in order to develop a better understanding of protein partitioning in membrane and its effect on domain size and stability, critical to the form and functionality of heterogeneous biological membranes.
SUPPLEMENTARY MATERIAL
See supplementary material for tabulated domain interface line tension values measured experimentally or estimated theoretically; radial distributions of lipid head and tail groups; visualizations of the all-atom phase-separated system; time evolutions of membrane lateral area, mixing entropy, average distance from protein to domain interface, and minimum distance from protein to domain interface, lipid, protein compositions, and line tension reduction in the simulated systems; mixing entropy of the all-atom phase-separated system; derivations of capillary wave theory and pressure tensor anisotropy expressions of line tension; details of protein monomer simulations; and distributions of minimum distance to the interface (in the xy plane) for protein monomers. Additionally, it describes the derivations and parameterization of the Flory-Huggins model of a phase-separated membrane with a protein.
ACKNOWLEDGMENTS
The authors gratefully acknowledge the generous support of the National Science Foundation (Grant No. CHE-1362524) and the National Institutes of Health (Grant No. R01 GM107703). We are also thankful for the high performance computing resources of the Boston University Shared Computing Cluster (SCC). G.A.P. is supported by a National Science Foundation Graduate Research Fellowship (No. DGE-1840990).
REFERENCES
- 1.Sonnino S. and Prinetti A., Curr. Med. Chem. 20, 4 (2012). 10.2174/09298673130103 [DOI] [PubMed] [Google Scholar]
- 2.Marsh D., Biochim. Biophys. Acta, Biomembr. 1788, 2114 (2009). 10.1016/j.bbamem.2009.08.004 [DOI] [PubMed] [Google Scholar]
- 3.Honerkamp-Smith A. R., Cicuta P., Collins M. D., Veatch S. L., den Nijs M., Schick M., and Keller S. L., Biophys. J. 95, 236 (2008). 10.1529/biophysj.107.128421 [DOI] [PMC free article] [PubMed] [Google Scholar]
- 4.Esposito C., Tian A., Melamed S., Johnson C., Tee S.-Y., and Baumgart T., Biophys. J. 93, 3169 (2007). 10.1529/biophysj.107.111922 [DOI] [PMC free article] [PubMed] [Google Scholar]
- 5.Usery R. D., Enoki T. A., Wickramasinghe S. P., Weiner M. D., Tsai W.-C., Kim M. B., Wang S., Torng T. L., Ackerman D. G., Heberle F. A., Katsaras J., and Feigenson G. W., Biophys. J. 112, 1431 (2017). 10.1016/j.bpj.2017.02.033 [DOI] [PMC free article] [PubMed] [Google Scholar]
- 6.Baumgart T., Hess S. T., and Webb W. W., Nature 425, 821 (2003). 10.1038/nature02013 [DOI] [PubMed] [Google Scholar]
- 7.Baumgart T., Das S., Webb W. W., and Jenkins J. T., Biophys. J. 89, 1067 (2005). 10.1529/biophysj.104.049692 [DOI] [PMC free article] [PubMed] [Google Scholar]
- 8.Tian A., Johnson C., Wang W., and Baumgart T., Phys. Rev. Lett. 98, 208102 (2007). 10.1103/physrevlett.98.208102 [DOI] [PubMed] [Google Scholar]
- 9.Weise K., Triola G., Brunsveld L., Waldmann H., and Winter R., J. Am. Chem. Soc. 131, 1557 (2009). 10.1021/ja808691r [DOI] [PubMed] [Google Scholar]
- 10.Weise K., Huster D., Kapoor S., Triola G., Waldmann H., and Winter R., Faraday Discuss. 161, 549 (2013). 10.1039/c2fd20100c [DOI] [PubMed] [Google Scholar]
- 11.Janosi L., Li Z., Hancock J. F., and Gorfe A. A., Proc. Natl. Acad. Sci. U. S. A. 109, 8097 (2012). 10.1073/pnas.1200773109 [DOI] [PMC free article] [PubMed] [Google Scholar]
- 12.Risselada H. J. and Marrink S. J., Proc. Natl. Acad. Sci. U. S. A. 105, 17367 (2008). 10.1073/pnas.0807527105 [DOI] [PMC free article] [PubMed] [Google Scholar]
- 13.Domański J., Marrink S. J., and Schäfer L. V., Biochim. Biophys. Acta, Biomembr. 1818, 984 (2012). 10.1016/j.bbamem.2011.08.021 [DOI] [PubMed] [Google Scholar]
- 14.Rosetti C. M., Montich G. G., and Pastorino C., J. Phys. Chem. B 121, 1587 (2017). 10.1021/acs.jpcb.6b10836 [DOI] [PubMed] [Google Scholar]
- 15.Schafer L. V., de Jong D. H., Holt A., Rzepiela A. J., de Vries A. H., Poolman B., Killian J. A., and Marrink S. J., Proc. Natl. Acad. Sci. U. S. A. 108, 1343 (2011). 10.1073/pnas.1009362108 [DOI] [PMC free article] [PubMed] [Google Scholar]
- 16.Marrink S. J., Risselada J., and Mark A. E., Chem. Phys. Lipids 135, 223 (2005). 10.1016/j.chemphyslip.2005.03.001 [DOI] [PubMed] [Google Scholar]
- 17.Katira S., Mandadapu K. K., Vaikuntanathan S., Smit B., and Chandler D., Elife 5, e13150 (2016). 10.7554/elife.13150 [DOI] [PMC free article] [PubMed] [Google Scholar]
- 18.Hömberg M. and Müller M., J. Chem. Phys. 132, 155104 (2010). 10.1063/1.3369005 [DOI] [PubMed] [Google Scholar]
- 19.Brewster R. and Safran S. A., Biophys. J. 98, L21 (2010). 10.1016/j.bpj.2009.11.027 [DOI] [PMC free article] [PubMed] [Google Scholar]
- 20.Palmieri B., Yamamoto T., Brewster R. C., and Safran S. A., Adv. Colloid Interface Sci. 208, 58 (2014). 10.1016/j.cis.2014.02.007 [DOI] [PubMed] [Google Scholar]
- 21.Galimzyanov T. R., Lyushnyak A. S., Aleksandrova V. V., Shilova L. A., Mikhalyov I. I., Molotkovskaya I. M., Akimov S. A., and Batishchev O. V., Langmuir 33, 3517 (2017). 10.1021/acs.langmuir.7b00404 [DOI] [PubMed] [Google Scholar]
- 22.Pogozheva I. D., Tristram-Nagle S., Mosberg H. I., and Lomize A. L., Biochim. Biophys. Acta, Biomembr. 1828, 2592 (2013). 10.1016/j.bbamem.2013.06.023 [DOI] [PMC free article] [PubMed] [Google Scholar]
- 23.Vogel A., Nikolaus J., Weise K., Triola G., Waldmann H., Winter R., Herrmann A., and Huster D., Biol. Chem. 395, 779 (2014). 10.1515/hsz-2013-0294 [DOI] [PubMed] [Google Scholar]
- 24.Pantelopulos G. A., Nagai T., Bandara A., Panahi A., and Straub J. E., J. Chem. Phys. 147, 95101 (2017). 10.1063/1.4999709 [DOI] [PMC free article] [PubMed] [Google Scholar]
- 25.Duncan S. L., Dalal I. S., and Larson R. G., Biochim. Biophys. Acta, Biomembr. 1808, 2450 (2011). 10.1016/j.bbamem.2011.06.026 [DOI] [PubMed] [Google Scholar]
- 26.Camley B. A. and Brown F. L. H., J. Chem. Phys. 141, 075103 (2014). 10.1063/1.4892802 [DOI] [PubMed] [Google Scholar]
- 27.Pantelopulos G. A. and Straub J. E., Biophys. J. 115, 2167 (2018). 10.1016/j.bpj.2018.10.011 [DOI] [PMC free article] [PubMed] [Google Scholar]
- 28.Miyashita N., Straub J. E., Thirumalai D., and Sugita Y., J. Am. Chem. Soc. 131, 3438 (2009). 10.1021/ja809227c [DOI] [PMC free article] [PubMed] [Google Scholar]
- 29.Dominguez L., Foster L., Meredith S. C., Straub J. E., and Thirumalai D., J. Am. Chem. Soc. 136, 9619 (2014). 10.1021/ja503150x [DOI] [PMC free article] [PubMed] [Google Scholar]
- 30.Panahi A., Bandara A., Pantelopulos G. A., Dominguez L., and Straub J. E., J. Phys. Chem. Lett. 7, 3535 (2016). 10.1021/acs.jpclett.6b01624 [DOI] [PMC free article] [PubMed] [Google Scholar]
- 31.Audagnotto M., Lemmin T., Barducci A., and Dal Peraro M., J. Phys. Chem. Lett. 7, 3572 (2016). 10.1021/acs.jpclett.6b01721 [DOI] [PubMed] [Google Scholar]
- 32.Pantelopulos G. A., Straub J. E., Thirumalai D., and Sugita Y., Biochim. Biophys. Acta, Biomembr. 1860, 1698 (2018). 10.1016/j.bbamem.2018.04.002 [DOI] [PMC free article] [PubMed] [Google Scholar]
- 33.Song Y., Hustedt E. J., Brandon S., and Sanders C. R., Biochemistry 52, 5051 (2013). 10.1021/bi400735x [DOI] [PMC free article] [PubMed] [Google Scholar]
- 34.Song Y., Kenworthy A. K., and Sanders C. R., Protein Sci. 23, 1 (2014). 10.1002/pro.2385 [DOI] [PMC free article] [PubMed] [Google Scholar]
- 35.Jo S., Kim T., Iyer V. G., and Im W., J. Comput. Chem. 29, 1859 (2008). 10.1002/jcc.20945 [DOI] [PubMed] [Google Scholar]
- 36.Qi Y., Ingólfsson H. I., Cheng X., Lee J., Marrink S. J., and Im W., J. Chem. Theory Comput. 11, 4486 (2015). 10.1021/acs.jctc.5b00513 [DOI] [PubMed] [Google Scholar]
- 37.Marrink S. J., Risselada H. J., Yefimov S., Tieleman D. P., and de Vries A. H., J. Phys. Chem. B 111, 7812 (2007). 10.1021/jp071097f [DOI] [PubMed] [Google Scholar]
- 38.Monticelli L., Kandasamy S. K., Periole X., Larson R. G., Tieleman D. P., and Marrink S.-J., J. Chem. Theory Comput. 4, 819 (2008). 10.1021/ct700324x [DOI] [PubMed] [Google Scholar]
- 39.Melo M. N., Ingólfsson H. I., and Marrink S. J., J. Chem. Phys. 143, 243152 (2015). 10.1063/1.4937783 [DOI] [PubMed] [Google Scholar]
- 40.Bussi G. and Parrinello M., Phys. Rev. E 75, 056707 (2007). 10.1103/physreve.75.056707 [DOI] [PubMed] [Google Scholar]
- 41.Berendsen H. J. C., Postma J. P. M., van Gunsteren W. F., DiNola A., and Haak J. R., J. Chem. Phys. 81, 3684 (1984). 10.1063/1.448118 [DOI] [Google Scholar]
- 42.Marrink S. J. and Tieleman D. P., Chem. Soc. Rev. 42, 6801 (2013). 10.1039/c3cs60093a [DOI] [PubMed] [Google Scholar]
- 43.Hakobyan D. and Heuer A., PLoS One 9, e87369 (2014). 10.1371/journal.pone.0087369 [DOI] [PMC free article] [PubMed] [Google Scholar]
- 44.Chen L., Yu Z., and Quinn P. J., Biochim. Biophys. Acta, Biomembr. 1768, 2873 (2007). 10.1016/j.bbamem.2007.07.023 [DOI] [PubMed] [Google Scholar]
- 45.Belička M., Weitzer A., and Pabst G., Soft Matter 13, 1823 (2017). 10.1039/c6sm02727j [DOI] [PubMed] [Google Scholar]
- 46.Donaldson S. H. and de Aguiar H. B., J. Phys. Chem. Lett. 9, 1528 (2018). 10.1021/acs.jpclett.8b00235 [DOI] [PubMed] [Google Scholar]
- 47.Lim J. B., Rogaski B., and Klauda J. B., J. Phys. Chem. B 116, 203 (2011). 10.1021/jp207925m [DOI] [PubMed] [Google Scholar]
- 48.Klauda J. B., Venable R. M., Freites J. A., O’Connor J. W., Tobias D. J., Mondragon-Ramirez C., Vorobyov I., MacKerell A. D., and Pastor R. W., J. Phys. Chem. B 114, 7830 (2010). 10.1021/jp101759q [DOI] [PMC free article] [PubMed] [Google Scholar]
- 49.Jorgensen W. L., Chandrasekhar J., Madura J. D., Impey R. W., and Klein M. L., J. Chem. Phys. 79, 926 (1983). 10.1063/1.445869 [DOI] [Google Scholar]
- 50.Nosé S., J. Chem. Phys. 81, 511 (1984). 10.1063/1.447334 [DOI] [Google Scholar]
- 51.Hoover W. G., Phys. Rev. A 31, 1695 (1985). 10.1103/physreva.31.1695 [DOI] [PubMed] [Google Scholar]
- 52.Parrinello M. and Rahman A., J. Appl. Phys. 52, 7182 (1981). 10.1063/1.328693 [DOI] [Google Scholar]
- 53.Essmann U., Perera L., Berkowitz M. L., Darden T., Lee H., and Pedersen L. G., J. Chem. Phys. 103, 8577 (1995). 10.1063/1.470117 [DOI] [Google Scholar]
- 54.Willard A. P. and Chandler D., J. Phys. Chem. B 114, 1954 (2010). 10.1021/jp909219k [DOI] [PMC free article] [PubMed] [Google Scholar]
- 55.Jorge M. and Cordeiro M. N. D. S., J. Phys. Chem. C 111, 17612 (2007). 10.1021/jp076178q [DOI] [Google Scholar]
- 56.Ackerman D. G. and Feigenson G. W., J. Phys. Chem. B 119, 4240 (2015). 10.1021/jp511083z [DOI] [PMC free article] [PubMed] [Google Scholar]
- 57.Ester M., Kriegel H. P., Sander J., and Xu X., in Proceedings of 2nd International Conference on Knowledge Discovery and Data Mining (AAAI Press, 1996), p. 226. [Google Scholar]
- 58.Podgornik R., J. Stat. Phys. 78, 1175 (1995). 10.1007/bf02183712 [DOI] [Google Scholar]
- 59.Aarts D. G. A. L., Science 304, 847 (2004). 10.1126/science.1097116 [DOI] [PubMed] [Google Scholar]
- 60.Fisher M. P. A., Fisher D. S., and Weeks J. D., Phys. Rev. Lett. 48, 368 (1982). 10.1103/physrevlett.48.368 [DOI] [Google Scholar]
- 61.Jiang F. Y., Bouret Y., and Kindt J. T., Biophys. J. 87, 182 (2004). 10.1529/biophysj.103.031054 [DOI] [PMC free article] [PubMed] [Google Scholar]
- 62.Berendsen H. J. C., van der Spoel D., and van Drunen R., Comput. Phys. Commun. 91, 43 (1995). 10.1016/0010-4655(95)00042-e [DOI] [Google Scholar]
- 63.Abraham M. J., Murtola T., Schulz R., Páll S., Smith J. C., Hess B., and Lindahl E., SoftwareX 1, 19 (2015). 10.1016/j.softx.2015.06.001 [DOI] [Google Scholar]
- 64.Páll S., Abraham M. J., Kutzner C., Hess B., and Lindahl E., in International Conference on Exascale Apple Software, edited by Markidis S. and Laure E. (Springer International Publishing, 2015), pp. 3–27. [Google Scholar]
- 65.Michaud-Agrawal N., Denning E. J., Woolf T. B., and Beckstein O., J. Comput. Chem. 32, 2319 (2011). 10.1002/jcc.21787 [DOI] [PMC free article] [PubMed] [Google Scholar]
- 66.Gowers R. J., Linke M., Barnoud J., Reddy T. J. E., Melo M. N., Seyler S. L., Domański J., Dotson D. L., Buchoux S., Kenney I. M., and Beckstein O., in Proceedings of 15th Python Science Conference (2016), p. 98. 10.25080/Majora-629e541a-00e [DOI] [Google Scholar]
- 67.Humphrey W., Dalke A., and Schulten K., J. Mol. Graphics 14, 33 (1996). 10.1016/0263-7855(96)00018-5 [DOI] [PubMed] [Google Scholar]
- 68.Klauda J. B., Venable R. M., MacKerell A. D., and Pastor R. W., in Computational Modeling of Membrane Bilayers, edited by Feller S. E. (Elsevier, Inc., 2008), pp. 1–48. [Google Scholar]
- 69.Brochard F., De Gennes P. G., and Pfeuty P., J. Phys. 37, 1099 (1976). 10.1051/jphys:0197600370100109900 [DOI] [Google Scholar]
- 70.Israelachvili J. N., Mitchell D. J., and Ninham B. W., Biochim. Biophys. Acta, Biomembr. 470, 185 (1977). 10.1016/0005-2736(77)90099-2 [DOI] [PubMed] [Google Scholar]
- 71.Jähnig F., Biophys. J. 71, 1348 (1996). 10.1016/s0006-3495(96)79336-0 [DOI] [PMC free article] [PubMed] [Google Scholar]
- 72.Li Z., Janosi L., and Gorfe A. A., J. Am. Chem. Soc. 134, 17278 (2012). 10.1021/ja307716z [DOI] [PMC free article] [PubMed] [Google Scholar]
- 73.Lin X., Gorfe A. A., and Levental I., Biophys. J. 114, 1936 (2018). 10.1016/j.bpj.2018.03.020 [DOI] [PMC free article] [PubMed] [Google Scholar]
- 74.de Jong D. H., Lopez C. A., and Marrink S. J., Faraday Discuss. 161, 347 (2013). 10.1039/c2fd20086d [DOI] [PubMed] [Google Scholar]
- 75.Weise K., Kapoor S., Denter C., Nikolaus J., Opitz N., Koch S., Triola G., Herrmann A., Waldmann H., and Winter R., J. Am. Chem. Soc. 133, 880 (2011). 10.1021/ja107532q [DOI] [PubMed] [Google Scholar]
- 76.Vogel A., Reuther G., Weise K., Triola G., Nikolaus J., Tan K.-T., Nowak C., Herrmann A., Waldmann H., Winter R., and Huster D., Angew. Chem., Int. Ed. 48, 8784 (2009). 10.1002/anie.200903396 [DOI] [PubMed] [Google Scholar]
- 77.Yang S.-T., Kiessling V., and Tamm L. K., Nat. Commun. 7, 11401 (2016). 10.1038/ncomms11401 [DOI] [PMC free article] [PubMed] [Google Scholar]
- 78.Yang S.-T., Kiessling V., Simmons J. A., White J. M., and Tamm L. K., Nat. Chem. Biol. 11, 424 (2015). 10.1038/nchembio.1800 [DOI] [PMC free article] [PubMed] [Google Scholar]
- 79.Diaz-Rohrer B. B., Levental K. R., Simons K., and Levental I., Proc. Natl. Acad. Sci. U. S. A. 111, 8500 (2014). 10.1073/pnas.1404582111 [DOI] [PMC free article] [PubMed] [Google Scholar]
- 80.Lorent J. H. and Levental I., Chem. Phys. Lipids 192, 23 (2015). 10.1016/j.chemphyslip.2015.07.022 [DOI] [PubMed] [Google Scholar]
- 81.Stark A. C., Andrews C. T., and Elcock A. H., J. Chem. Theory Comput. 9, 4176 (2013). 10.1021/ct400008p [DOI] [PMC free article] [PubMed] [Google Scholar]
- 82.Javanainen M., Martinez-Seara H., and Vattulainen I., PLoS One 12, e0187936 (2017). 10.1371/journal.pone.0187936 [DOI] [PMC free article] [PubMed] [Google Scholar]
- 83.Schäfer L. V. and Marrink S. J., Biophys. J. 99, L91 (2010). 10.1016/j.bpj.2010.08.072 [DOI] [PMC free article] [PubMed] [Google Scholar]
- 84.Simons K. and Sampaio J. L., Cold Spring Harbor Perspect. Biol. 3, a004697 (2011). 10.1101/cshperspect.a004697 [DOI] [PMC free article] [PubMed] [Google Scholar]
- 85.Sansom M. S. P. and Biggin P. C., Molecular Simulations and Biomembranes (RSC Publishing, 2010). [Google Scholar]
- 86.Wang H., de Joannis J., Jiang Y., Gaulding J. C., Albrecht B., Yin F., Khanna K., and Kindt J. T., Biophys. J. 95, 2647 (2008). 10.1529/biophysj.108.131409 [DOI] [PMC free article] [PubMed] [Google Scholar]
- 87.Cantor R. S., J. Phys. Chem. B 101, 1723 (1997). 10.1021/jp963911x [DOI] [Google Scholar]
- 88.Cantor R. S., Toxicol. Lett. 100-101, 451 (1998). 10.1016/s0378-4274(98)00220-3 [DOI] [PubMed] [Google Scholar]
- 89.Wagner J. W., Dama J. F., Durumeric A. E. P., and Voth G. A., J. Chem. Phys. 145, 044108 (2016). 10.1063/1.4959168 [DOI] [PubMed] [Google Scholar]
- 90.Pak A. J., Dannenhoffer-Lafage T., Madsen J. J., and Voth G. A., J. Chem. Theory Comput. 15, 2087 (2019). 10.1021/acs.jctc.8b01033 [DOI] [PMC free article] [PubMed] [Google Scholar]
- 91.Bennett W. F. D., Shea J.-E., and Tieleman D. P., Biophys. J. 114, 2595 (2018). 10.1016/j.bpj.2018.04.022 [DOI] [PMC free article] [PubMed] [Google Scholar]
- 92.Flory P. J., J. Chem. Phys. 10, 51 (1942). 10.1063/1.1723621 [DOI] [Google Scholar]
- 93.Huggins M. L., J. Am. Chem. Soc. 64, 1712 (1942). 10.1021/ja01259a068 [DOI] [Google Scholar]
- 94.Lorent J. H., Diaz-Rohrer B., Lin X., Spring K., Gorfe A. A., Levental K. R., and Levental I., Nat. Commun. 8, 1219 (2017). 10.1038/s41467-017-01328-3 [DOI] [PMC free article] [PubMed] [Google Scholar]
Associated Data
This section collects any data citations, data availability statements, or supplementary materials included in this article.
Supplementary Materials
See supplementary material for tabulated domain interface line tension values measured experimentally or estimated theoretically; radial distributions of lipid head and tail groups; visualizations of the all-atom phase-separated system; time evolutions of membrane lateral area, mixing entropy, average distance from protein to domain interface, and minimum distance from protein to domain interface, lipid, protein compositions, and line tension reduction in the simulated systems; mixing entropy of the all-atom phase-separated system; derivations of capillary wave theory and pressure tensor anisotropy expressions of line tension; details of protein monomer simulations; and distributions of minimum distance to the interface (in the xy plane) for protein monomers. Additionally, it describes the derivations and parameterization of the Flory-Huggins model of a phase-separated membrane with a protein.


