

Abstract
Purpose
The aim of this systematic review was to analyse literature on artificial intelligence (AI) and radiomics, including all medical imaging modalities, for oncological and non-oncological applications, in order to assess how far the image mining research stands from routine medical application. To do this, we applied a trial phases classification inspired from the drug development process.
Methods
Among the articles we considered for inclusion from PubMed were multimodality AI and radiomics investigations, with a validation analysis aimed at relevant clinical objectives. Quality assessment of selected papers was performed according to the QUADAS-2 criteria. We developed the phases classification criteria for image mining studies.
Results
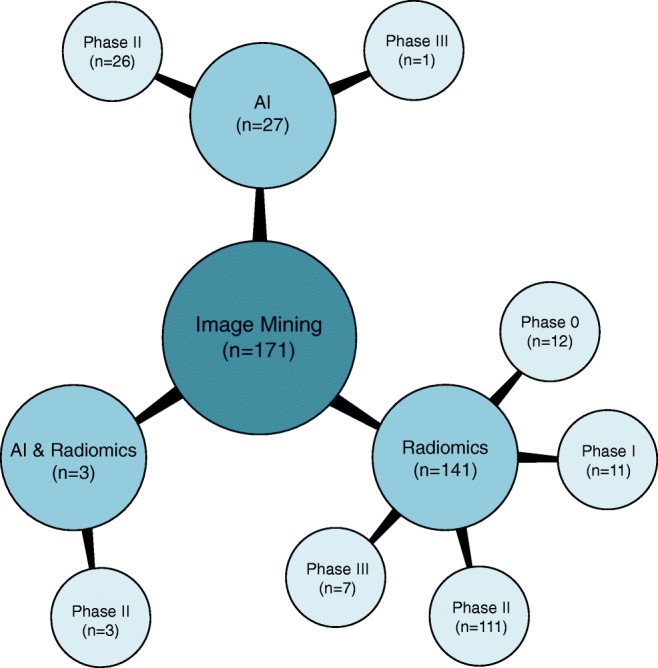
Overall 34,626 articles were retrieved, 300 were selected applying the inclusion/exclusion criteria, and 171 high-quality papers (QUADAS-2 ≥ 7) were identified and analysed. In 27/171 (16%), 141/171 (82%), and 3/171 (2%) studies the development of an AI-based algorithm, radiomics model, and a combined radiomics/AI approach, respectively, was described. A total of 26/27(96%) and 1/27 (4%) AI studies were classified as phase II and III, respectively. Consequently, 13/141 (9%), 10/141 (7%), 111/141 (79%), and 7/141 (5%) radiomics studies were classified as phase 0, I, II, and III, respectively. All three radiomics/AI studies were categorised as phase II trials.
Conclusions
The results of the studies are promising but still not mature enough for image mining tools to be implemented in the clinical setting and be widely used. The transfer learning from the well-known drug development process, with some specific adaptations to the image mining discipline could represent the most effective way for radiomics and AI algorithms to become the standard of care tools.
Electronic supplementary material
The online version of this article (10.1007/s00259-019-04372-x) contains supplementary material, which is available to authorized users.
Keywords: Radiomics, Artificial intelligence, Texture analysis, Imaging, Systematic review, Trial phases
Introduction
The “Artificial Intelligence (AI) winter” [1] is over. AI and radiomics approaches applied to medical images for the non-invasive characterisation of diseases (i.e., image mining) have remarkably increased in recent years. The first reports on AI and radiomics applied to medical images date back to 1963 [2] and 1973 [3], respectively, but the enthusiasm of those years broke off quite soon. Recently, increasing amounts of electronic medical data, technological improvements, and health sustainability issues resulted in a renewed interest in both AI and radiomics applications.
Image mining is claimed to have a potentially huge clinical relevance with the possibility to non-invasively diagnose, characterise and predict the outcome in almost all medical conditions. However, despite the amount of published studies, some issues including significance, goodness, and strength of the reported results are still to be addressed. Particularly, it is not clear how far image mining is from clinical practice.
Therefore, the aim of this systematic review was to analyse literature on AI and radiomics, including all medical imaging modalities, for oncological and non-oncological applications, in order to assess how far the image mining research stands from routine medical application. To do this, we applied a trial phases classification inspired from the drug development process.
Material and methods
This systematic review was performed according to the PRISMA statement [4]. The PRISMA checklist is provided in Supplemental material.
Search, eligibility criteria and study selection
The endpoint of the analysis was to assess the potential of AI applied to medical images and radiomics (i.e., image mining) to be implemented in clinics. Our search algorithm within the PubMed/MEDLINE database consisted of the combination of the following terms: “Artificial intelligence[Mesh]” OR “Radiomic” OR “Radiomics” AND/OR “Radiography[Mesh]”, OR “Ultrasonography[Mesh]” OR “Tomography[Mesh]”, OR “Image interpretation, computed-assisted[Mesh]”, OR “Multimodal imaging[Mesh]”, OR “Tomography, emission-computed[Mesh]”, OR “Photography[Mesh]”. No start date limit was used, and the search was extended until September 5th, 2018.
According to the scope of the review, we considered AI (i.e., algorithms that take images as inputs) and radiomics investigations aimed at relevant objectives in clinical practice: biological characterisation, risk stratification, treatment response prediction, toxicity prediction, and prognostication of a certain disease. The imaging modalities we considered were ultrasound, radiography, mammography, endoscopy, skin pictures, ocular fundus pictures, computed tomography (CT), magnetic resonance imaging (MRI), scintigraphy (either planar images, SPECT, or SPECT/CT) and positron emission tomography (PET) or PET/CT. Subsequently, we applied the following exclusion criteria: (a) articles not in the English language; (b) studies not within the field of interest; (c) guidelines, review articles and meta-analysis, editorials or letters, comments, and conference proceedings; (d) “in vitro”, phantom or animal studies; (e) case reports or small case series (≤ 10 patients); (f) studies involving healthy subjects; (g) research articles focused on methodological aspects (algorithm and/or software development and/or comparison; evaluation/comparison of method(s) for parameters optimization, segmentation and features extraction; test–retest studies); (h) testing data (not medical images) as input for AI algorithm(s); (i) radiomics studies evaluating descriptors of shape and size or image intensity histogram only (i.e., not textural features); (j) lack of validation in a clinical setting; (k) lack of conventional metrics (i.e., sensitivity, specificity, accuracy, and/or hazard ratio, and/or recall, and/or AUC, and/or C-index) for the report of validation results.
Two reviewers (MK and MS) independently performed an initial screening of the identified titles and abstracts applying the inclusion/exclusion criteria. The discrepancies were resolved by a third reviewer (LA). The decision rule for consensus was simple majority. Then, the reviewers retrieved the full-text reports of the selected abstracts and, subsequently, performed an independent second-step selection.
Quality assessment of the literature
Quality assessment of selected papers was performed according to the QUADAS-2 criteria, assessing 4 domains: (1) patient selection, (2) index test, (3) reference standard, and (4) flow and timing [5]. The signalling questions for each QUADAS-2 domain were tailored for the aim of this review as detailed in Table 1. This evaluation assigned the risk of bias to a study and ranked it as low (score = 2), high (score = 1), or indeterminate (score = 0) for each domain. We calculated the overall QUADAS-2 score as the sum of the scores. The appropriateness of statistical analysis was defined considering two aspects. First, the total number of patients analysed was considered appropriate if at least five patients/feature (after feature selection, if performed) were included in a radiomics study; while AI studies with more than 50 patients were considered as acceptable quality. The sample size criterion for radiomics studies was used adapting the conventional rule for multiple regression: the number of data points (i.e., observations or cases) should be considerably more than 5–10 times the number of variables [6]. At least ten patients per feature have been recommended in radiomics studies [7, 8]. The sample size criterion for AI studies was established assuming that at least 50 patients are needed to train and validate an algorithm, minimising the effects of overfitting and improving the quality of performance metrics, similarly to what is recommended for biomarker discovery [9]. Second, we assessed the balance in the number of patients between the subgroups (e.g. number of patients with benign vs malignant lesions in a study aimed at differential diagnosis); an imbalance of more than 2/3 was considered inappropriate.
Table 1.
Description of the QUADAS-2 criteria used for the qualitative assessment
| Patient selection | Index test | Reference standard | Flow and timing |
|---|---|---|---|
| Signalling question 1: Was the statistical management adequate? | Signalling question 1: Were the imaging acquisition protocol and the segmentation method(s) detailed? | Signalling question 1: Was the reference standard adequate? | Signalling question 1: Was there an appropriate interval between index test and reference standard? |
| Signalling question 2: Were the inclusion/exclusion criteria specified? | Signalling question 2: Was the image processing approach detailed? | ||
| Signalling question 3: Was the type of study (retrospective or prospective) specified? | Signalling question 3: Was the validation independent (i.e., no internal)? |
Phases classification criteria
We developed the phases classification criteria for image mining studies, inspired by the classification applied to the clinical trials (Fig. 1). The parameters for phase categorisation included: sample size, type of study (retrospective/prospective), type of validation approach (internal/independent), and the development stage (pre-/post-marketing). Figure 1 reports the classification criteria in detail. We assigned each selected article to a phase: from 0 to IV.
Fig. 1.

Trial phases. Trials classification for the drug development process (a) and for the proposed image mining tools development process (b). PK pharmacokinetics, PD pharmacodynamics
Statistical analysis
A database was created for the qualitative synthesis of the papers and the studies’ results. We recorded the results obtained in the validation set only. In case of multiple aims within the same article, the primary one was considered. If image mining was applied to different imaging modalities within the same article (e.g., PET and CT), results were recorded for each one. If different approaches were tested within the same paper (e.g., models derived from random forest and support vector machine), the best in terms of diagnostic performance was analysed. The articles reporting identical or very similar sample size, research hypothesis, methodology and results sharing with almost the same authorship—“salami” publishing [10]—were excluded to avoid overlap in the study population and results redundancy. Accordingly, in case of a series of articles considered as “salami”, the one with the larger sample size was evaluated and the other(s) excluded. Papers with a QUADAS-2 ≥ 7 were included in the quantitative analysis. Descriptive statistical measures were used to summarise the data. Excel ® 2017 (Microsoft®, Redmond, WA) was used for analysis.
Results
Search, eligibility criteria and study selection
Overall 34,626 articles were retrieved using the search algorithm. Subsequently, 33,997 papers were excluded reviewing titles and abstracts and applying the inclusion/exclusion criteria. Five papers, suspected to be a “salami” publishing, were excluded. Figure 2 summarises the research process. Table S1 reports a qualitative summary of the selected 300, including the 171 high quality articles. In recent years, a striking increase in the number of papers published on image mining occurred. In fact, especially in 2017 and 2018, 66 (22%) and 131 (44%) articles, respectively, were published. Figure 3 shows the literature trend. The vast majority (more than 80%) come from the oncology field. However, more than 50% of the studies included in the qualitative analysis have been assigned a high risk of bias (Fig. 4). Accordingly, a substantial proportion 129/300 (43%) studies have been scored as having a considerable risk of bias, mainly in the “index test” and “patient selection” domains (QUADAS-2 ≤ 6) (Fig. 5). Table S2 reports a qualitative summary of the 171 high-quality (QUADAS ≥7) papers. The temporal trend of the literature according to the phase of the study is shown in Fig. 6. Figures 7, 8, and 9 represent the graphical syntheses of the high-quality articles (QUADAS-2 ≥ 7) considered from three different points of view: the clinician, the imager, and the researcher. Quantitative synthesis is summarised in Table 2. The main results of the phase III studies are reported in Table 3.
Fig. 2.

Study selection workflow
Fig. 3.

Trend of the published studies on artificial intelligence (AI), radiomics and the combined approaches radiomics/AI
Fig. 4.

Trend of literature on image mining according to QUADAS-2 score, considering 300 selected studies
Fig. 5.

QUADAS-2 assessment results. Distribution of the articles tabulated by the four QUADAS-2 domains for the 300 studies selected applying the inclusion/exclusion criteria (a) and for the 171 studies scored ≥7 (b)
Fig. 6.

Trend of literature on image mining according to trial phases classification, considering 300 selected studies (a) and the 171 high-quality studies (b)
Fig. 7.

Radiomics and artificial intelligence literature summary by disease and clinical setting
Fig. 8.

Radiomics and artificial intelligence literature summary by image mining approach and imaging modality
Fig. 9.
Radiomics and artificial intelligence literature summary by image mining approach and phase classification
Table 2.
Quantitative synthesis of the 171 selected articles
| Approach | Domain | Disease | Outcome | Imaging modality | Images, n | Type of validation | Phase | Reference |
|---|---|---|---|---|---|---|---|---|
| AI | Neurology | Alzheimer | Diagnosis | MRI | 834 | Internal | II | [11] |
| Parkinson | Scintigraphy | 175 | [12] | |||||
| Cardiovascular | CAD | Scintigraphy | 308 | Split-sample | II | [13] | ||
| Dentistry | Caries | Radiography | 3000 | II | [14] | |||
| Teeth | 1740 | [15] | ||||||
| Endocrinology | Acromegaly | Photo | 1365 | II | [16] | |||
| GI | Liver | Stage/severity | US,CT | 894 |
Geographical (n = 1) Split-sample (n = 1) |
II, III | [17, 18] | |
| Polyp | Biological characterization | Endoscopy | 1473 |
Split-sample (n = 1) Temporal (n = 1) |
II | [19, 20] | ||
| Infection | H. pylori | Diagnosis | Endoscopy | 43,689 | Split-sample | II | [21] | |
| Mycosis | Photo | 50,925 | Geographical | [22] | ||||
| Oncology | Lung | Diagnosis | CT | 62,492 | Split-sample | II | [23] | |
| Bone | Biological characterization | Radiography | 500 | [24] | ||||
| Brain | MRI | 477 | [25] | |||||
| Cervix | Colposcopy | 485 | [26] | |||||
| Skin | Skin pictures | 129,450 | [27] | |||||
| Esophagus | Treatment response | PET | 107 | Internal | II | [28] | ||
| Ophthalmology | DR | Diagnosis | Fundus pictures | 76,885 | Geographical | II | [29] | |
| Biological characterization | 430 | Split-sample | [30] | |||||
| Stage/severity | 92,961 |
Internal (n = 1) Split-sample (n = 1) |
[31, 32] | |||||
| Macular disease | Biological characterization | 109,312 | Split-sample | [33] | ||||
| Stage/severity | 133,821 | Internal | [34] | |||||
| Orthopedics | Fracture | Diagnosis | Radiography | 258,349 |
Internal (n = 1) Split-sample (n = 1) |
II | [35, 36] | |
| Pneumology | COPD | Outcome | CT | 10,655 | Internal | II | [37] | |
| Radiomics | GI | Liver | Stage/severity | US | 144 | Split-sample | III | [38] |
| Oncology | Bladder | Biological characterization | MRI | 61 | Internal | 0 | [39] | |
| Stage/severity | CT, MRI | 221 | Temporal | II | [40, 41] | |||
| Brain | Diagnosis | MRI | 215 |
Internal (n = 1) Split-sample (n = 1) |
0, I | [42, 43] | ||
| Biological characterization | 3732 |
Geographical (n = 1) Internal (n = 4) Split-sample (n = 11) Temporal (n = 4) |
0 (n = 2), I (n = 1), II (n = 17) | [44–63] | ||||
| Stage/severity | 286 | Split-sample | II | [64] | ||||
| Treatment response | 172 | [65] | ||||||
| Outcome | 812 |
Geographical (n = 1) Internal (n = 3) Split-sample (n = 2) Temporal (n = 1) |
0 (n = 2), I (n = 1), II (n = 4) | [66–72] | ||||
| Breast | Diagnosis | Mammography (n = 5), MRI (n = 4), US (n = 3) | 2922 |
Geographical (n = 1) Internal (n = 9) Split-sample (n = 1) Temporal (n = 1) |
0 (n = 1), II (n = 8), III (n = 3) | [73–84] | ||
| Biological characterization | MRI | 786 |
Internal (n = 2) Split-sample (n = 1) |
I (n = 1), II (n = 2) | [85–87] | |||
| Stage/severity | 309 | Split-sample | II | [88, 89] | ||||
| Treatment response | 220 | Internal, Split-sample | [90, 91] | |||||
| Outcome | MRI, mixed | 407 | [92, 93] | |||||
| Uterus | Biological characterization | MRI | 160 | Internal | III | [94] | ||
| Stage/severity | PET | 115 | Split-sample | II | [95] | |||
| Outcome | PET (n = 2), mixed (n = 2) | 408 | I (n = 2), II (n = 2) | [96–99] | ||||
| Colorectal | Biological characterization | CT | 443 | Split-sample | II | [100, 101] | ||
| Stage/severity | 1791 | Temporal | [102–104] | |||||
| Treatment response | CT (n = 1), MRI (n = 3) | 701 | Geographical (n = 1), Internal (n = 1), Split-sample (n = 2) | 0 (n = 1), II (n = 3) | [105–108] | |||
| Outcome | MRI | 108 | Split-sample | II | [109] | |||
| Esophagus | Stage/severity | CT (n = 2), MRI (n = 1) | 608 |
Split-sample (n = 2) Temporal (n = 1) |
II | [110–112] | ||
| Treatment response | CT, MRI, PET | 195 | Internal (n = 2), Split-sample (n = 1) | 0, I, II | [113–115] | |||
| Outcome | CT | 239 | Split-sample | II | [116] | |||
| GIST | Biological characterization | 222 | II | [117] | ||||
| Kidney | 53 | Internal | 0 | [118] | ||||
| Liver | Stage/severity | 304 | Split-sample | II | [119] | |||
| H&N | Diagnosis | US | 210 | Internal | II | [120] | ||
| Biological characterization | CT | 969 |
Split-sample (n = 1) Temporal (n = 2) |
I (n = 1), II (n = 2) | [121–123] | |||
| Treatment response | MRI | 120 | Internal | II | [124] | |||
| Outcome | CT (n = 2), MRI (n = 2), PET (n = 1) | 1232 |
Geographical (n = 1) Split-sample (n = 3) Temporal (n = 1) |
II (n = 4), III (n = 1) | [125–129] | |||
| Toxicity | MRI | 93 | Geographical | I | [130] | |||
| Mixed tumors | Biological characterization | CT | 272 | Split-sample | II | [131] | ||
| Toxicity | 32 | Internal | 0 | [132] | ||||
| Lung | Diagnosis | 1692 |
Internal (n = 2) Geographical (n = 1) Split-sample (n = 2) |
II | [133–137] | |||
| Biological characterization | CT (n = 13), PET (n = 2) | 5235 |
Internal (n = 3) Geographical (n = 4) Split-sample (n = 4) Temporal (n = 3) |
I (n = 1), II (n = 13) | [138–151] | |||
| Stage/severity | CT | 855 |
Internal (n = 2) Split-sample (n = 2) |
II | [152–155] | |||
| Treatment response | 85 | Internal | 0 | [156] | ||||
| Outcome | CT (n = 7), PET (n = 2), mixed (n = 2) | 3125 |
Internal (n = 3) Geographical (n = 2) Split-sample (n = 5) Temporal (n = 1) |
0 (n = 1), II (n = 9), III (n = 1) | [157–167] | |||
| Toxicity | CT | 192 | Internal | II | [168] | |||
| Ocular | Diagnosis | MRI | 157 | Split-sample | [169] | |||
| Ovary | US | 264 | Geographical | III | [170] | |||
| Pancreas | CT | 103 | Internal | II | [171] | |||
| Prostate | Biological characterization | MRI | 316 | Split-sample | [172] | |||
| Outcome | 120 | Geographical | [173] | |||||
| Sarcoma | Biological characterization | 19 | Split-sample | I | [174] | |||
| Outcome | CT | 150 | Temporal | II | [175] | |||
| Skin | Diagnosis | Skin pictures | 162 | Geographical | [176] | |||
| Ophthalmology | Macular disease | Biological characterization | Fundus pictures | 457 | Temporal | II | [177] | |
| Pneumology | COPD | Diagnosis | CT | 162 | Split-sample | III | [178] | |
| Combined AI and radiomics | Oncology | Breast | Diagnosis | Mammography | 600 | Split-sample | II | [179] |
| Brain | Biological characterization | MRI | 119 | Internal | II | [180] | ||
| Outcome | 112 | Geographical | II | [181] |
AI artificial intelligence, AUC area under the curve, CAD coronary artery disease, COPD chronic obstructive pulmonary disease, CT computed tomography, H&N head and neck, GI gastrointestinal, GIST gastrointestinal stromal tumors, MRI magnetic resonance imaging, PET positron emission tomography, US ultrasonography
Table 3.
Summary of the results of the phase III trials on image mining (n = 8)
| Approach | Domain/disease | Outcome | Imaging modality | Images, n | Main results | Reference |
|---|---|---|---|---|---|---|
| AI | GI/Liver | Stage/severity | US | 398 | AUC = 0.85 | [17] |
| Radiomics | 144 | [38] | ||||
| Oncology/Breast | Diagnosis | US | 147 | AUC = 0.93 | [80] | |
| Oncology/Cervix | Biological characterization | MRI | 160 | Accuracy = 69% | [94] | |
| Oncology/H&N | Outcome | CT | 172 | C-Index = 0.73 | [127] | |
| PET | C-Index = 0.71 | |||||
| Oncology/Lung | PET | 312 | C-Index = 0.59 | [163] | ||
| Oncology/Ovary | Diagnosis | US | 264 | Sensitivity = 98% | [170] | |
| Specificity = 88% | ||||||
| Pulmonary/COPD | CT | 162 | AUC = 0.89 | [178] |
AI artificial intelligence, AUC area under the curve, COPD chronic obstructive pulmonary disease, CT computed tomography, H&N head and neck, GI gastrointestinal, MRI magnetic resonance imaging, PET positron emission tomography, US ultrasonography
Discussion
The present systematic review is the first assessing the potential for implementation of image mining tools in clinical practice, by means of classification of the literature in development phases. Despite the amount of literature on image mining with a validation analysis, more than 90% of studies were classified as phase 0, I or II (i.e., retrospective). Collectively, their results were uncertain in terms of significance, goodness, and strength and their generalisability weak. Even among the studies with a QUADAS-2 ≥ 7, only 4.6% were categorised as phase III studies. As it emerges from the present systematic review, the results are promising but still not mature enough for clinical implementation and widespread use of image mining tools. Nonetheless, the study quality has increased in recent years.
Because of the paucity of phase III and IV studies, we did not proceed to a meta-analysis. Therefore, no definitive conclusion can be drawn on which approach among radiomics and AI should be preferred. AI techniques, in particular convolutional neural networks, have the advantage over radiomics of not requiring tumour segmentation, feature calculation and selection. These steps are even more critical in tiny lesions that have to be submitted to radiomics processing. On the other hand, vast cohorts are crucial for a robust AI-based model development that require big efforts to be collected and analysed. Also, an unbiased reference standard, not always easy to obtain, should be chosen to ensure AI model reliability. The combined radiomics/AI strategy is at its early stages [179–183] and the complementary role of radiomics and AI techniques should be addressed [184]. Which is the best image mining approach is still an open question.
Similar to the other “omics” domains (e.g., proteomics), few of the image mining biomarkers reached clinical practice [9]. The translation of image mining research in the clinical arena is limited by the huge variability of the methods used for image analysis, together with the impasse to reproduce the results when tested in a different cohort of patients. Validation is a critical issue. Theoretically, the validation analysis of a successful model should provide consistent performance measures to those obtained in the training process. Thereafter, results obtained in the validation cohort should be confirmed by the test-independent validation. Finally, the proposed approach should be effective for the indication within the “real world” population of patients the model has been developed for. The validation process may be internal (e.g., cross-validation and bootstrapping) or external (using data not used for training). Typically, the internal one, used for a preliminary evaluation or for the fine-tuning of the model under development, overestimate the performance [185]. In fact, the same cohort is used twice, once to choose the filtered subset and again to build a classification model resulting in the overfitting of the algorithm to the data [9]. The external validation may be performed using three different strategies: (i) temporal (i.e., data obtained in newly recruited patients), (ii) geographic (i.e., data collected in a different institution), and (iii) split-sample (i.e., data split from the entire dataset and kept untouched for the test). External validation is crucial to verify the generalisability of the results [185]; and the random patient selection is an essential prerequisite, as well as the balance in patient characteristics. Temporal or geographic validations should be preferred to the split-sample one. Particularly, the geographic validation, which accounts for technical variability aspects (scanners, acquisition parameters and protocols) [185], is expected to be more representative of the clinical setting.
We excluded a priori from the present analysis studies testing shape and size as well as histogram-based features since our aim was to assess the “maturity” of advanced image analysis at its’ full potential, entailing textural indexes derived from up to second-order features. Image analysis based on the gray level histogram only does not provide any information about the relative position of pixels/voxels to each other within the region of interest. Therefore, these features are not able to describe whether any low/high gray levels are positioned together, or if they are distributed between high/low-value gray levels [186].
In order to develop a valid and trustworthy image mining tool the cohorts in study (training, validation and test) should be representative of the target population. This means that the sample size should be big enough to minimise the effects of overfitting, be comprehensive of the “outliers”, and, consequently, be reliable when used for the assessment of unseen patients. We proposed that at least 50 patients should be included in AI studies, as also suggested by simulated analyses [9, 187, 188]. However, especially for deep learning approaches and complex tasks, much larger populations are needed. The effect of the sample size on the model performance has been already demonstrated. When a limited dataset (1000 samples) vs the complete dataset (>100,000) was used for retinopathy classifier development, the weighted error resulted as 12.7% vs 6.6%, respectively [33]. Moreover, the sample size was not the only criterion used to score papers. Accordingly, even if the number of patients was relatively low, only well-designed studies have been scored as having low risk of bias and included in the quantitative analysis.
In the present work we arbitrarily chose 100 samples as the threshold for trial phases categorisation (II vs III ad above). This was a conservative decision. The conventional rule of the necessity to include at least ten patients per tested variable if applied for phase classification would have led to downgrading of most of the studies. Considering the fact that generally a feature reduction strategy was put in place we chose 100 as a reasonable cut-off. When planning an image mining study, both statistical recommendations (sample size and prospective design) and clinical conditions’ variability should be considered in order to develop an algorithm on a dataset that realistically represents the target patient population. The sample size calculation has been estimated in only 3 out of the 171 papers [44, 88, 125]. The use of multiple images taken from the same patient should be limited since they are prone to be similar (or almost identical) with a negative impact on the generalisability potential. In fact, even if this process increases the sample size, the multiplied number of observations (or cases) not representative of the inter-patient variability, overestimates the model performance. Accordingly, data augmentation should be properly used to avoid overfitting, keeping in mind that it cannot completely overcome the requirement of a proper sample size.
To assess the appropriateness of the statistical analysis, we considered not only the sample size but also the number of patients within the subgroups (an imbalance of more than 2/3 was considered inappropriate). Imbalanced cohorts in image mining studies may lead to constitutively biased results, which confer higher uncertainty and poor generalisability [189]. Consequently, in the developmental phase, proper study design and analysis strategy using stratification, matching, weighting, covariate adjustment, or regression should be adopted. Therefore, imbalance per se does not prevent the use of radiomic and AI-based approaches when the prevalence of a disease or an outcome is very low [190].
The applicability of the image mining framework to rare diseases is still an issue because of the limited data availability for model development. Transversal platforms for sharing and analysis of images and data, as envisaged by some research groups [191], could represent a valuable strategy for the investigations in this field.
Presently, it is unrealistic to justify a medical decision by the output provided by a neural network or a radiomics feature/signature. Little or nothing is still known on the biological significance of the image-derived parameters. Correlations with tumour grading [39, 45, 46, 94, 100, 117, 118, 138, 174], inflammatory infiltrate [131], gene expression, mutation and molecular pathways [25, 44, 47–58, 85–87, 101, 121, 122, 139–142, 180] have been reported. Nonetheless, more should be learned about the functioning of AI and radiomics approaches in order to solve the “black box” problem and to understand the underlying clinical and/or molecular connotation. Imagers should be able to assess the reliability of image mining approaches and to manage independently the patient (i.e., the pilot, plane and passengers during a flight). This innovative attitude, which implies the acquisition of technical and informatics skills, will contribute to remove the “black box” uncertainties, and to promote image mining towards clinical practice.
Additionally, some technical barriers should be faced when considering implementing image mining tools into the every-day practice. These include a time-consuming workflow; uncertain reproducibility of results among different scanners, acquisition protocols, and image-processing approaches; regulatory issues concerning privacy and ethics; and data protection. Common efforts should be realised to accelerate the research path on these aspects, and to implement the technological infrastructure and make the tools easy to use. Privacy and ethics regulations may restrict data and image sharing for the purpose of research and every-day clinical practice. A shared strategy needs to be built up for the management of these aspects. These challenges are an opportunity to develop a reliable methodology able to provide controlled data collection and secure infrastructure, instead of gathering uncertain-quality datasets.
The need to provide reliable results has generated multiple initiatives and recommendations to achieve methodology standardisation and reproducibility [7, 185, 191–193]. The increasing awareness among researchers of the urgency to increase the quality of the investigations determined an increase in the number of phase III trials in the last 2 years. In the era of evidence-based medicine, rigorous research with strict rules is the only way forward to achieve clinical acceptance and become part of the “standard of care”. The research process should aim to address a clinical need through an adequate statistical strategy, prospective and multi centre studies, robust reference standards, and adequate timing. Independent validation is mandatory together with the clarification of the impact of the technical aspects on image mining models. These items imply that reproducible, strong, and, hopefully, excellent results will be achieved through an adequate research process. In this respect, a closer collaboration should be established among clinical researchers, algorithm developers and data scientists.
We foresee the transfer learning from the well-known drug development process, with some specific adaptations, to the image mining discipline as the most effective way for radiomics and AI algorithms to get into routine clinical practice and avoid a new glacial era of image mining in the next decades.
Electronic supplementary material
(DOCX 31 kb)
Acknowledgments
We thank Prof. Wim Oyen for advice and critical discussion. We thank Eng. Luca Antiga for inspiring talks and collaboration. We thank Dr. Marra for her support in setting the literature search strategy.
Author contributions
MS and MK planned the study, performed article search and selection, analyzed the data, and drafted the manuscript. LA gave support during study search and selection. AC conceptualized the study, coordinated the study workflow, and critically reviewed the manuscript. All the authors reviewed the final version of the text.
Funding
M. Kirienko's PhD scholarship is supported by the AIRC grant (IG-2016-18585).
Compliance with ethical standards
Ethics
This manuscript does not involve any study on animals or humans.
Conflict of interest
The authors declare no conflict of interest related to the present work.
Footnotes
This article is part of the Topical Collection on Advanced Image Analyses (Radiomics and Artificial Intelligence).
Publisher’s note
Springer Nature remains neutral with regard to jurisdictional claims in published maps and institutional affiliations.
References
- 1.Bohannon J, Bohannon J. Fears of an AI pioneer. Science (80- ) 2015;349:252. doi: 10.1126/science.349.6245.252. [DOI] [PubMed] [Google Scholar]
- 2.Lodwick GS, Keats TE, Dorst JP. The coding of roentgen images for computer analysis as applied to lung cancer. Radiology. 1963;81:185–200. doi: 10.1148/81.2.185. [DOI] [PubMed] [Google Scholar]
- 3.Haralick R, Shanmugam K, Dinstein I. Texture features for image classification. IEEE Trans Sys Man Cybern. 1973;SMC 3:610–621. [Google Scholar]
- 4.Zorzela L, Loke Y, Ioannidis J, Golder S, Santaguida P, Altman D, et al. PRISMA harms checklist: improving harms reporting in systematic reviews. BMJ. 2016;352:i157. doi: 10.1136/bmj.i157. [DOI] [PubMed] [Google Scholar]
- 5.Whiting PF, Rutjes AWS, Westwood ME, Mallett S, Deeks JJ, Reitsma JB, et al. QUADAS-2: strumento per valutare la qualità degli studi di accuratezza diagnostica. Evidence. 2016;8:e1000131. [Google Scholar]
- 6.Kleinbaum DG, Kupper LL, Muller KE, editors. Applied regression analysis and other multivariable methods. Boston: PWS Kent Publishing Co; 1988. [Google Scholar]
- 7.Sollini M, Cozzi L, Antunovic L, Chiti A, Kirienko M. PET radiomics in NSCLC: state of the art and a proposal for harmonization of methodology. Sci Rep. 2017;7:358. [DOI] [PMC free article] [PubMed]
- 8.Gillies Robert J., Kinahan Paul E., Hricak Hedvig. Radiomics: Images Are More than Pictures, They Are Data. Radiology. 2016;278(2):563–577. doi: 10.1148/radiol.2015151169. [DOI] [PMC free article] [PubMed] [Google Scholar]
- 9.Hernández B, Parnell A, Pennington SR. Why have so few proteomic biomarkers “survived” validation? (sample size and independent validation considerations) Proteomics. 2014;14:1587–1592. doi: 10.1002/pmic.201300377. [DOI] [PubMed] [Google Scholar]
- 10.Supak Smolcić V. Salami publication: definitions and examples. Biochem medica. 2013;23:237–41. [DOI] [PMC free article] [PubMed]
- 11.Tong Tong, Wolz Robin, Gao Qinquan, Guerrero Ricardo, Hajnal Joseph V., Rueckert Daniel. Multiple instance learning for classification of dementia in brain MRI. Medical Image Analysis. 2014;18(5):808–818. doi: 10.1016/j.media.2014.04.006. [DOI] [PubMed] [Google Scholar]
- 12.Acton PD, Newberg A. Artificial neural network classifier for the diagnosis of Parkinson’s disease using [99mTc]TRODAT-1 and SPECT. Phys Med Biol. 2006;51:3057–3066. doi: 10.1088/0031-9155/51/12/004. [DOI] [PubMed] [Google Scholar]
- 13.Guner LA, Karabacak NI, Akdemir OU, Karagoz PS, Kocaman SA, Cengel A, et al. An open-source framework of neural networks for diagnosis of coronary artery disease from myocardial perfusion SPECT. J Nucl Cardiol. 2010;17:405–413. doi: 10.1007/s12350-010-9207-5. [DOI] [PubMed] [Google Scholar]
- 14.Lee JH, Kim DH, Jeong SN, Choi SH. Detection and diagnosis of dental caries using a deep learning-based convolutional neural network algorithm. J Dent. 2018;77:106–111. doi: 10.1016/j.jdent.2018.07.015. [DOI] [PubMed] [Google Scholar]
- 15.Lee J-H, Kim D-H, Jeong S-N, Choi S-H. Diagnosis and prediction of periodontally compromised teeth using a deep learning-based convolutional neural network algorithm. J Periodontal Implant Sci. 2018;48:114–123. doi: 10.5051/jpis.2018.48.2.114. [DOI] [PMC free article] [PubMed] [Google Scholar]
- 16.Kong X, Gong S, Su L, Howard N, Kong Y. Automatic detection of acromegaly from facial photographs using machine learning methods. EBioMedicine. 2018;27:94–102. doi: 10.1016/j.ebiom.2017.12.015. [DOI] [PMC free article] [PubMed] [Google Scholar]
- 17.Wang K, Lu X, Zhou H, Gao Y, Zheng J, Tong M, et al. Deep learning radiomics of shear wave elastography significantly improved diagnostic performance for assessing liver fibrosis in chronic hepatitis B: a prospective multicentre study. Gut. 2018:1–13. [DOI] [PMC free article] [PubMed]
- 18.Yasaka K, Akai H, Kunimatsu A, Abe O, Kiryu S. Deep learning for staging liver fibrosis on CT: a pilot study. Eur Radiol. 2018;28:4578–4585. doi: 10.1007/s00330-018-5499-7. [DOI] [PubMed] [Google Scholar]
- 19.Komeda Y, Handa H, Watanabe T, Nomura T, Kitahashi M, Sakurai T, et al. Computer-aided diagnosis based on convolutional neural network system for colorectal polyp classification: preliminary experience. Oncology. 2017;93:30–34. doi: 10.1159/000481227. [DOI] [PubMed] [Google Scholar]
- 20.Byrne MF, Chapados N, Soudan F, Oertel C, Linares Pérez M, Kelly R, et al. Real-time differentiation of adenomatous and hyperplastic diminutive colorectal polyps during analysis of unaltered videos of standard colonoscopy using a deep learning model. Gut. 2017;68:94–100. doi: 10.1136/gutjnl-2017-314547. [DOI] [PMC free article] [PubMed] [Google Scholar]
- 21.Shichijo Satoki, Nomura Shuhei, Aoyama Kazuharu, Nishikawa Yoshitaka, Miura Motoi, Shinagawa Takahide, Takiyama Hirotoshi, Tanimoto Tetsuya, Ishihara Soichiro, Matsuo Keigo, Tada Tomohiro. Application of Convolutional Neural Networks in the Diagnosis of Helicobacter pylori Infection Based on Endoscopic Images. EBioMedicine. 2017;25:106–111. doi: 10.1016/j.ebiom.2017.10.014. [DOI] [PMC free article] [PubMed] [Google Scholar]
- 22.Han SS, Park GH, Lim W, Kim MS, Na JI, Park I, et al. Deep neural networks show an equivalent and often superior performance to dermatologists in onychomycosis diagnosis: automatic construction of onychomycosis datasets by region-based convolutional deep neural network. PLoS One. 2018;13:1–14. doi: 10.1371/journal.pone.0191493. [DOI] [PMC free article] [PubMed] [Google Scholar]
- 23.Li Wei, Cao Peng, Zhao Dazhe, Wang Junbo. Pulmonary Nodule Classification with Deep Convolutional Neural Networks on Computed Tomography Images. Computational and Mathematical Methods in Medicine. 2016;2016:1–7. doi: 10.1155/2016/6215085. [DOI] [PMC free article] [PubMed] [Google Scholar]
- 24.Poedjiastoeti W, Suebnukarn S. Application of convolutional neural network in the diagnosis of jaw tumors. Healthc Inform Res. 2018;24:236–241. doi: 10.4258/hir.2018.24.3.236. [DOI] [PMC free article] [PubMed] [Google Scholar]
- 25.Akkus Z, Ali I, Sedlář J, Agrawal JP, Parney IF, Giannini C, et al. Predicting deletion of chromosomal arms 1p/19q in low-grade gliomas from MR images using machine intelligence. J Digit Imaging. 2017;30:469–476. doi: 10.1007/s10278-017-9984-3. [DOI] [PMC free article] [PubMed] [Google Scholar]
- 26.Sato M, Horie K, Hara A, Miyamoto Y, Kurihara K, Tomio K, et al. Application of deep learning to the classification of images from colposcopy. Oncol Lett. 2018;15:3518–3523. doi: 10.3892/ol.2018.7762. [DOI] [PMC free article] [PubMed] [Google Scholar]
- 27.Esteva Andre, Kuprel Brett, Novoa Roberto A., Ko Justin, Swetter Susan M., Blau Helen M., Thrun Sebastian. Dermatologist-level classification of skin cancer with deep neural networks. Nature. 2017;542(7639):115–118. doi: 10.1038/nature21056. [DOI] [PMC free article] [PubMed] [Google Scholar]
- 28.Ypsilantis PP, Siddique M, Sohn HM, Davies A, Cook G, Goh V, et al. Predicting response to neoadjuvant chemotherapy with PET imaging using convolutional neural networks. PLoS One. 2015;10:1–18. doi: 10.1371/journal.pone.0137036. [DOI] [PMC free article] [PubMed] [Google Scholar]
- 29.Gargeya Rishab, Leng Theodore. Automated Identification of Diabetic Retinopathy Using Deep Learning. Ophthalmology. 2017;124(7):962–969. doi: 10.1016/j.ophtha.2017.02.008. [DOI] [PubMed] [Google Scholar]
- 30.Niemeijer M, van Ginneken B, Russell SR, Suttorp-Schulten MSA, Abràmoff MD. Automated detection and differentiation of drusen, exudates, and cotton-wool spots in digital color fundus photographs for diabetic retinopathy diagnosis. Invest Ophthalmol Vis Sci. 2007;48:2260–2267. doi: 10.1167/iovs.06-0996. [DOI] [PMC free article] [PubMed] [Google Scholar]
- 31.Takahashi H, Tampo H, Arai Y, Inoue Y, Kawashima H. Applying artificial intelligence to disease staging: deep learning for improved staging of diabetic retinopathy. PLoS One. 2017;12:1–11. doi: 10.1371/journal.pone.0179790. [DOI] [PMC free article] [PubMed] [Google Scholar]
- 32.Raju M, Pagidimarri V, Barreto R, Kadam A, Kasivajjala V, Aswath A. Development of a deep learning algorithm for automatic diagnosis of diabetic retinopathy. Stud Health Technol Inform. 2017;245:559–563. [PubMed] [Google Scholar]
- 33.Kermany DDS, Goldbaum M, Cai W, Valentim CCS, Liang H, Baxter SL, et al. Identifying medical diagnoses and treatable diseases by image-based deep learning. Cell. 2018;172:1122–1131.e1129. doi: 10.1016/j.cell.2018.02.010. [DOI] [PubMed] [Google Scholar]
- 34.Burlina PM, Joshi N, Pekala M, Pacheco KD, Freund DE, Bressler NM. Automated grading of age-related macular degeneration from color fundus images using deep convolutional neural networks. JAMA Ophthalmol. 2017;135:1170–1176. doi: 10.1001/jamaophthalmol.2017.3782. [DOI] [PMC free article] [PubMed] [Google Scholar]
- 35.Olczak J, Fahlberg N, Maki A, Razavian AS, Jilert A, Stark A, et al. Artificial intelligence for analyzing orthopedic trauma radiographs: deep learning algorithms—are they on par with humans for diagnosing fractures? Acta Orthop. 2017;88:581–586. doi: 10.1080/17453674.2017.1344459. [DOI] [PMC free article] [PubMed] [Google Scholar]
- 36.Chung SW, Han SS, Lee JW, Oh KS, Kim NR, Yoon JP, et al. Automated detection and classification of the proximal humerus fracture by using deep learning algorithm. Acta Orthop. 2018;89:468–473. doi: 10.1080/17453674.2018.1453714. [DOI] [PMC free article] [PubMed] [Google Scholar]
- 37.Gonzalez G, Ash SY, Vegas-Sánchez-Ferrero G, Onieva JO, Rahaghi FN, Ross JC, et al. Disease staging and prognosis in smokers using deep learning in chest computed tomography. Am J Respir Crit Care Med. 2018;197:193–203. doi: 10.1164/rccm.201705-0860OC. [DOI] [PMC free article] [PubMed] [Google Scholar]
- 38.Li W, Huang Y, Zhuang BW, Liu GJ, Hu HT, Li X, et al. Multiparametric ultrasomics of significant liver fibrosis: a machine learning-based analysis. Eur Radiol. 2019;29:1496–1506. doi: 10.1007/s00330-018-5680-z. [DOI] [PMC free article] [PubMed] [Google Scholar]
- 39.Zhang X, Xu X, Tian Q, Li B, Wu Y, Yang Z, et al. Radiomics assessment of bladder cancer grade using texture features from diffusion-weighted imaging. J Magn Reson Imaging. 2017;46:1281–1288. doi: 10.1002/jmri.25669. [DOI] [PMC free article] [PubMed] [Google Scholar]
- 40.Wu S, Zheng J, Li Y, Yu H, Shi S, Xie W, et al. A radiomics nomogram for the preoperative prediction of lymph node metastasis in bladder cancer. Clin Cancer Res. 2017;23:6904–6911. doi: 10.1158/1078-0432.CCR-17-1510. [DOI] [PubMed] [Google Scholar]
- 41.Wu S, Zheng J, Li Y, Wu Z, Shi S, Huang M, et al. Development and validation of an MRI-based radiomics signature for the preoperative prediction of lymph node metastasis in bladder cancer. EBioMedicine. 2018;34:76–84. doi: 10.1016/j.ebiom.2018.07.029. [DOI] [PMC free article] [PubMed] [Google Scholar]
- 42.Zhang Z, Yang J, Ho A, Jiang W, Logan J, Wang X, et al. A predictive model for distinguishing radiation necrosis from tumor progression after gamma knife radiosurgery based on radiomic features from MR images HHS public access. Eur Radiol. 2018;28:2255–2263. doi: 10.1007/s00330-017-5154-8. [DOI] [PMC free article] [PubMed] [Google Scholar]
- 43.Kim JY, Park JE, Jo Y, Shim WH, Nam SJ, Kim JH, et al. Incorporating diffusion- and perfusion-weighted MRI into a radiomics model improves diagnostic performance for pseudoprogression in glioblastoma patients. Neuro-Oncology. 2018:1–11. [DOI] [PMC free article] [PubMed]
- 44.Wei J, Yang G, Hao X, Gu D, Tan Y, Wang X, et al. A multi-sequence and habitat-based MRI radiomics signature for preoperative prediction of MGMT promoter methylation in astrocytomas with prognostic implication. Eur Radiol. 2019;29:877–888. doi: 10.1007/s00330-018-5575-z. [DOI] [PMC free article] [PubMed] [Google Scholar]
- 45.Coroller TP, Bi WL, Huynh E, Abedalthagafi M, Aizer AA, Greenwald NF, et al. Radiographic prediction of meningioma grade by semantic and radiomic features. PLoS One. 2017;12:1–15. doi: 10.1371/journal.pone.0187908. [DOI] [PMC free article] [PubMed] [Google Scholar]
- 46.Chen W, Liu B, Peng S, Sun J, Qiao X. Computer-aided grading of gliomas combining automatic segmentation and radiomics. Int J Biomed Imaging. 2018;2018:2512037. doi: 10.1155/2018/2512037. [DOI] [PMC free article] [PubMed] [Google Scholar]
- 47.Rathore S, Akbari H, Rozycki M, Abdullah KG, Nasrallah MP, Binder ZA, et al. Radiomic MRI signature reveals three distinct subtypes of glioblastoma with different clinical and molecular characteristics, offering prognostic value beyond IDH1. Sci Rep. 2018;8:1–12. doi: 10.1038/s41598-018-22739-2. [DOI] [PMC free article] [PubMed] [Google Scholar]
- 48.Li Z-C, Bai H, Sun Q, Li Q, Liu L, Zou Y, et al. Multiregional radiomics features from multiparametric MRI for prediction of MGMT methylation status in glioblastoma multiforme: a multicentre study. Eur Radiol. 2018;28:3640–3650. doi: 10.1007/s00330-017-5302-1. [DOI] [PubMed] [Google Scholar]
- 49.Arita H, Kinoshita M, Kawaguchi A, Takahashi M, Narita Y, Terakawa Y, et al. Lesion location implemented magnetic resonance imaging radiomics for predicting IDH and TERT promoter mutations in grade II/III gliomas. Sci Rep. 2018;8:1–10. doi: 10.1038/s41598-018-30273-4. [DOI] [PMC free article] [PubMed] [Google Scholar]
- 50.Li Y, Liu X, Qian Z, Sun Z, Xu K, Wang K, et al. Genotype prediction of ATRX mutation in lower-grade gliomas using an MRI radiomics signature. Eur Radiol. 2018;28:2960–2968. doi: 10.1007/s00330-017-5267-0. [DOI] [PubMed] [Google Scholar]
- 51.Zhang X, Tian Q, Wang L, Liu Y, Li B, Liang Z, et al. Radiomics strategy for molecular subtype stratification of lower-grade glioma: detecting IDH and TP53 mutations based on multimodal MRI. J Magn Reson Imaging. 2018;48:916–926. doi: 10.1002/jmri.25960. [DOI] [PubMed] [Google Scholar]
- 52.Akbari H, Bakas S, Pisapia JM, Nasrallah MP, Rozycki M, Martinez-Lage M, et al. In vivo evaluation of EGFRvIII mutation in primary glioblastoma patients via complex multiparametric MRI signature. Neuro-Oncology. 2018;20:1068–1079. doi: 10.1093/neuonc/noy033. [DOI] [PMC free article] [PubMed] [Google Scholar]
- 53.Lu CF, Hsu FT, Hsieh KLC, Kao YCJ, Cheng SJ, Hsu JBK, et al. Machine learning–based radiomics for molecular subtyping of gliomas. Clin Cancer Res. 2018;24:4429–4436. doi: 10.1158/1078-0432.CCR-17-3445. [DOI] [PubMed] [Google Scholar]
- 54.Han Y, Xie Z, Zang Y, Zhang S, Gu D, Zhou M, et al. Non-invasive genotype prediction of chromosome 1p/19q co-deletion by development and validation of an MRI-based radiomics signature in lower-grade gliomas. J Neuro-Oncol. 2018;140:297–306. doi: 10.1007/s11060-018-2953-y. [DOI] [PubMed] [Google Scholar]
- 55.Li Y, Liu X, Xu K, Qian Z, Wang K, Fan X, et al. MRI features can predict EGFR expression in lower grade gliomas: a voxel-based radiomic analysis. Eur Radiol. 2018;28:356–362. doi: 10.1007/s00330-017-4964-z. [DOI] [PubMed] [Google Scholar]
- 56.García-Gómez JM, Luts J, Julià-Sapé M, Krooshof P, Tortajada S, Robledo JV, et al. Multiproject-multicenter evaluation of automatic brain tumor classification by magnetic resonance spectroscopy. MAGMA. 2009;22:5–18. doi: 10.1007/s10334-008-0146-y. [DOI] [PMC free article] [PubMed] [Google Scholar]
- 57.Li Y, Qian Z, Xu K, Wang K, Fan X, Li S, et al. Radiomic features predict Ki-67 expression level and survival in lower grade gliomas. J Neuro-Oncol. 2017;135:317–324. doi: 10.1007/s11060-017-2576-8. [DOI] [PubMed] [Google Scholar]
- 58.Li Y, Qian Z, Xu K, Wang K, Fan X, Li S, et al. MRI features predict p53 status in lower-grade gliomas via a machine-learning approach. NeuroImage Clin. 2018;17:306–311. doi: 10.1016/j.nicl.2017.10.030. [DOI] [PMC free article] [PubMed] [Google Scholar]
- 59.Ortiz-Ramón R, Larroza A, Ruiz-España S, Arana E, Moratal D. Classifying brain metastases by their primary site of origin using a radiomics approach based on texture analysis: a feasibility study. Eur Radiol. 2018;28:4514–4523. doi: 10.1007/s00330-018-5463-6. [DOI] [PubMed] [Google Scholar]
- 60.Suh HB, Choi YS, Bae S, Ahn SS, Chang JH, Kang SG, et al. Primary central nervous system lymphoma and atypical glioblastoma: differentiation using radiomics approach. Eur Radiol. 2018;28:3832–3839. doi: 10.1007/s00330-018-5368-4. [DOI] [PubMed] [Google Scholar]
- 61.Chen Y, Li Z, Wu G, Yu J, Wang Y, Lv X, et al. Primary central nervous system lymphoma and glioblastoma differentiation based on conventional magnetic resonance imaging by high-throughput SIFT features. Int J Neurosci. 2018;128:608–618. doi: 10.1080/00207454.2017.1408613. [DOI] [PubMed] [Google Scholar]
- 62.Kang D, Park JE, Kim YH, Kim JH, Oh JY, Kim J, et al. Diffusion radiomics as a diagnostic modal for atypical manifestation of primary central nervous system lymphoma: development and multicenter external validation. Neuro-Oncology. 2018;20:1251–1261. doi: 10.1093/neuonc/noy021. [DOI] [PMC free article] [PubMed] [Google Scholar]
- 63.Yu Jinhua, Shi Zhifeng, Lian Yuxi, Li Zeju, Liu Tongtong, Gao Yuan, Wang Yuanyuan, Chen Liang, Mao Ying. Noninvasive IDH1 mutation estimation based on a quantitative radiomics approach for grade II glioma. European Radiology. 2016;27(8):3509–3522. doi: 10.1007/s00330-016-4653-3. [DOI] [PubMed] [Google Scholar]
- 64.Liu Z, Wang Y, Liu X, Du Y, Tang Z, Wang K, et al. Radiomics analysis allows for precise prediction of epilepsy in patients with low-grade gliomas. NeuroImage Clin. 2018;19:271–278. doi: 10.1016/j.nicl.2018.04.024. [DOI] [PMC free article] [PubMed] [Google Scholar]
- 65.Kickingereder P, Götz M, Muschelli J, Wick A, Neuberger U, Shinohara RT, et al. Large-scale Radiomic profiling of recurrent glioblastoma identifies an imaging predictor for stratifying anti-Angiogenic treatment response. Clin Cancer Res. 2016;22:5765–5771. doi: 10.1158/1078-0432.CCR-16-0702. [DOI] [PMC free article] [PubMed] [Google Scholar]
- 66.Kickingereder P, Burth S, Wick A, Götz M, Eidel O, Schlemmer H-P, et al. Radiomic profiling of glioblastoma: identifying an imaging predictor of patient survival with improved performance over established clinical and radiologic risk models. Radiology. 2016;280:880–889. doi: 10.1148/radiol.2016160845. [DOI] [PubMed] [Google Scholar]
- 67.Ingrisch M, Schneider MJ, Nörenberg D, De Figueiredo GN, Maier-Hein K, Suchorska B, et al. Radiomic analysis reveals prognostic information in T1-weighted baseline magnetic resonance imaging in patients with glioblastoma. Investig Radiol. 2017;52:360–366. doi: 10.1097/RLI.0000000000000349. [DOI] [PubMed] [Google Scholar]
- 68.Li Q, Bai H, Chen Y, Sun Q, Liu L, Zhou S, et al. A fully-automatic multiparametric radiomics model: towards reproducible and prognostic imaging signature for prediction of overall survival in glioblastoma multiforme. Sci Rep. 2017;7:1–9. [DOI] [PMC free article] [PubMed]
- 69.Beig N, Patel J, Prasanna P, Hill V, Gupta A, Correa R, et al. Radiogenomic analysis of hypoxia pathway is predictive of overall survival in glioblastoma. Sci Rep. 2018;8:7. doi: 10.1038/s41598-017-18310-0. [DOI] [PMC free article] [PubMed] [Google Scholar]
- 70.Kickingereder P, Neuberger U, Bonekamp D, Piechotta PL, Götz M, Wick A, et al. Radiomic subtyping improves disease stratification beyond key molecular, clinical, and standard imaging characteristics in patients with glioblastoma. Neuro-Oncology. 2018;20:848–857. doi: 10.1093/neuonc/nox188. [DOI] [PMC free article] [PubMed] [Google Scholar]
- 71.Grossmann P, Narayan V, Chang K, Rahman R, Abrey L, Reardon DA, et al. Quantitative imaging biomarkers for risk stratification of patients with recurrent glioblastoma treated with bevacizumab. Neuro-Oncology. 2017;19:1688–1697. doi: 10.1093/neuonc/nox092. [DOI] [PMC free article] [PubMed] [Google Scholar]
- 72.Chaddad A, Sabri S, Niazi T, Abdulkarim B. Prediction of survival with multi-scale radiomic analysis in glioblastoma patients. Med Biol Eng Comput. 2018;56:2287–2300. doi: 10.1007/s11517-018-1858-4. [DOI] [PubMed] [Google Scholar]
- 73.Bickelhaupt S, Jaeger PF, Laun FB, Lederer W, Daniel H, Kuder TA, et al. Radiomics based on adapted diffusion kurtosis imaging helps to clarify most mammographic findings suspicious for cancer. Radiology. 2018;287:170273. doi: 10.1148/radiol.2017170273. [DOI] [PubMed] [Google Scholar]
- 74.Lim WK, Er MJ. Classification of mammographic masses using generalized dynamic fuzzy neural networks. Med Phys. 2004;31:1288–1295. doi: 10.1118/1.1708643. [DOI] [PubMed] [Google Scholar]
- 75.Sapate SG, Mahajan A, Talbar SN, Sable N, Desai S, Thakur M. Radiomics based detection and characterization of suspicious lesions on full field digital mammograms. Comput Methods Prog Biomed. 2018;163:1–20. doi: 10.1016/j.cmpb.2018.05.017. [DOI] [PubMed] [Google Scholar]
- 76.Chen W, Giger ML, Lan L, Bick U. Computerized interpretation of breast MRI: investigation of enhancement-variance dynamics. Med Phys. 2004;31:1076–1082. doi: 10.1118/1.1695652. [DOI] [PubMed] [Google Scholar]
- 77.Sahiner B, Chan HP, Roubidoux MA, Helvie MA, Hadjiiski LM, Ramachandran A, et al. Computerized characterization of breast masses on three-dimensional ultrasound volumes. Med Phys. 2004;31:744–754. doi: 10.1118/1.1649531. [DOI] [PubMed] [Google Scholar]
- 78.Nandi RJ, Nandi AK, Rangayyan R, Scutt D. Genetic programming and feature selection for classification of breast masses in mammograms. Conf Proc IEEE Eng Med Biol Soc. 2006;44:3021–4. [DOI] [PubMed]
- 79.Cui J, Sahiner B, Chan HP, Nees A, Paramagul C, Hadjiiski LM, et al. A new automated method for the segmentation and characterization of breast masses on ultrasound images. Med Phys. 2009;36:1553–1565. doi: 10.1118/1.3110069. [DOI] [PMC free article] [PubMed] [Google Scholar]
- 80.Moon WK, Shen YW, Huang CS, Chiang LR, Chang RF. Computer-aided diagnosis for the classification of breast masses in automated whole breast ultrasound images. Ultrasound Med Biol. 2011;37:539–548. doi: 10.1016/j.ultrasmedbio.2011.01.006. [DOI] [PubMed] [Google Scholar]
- 81.Ramos-Pollán R, Guevara-López MA, Suárez-Ortega C, Díaz-Herrero G, Franco-Valiente JM, Rubio-Del-Solar M, et al. Discovering mammography-based machine learning classifiers for breast cancer diagnosis. J Med Syst. 2012;36:2259–2269. doi: 10.1007/s10916-011-9693-2. [DOI] [PubMed] [Google Scholar]
- 82.Cai H, Peng Y, Ou C, Chen M, Li L. Diagnosis of breast masses from dynamic contrast-enhanced and diffusion-weighted MR: a machine learning approach. PLoS One. 2014;9:e87387. doi: 10.1371/journal.pone.0087387. [DOI] [PMC free article] [PubMed] [Google Scholar]
- 83.Dash R, Roy S, Beura S, Majhi B. Classification of mammogram using two-dimensional discrete orthonormal S-transform for breast cancer detection. Healthc Technol Lett. 2015;2:46–51. doi: 10.1049/htl.2014.0108. [DOI] [PMC free article] [PubMed] [Google Scholar]
- 84.Cai H, Liu L, Peng Y, Wu Y, Li L. Diagnostic assessment by dynamic contrast-enhanced and diffusion-weighted magnetic resonance in differentiation of breast lesions under different imaging protocols. BMC Cancer. 2014;14:1–12. doi: 10.1186/1471-2407-14-366. [DOI] [PMC free article] [PubMed] [Google Scholar]
- 85.Ma W, Ji Y, Qi L, Guo X, Jian X, Liu P. Breast cancer Ki67 expression prediction by DCE-MRI radiomics features. Clin Radiol. 2018;73:909.e1–909.e5. doi: 10.1016/j.crad.2018.05.027. [DOI] [PubMed] [Google Scholar]
- 86.Li H, Zhu Y, Burnside ES, Huang E, Drukker K, Hoadley KA, et al. Quantitative MRI radiomics in the prediction of molecular classifications of breast cancer subtypes in the TCGA/TCIA data set. npj Breast Cancer. 2016;2:16012. doi: 10.1038/npjbcancer.2016.12. [DOI] [PMC free article] [PubMed] [Google Scholar]
- 87.Liang C, Cheng Z, Huang Y, He L, Chen X. An MRI-based radiomics classifier for preoperative prediction of Ki-67 status in breast cancer. Acad Radiol. 2018;25:1111–1117. doi: 10.1016/j.acra.2018.01.006. [DOI] [PubMed] [Google Scholar]
- 88.Dong Y, Feng Q, Yang W, Lu Z, Deng C, Zhang L, et al. Preoperative prediction of sentinel lymph node metastasis in breast cancer based on radiomics of T2-weighted fat-suppression and diffusion-weighted MRI. Eur Radiol. 2018;28:582–591. doi: 10.1007/s00330-017-5005-7. [DOI] [PubMed] [Google Scholar]
- 89.Liu C, Ding J, Spuhler K, Gao Y, Serrano Sosa M, Moriarty M, et al. Preoperative prediction of sentinel lymph node metastasis in breast cancer by radiomic signatures from dynamic contrast-enhanced MRI. J Magn Reson Imaging. 2019;49:131–140. doi: 10.1002/jmri.26224. [DOI] [PMC free article] [PubMed] [Google Scholar]
- 90.Braman NM, Etesami M, Prasanna P, Dubchuk C, Gilmore H, Tiwari P, et al. Intratumoral and peritumoral radiomics for the pretreatment prediction of pathological complete response to neoadjuvant chemotherapy based on breast DCE-MRI. Breast Cancer Res. 2017;19:1–14. [DOI] [PMC free article] [PubMed]
- 91.Fan M, Wu G, Cheng H, Zhang J, Shao G, Li L. Radiomic analysis of DCE-MRI for prediction of response to neoadjuvant chemotherapy in breast cancer patients. Eur J Radiol. 2017;94:140–147. doi: 10.1016/j.ejrad.2017.06.019. [DOI] [PubMed] [Google Scholar]
- 92.Park H, Lim Y, Ko ES, Cho H-H, Lee JE, Han B-K, et al. Radiomics signature on magnetic resonance imaging: association with disease-free survival in patients with invasive breast cancer. Clin Cancer Res. 2018;24:4705–4714. doi: 10.1158/1078-0432.CCR-17-3783. [DOI] [PubMed] [Google Scholar]
- 93.Huang SY, Franc BL, Harnish RJ, Liu G, Mitra D, Copeland TP, et al. Exploration of PET and MRI radiomic features for decoding breast cancer phenotypes and prognosis. NPJ Breast Cancer. 2018;4:24. doi: 10.1038/s41523-018-0078-2. [DOI] [PMC free article] [PubMed] [Google Scholar]
- 94.Liu Y, Zhang Y, Cheng R, Liu S, Qu F, Yin X, et al. Radiomics analysis of apparent diffusion coefficient in cervical cancer: a preliminary study on histological grade evaluation. J Magn Reson Imaging. 2019;49:1–11. doi: 10.1002/jmri.26192. [DOI] [PubMed] [Google Scholar]
- 95.De Bernardi E, Buda A, Guerra L, Vicini D, Elisei F, Landoni C, et al. Radiomics of the primary tumour as a tool to improve 18F-FDG-PET sensitivity in detecting nodal metastases in endometrial cancer. EJNMMI Res. 2018;8:1–9. doi: 10.1186/s13550-018-0441-1. [DOI] [PMC free article] [PubMed] [Google Scholar]
- 96.Reuzé S, Orlhac F, Chargari C, Nioche C, Limkin E, Riet F, et al. Prediction of cervical cancer recurrence using textural features extracted from 18F-FDG PET images acquired with different scanners. Oncotarget. 2017;8:43169–43179. doi: 10.18632/oncotarget.17856. [DOI] [PMC free article] [PubMed] [Google Scholar]
- 97.Schernberg A, Reuze S, Orlhac F, Buvat I, Dercle L, Sun R, et al. A score combining baseline neutrophilia and primary tumor SUVpeakmeasured from FDG PET is associated with outcome in locally advanced cervical cancer. Eur J Nucl Med Mol Imaging. 2018;45:187–195. doi: 10.1007/s00259-017-3824-z. [DOI] [PubMed] [Google Scholar]
- 98.Altazi BA, Fernandez DC, Zhang GG, Hawkins S, Naqvi SM, Kim Y, et al. Investigating multi-radiomic models for enhancing prediction power of cervical cancer treatment outcomes. Phys Medica. 2018;46:180–188. doi: 10.1016/j.ejmp.2017.10.009. [DOI] [PMC free article] [PubMed] [Google Scholar]
- 99.Lucia F, Visvikis D, Desseroit M-C, Miranda O, Malhaire J-P, Robin P, et al. Prediction of outcome using pretreatment 18F-FDG PET/CT and MRI radiomics in locally advanced cervical cancer treated with chemoradiotherapy. Eur J Nucl Med Mol Imaging. 2018;45:768–786. doi: 10.1007/s00259-017-3898-7. [DOI] [PubMed] [Google Scholar]
- 100.Huang X, Cheng Z, Huang Y, Liang CC, He L, Ma Z, et al. CT-based radiomics signature to discriminate high-grade from low- grade colorectal adenocarcinoma. Acad Radiol RA. 2018;25:1285–1297. doi: 10.1016/j.acra.2018.01.020. [DOI] [PubMed] [Google Scholar]
- 101.Yang L, Dong D, Fang M, Zhu Y, Zang Y, Liu Z, et al. Can CT-based radiomics signature predict KRAS/NRAS/BRAF mutations in colorectal cancer? Eur Radiol. 2018;28:2058–2067. doi: 10.1007/s00330-017-5146-8. [DOI] [PubMed] [Google Scholar]
- 102.Liang C, Huan Y, He L, Chen X, Ma Z, Dong D, et al. The development and validation of a CT-based radiomics signature for the preoperative discrimination of stage I-II and stage III-IV colorectal cancer. Oncotarget. 2016;7:31401–31412. doi: 10.18632/oncotarget.8919. [DOI] [PMC free article] [PubMed] [Google Scholar]
- 103.Huang YQ, Liang CH, He L, Tian J, Liang CS, Chen X, et al. Development and validation of a radiomics nomogram for preoperative prediction of lymph node metastasis in colorectal cancer. J Clin Oncol. 2016;34:2157–2164. doi: 10.1200/JCO.2015.65.9128. [DOI] [PubMed] [Google Scholar]
- 104.Carvalho S, Leijenaar RTH, Troost EGC, van Timmeren JE, Oberije C, van Elmpt W, et al. 18F-fluorodeoxyglucose positron-emission tomography (FDG-PET)-radiomics of metastatic lymph nodes and primary tumor in non-small cell lung cancer (NSCLC) - a prospective externally validated study. PLoS One. 2018;13:e0192859. doi: 10.1371/journal.pone.0192859. [DOI] [PMC free article] [PubMed] [Google Scholar]
- 105.Cusumano D, Dinapoli N, Boldrini L, Chiloiro G, Gatta R, Masciocchi C, et al. Fractal-based radiomic approach to predict complete pathological response after chemo-radiotherapy in rectal cancer. Radiol Med. 2018;123:286–295. doi: 10.1007/s11547-017-0838-3. [DOI] [PubMed] [Google Scholar]
- 106.Liu Z, Zhang XY, Shi YJ, Wang L, Zhu HT, Tang Z, et al. Radiomics analysis for evaluation of pathological complete response to neoadjuvant chemoradiotherapy in locally advanced rectal cancer. Clin Cancer Res. 2017;23:7253–7262. doi: 10.1158/1078-0432.CCR-17-1038. [DOI] [PubMed] [Google Scholar]
- 107.Bibault JE, Giraud P, Durdux C, Taieb J, Berger A, Coriat R, et al. Deep learning and radiomics predict complete response after neo-adjuvant chemoradiation for locally advanced rectal cancer. Sci Rep. 2018;8:1–8. doi: 10.1038/s41598-018-30657-6. [DOI] [PMC free article] [PubMed] [Google Scholar]
- 108.Cui Y, Yang X, Shi Z, Yang Z, Du X, Zhao Z, et al. Radiomics analysis of multiparametric MRI for prediction of pathological complete response to neoadjuvant chemoradiotherapy in locally advanced rectal cancer. Eur Radiol. 2019;29:1211–1220. doi: 10.1007/s00330-018-5683-9. [DOI] [PubMed] [Google Scholar]
- 109.Meng Y, Zhang Y, Dong D, Li C, Liang X, Zhang C, et al. Novel radiomic signature as a prognostic biomarker for locally advanced rectal cancer. J Magn Reson Imaging. 2018;48:605–614. doi: 10.1002/jmri.25968. [DOI] [PubMed] [Google Scholar]
- 110.Tan X, Ma Z, Yan L, Ye W, Liu Z, Liang C. Radiomics nomogram outperforms size criteria in discriminating lymph node metastasis in resectable esophageal squamous cell carcinoma. Eur Radiol. 2019;29:392–400. doi: 10.1007/s00330-018-5581-1. [DOI] [PubMed] [Google Scholar]
- 111.Shen C, Liu Z, Wang Z, Guo J, Zhang H, Wang Y, et al. Building CT radiomics based nomogram for preoperative esophageal cancer patients lymph node metastasis prediction. Transl Oncol. 2018;11:815–824. doi: 10.1016/j.tranon.2018.04.005. [DOI] [PMC free article] [PubMed] [Google Scholar]
- 112.Qu J, Shen C, Qin J, Wang Z, Liu Z, Guo J, et al. The MR radiomic signature can predict preoperative lymph node metastasis in patients with esophageal cancer. Eur Radiol. 2019;29:906–914. doi: 10.1007/s00330-018-5583-z. [DOI] [PubMed] [Google Scholar]
- 113.Hou Z, Li S, Ren W, Liu J, Yan J, Wan S. Radiomic analysis in T2W and SPAIR T2W MRI: predict treatment response to chemoradiotherapy in esophageal squamous cell carcinoma. J Thorac Dis. 2018;10:2256–2267. doi: 10.21037/jtd.2018.03.123. [DOI] [PMC free article] [PubMed] [Google Scholar]
- 114.Moyo K, Porter C, Chilima B, Mwenda R, Kabue M, Zungu L, et al. Quantifying local tumor morphological changes with Jacobian map for prediction of pathologic tumor response to chemo-radiotherapy in locally advanced esophageal cancer. Phys Med Biol. 2016;4:1–19. doi: 10.1088/1361-6560/aacd22. [DOI] [PMC free article] [PubMed] [Google Scholar]
- 115.Ypsilantis Petros-Pavlos, Siddique Musib, Sohn Hyon-Mok, Davies Andrew, Cook Gary, Goh Vicky, Montana Giovanni. Predicting Response to Neoadjuvant Chemotherapy with PET Imaging Using Convolutional Neural Networks. PLOS ONE. 2015;10(9):e0137036. doi: 10.1371/journal.pone.0137036. [DOI] [PMC free article] [PubMed] [Google Scholar]
- 116.Larue RTHM, Klaassen R, Jochems A, Leijenaar RTH, Hulshof MCCM, van Berge Henegouwen MI, et al. Pre-treatment CT radiomics to predict 3-year overall survival following chemoradiotherapy of esophageal cancer. Acta Oncol (Madr) 2018;57:1475–1481. doi: 10.1080/0284186X.2018.1486039. [DOI] [PubMed] [Google Scholar]
- 117.Chen T, Ning Z, Xu L, Feng X, Han S, Roth HR, et al. Radiomics nomogram for predicting the malignant potential of gastrointestinal stromal tumours preoperatively. Eur Radiol. 2019;29:1074–1082. doi: 10.1007/s00330-018-5629-2. [DOI] [PubMed] [Google Scholar]
- 118.Bektas CT, Kocak B, Yardimci AH, Turkcanoglu MH, Yucetas U, Koca SB, et al. Clear cell renal cell carcinoma: machine learning-based quantitative computed tomography texture analysis for prediction of Fuhrman nuclear grade. Eur Radiol. 2019;29:1153–1163. doi: 10.1007/s00330-018-5698-2. [DOI] [PubMed] [Google Scholar]
- 119.Peng J, Zhang J, Zhang Q, Xu Y, Zhou J, Liu L. A radiomics nomogram for preoperative prediction of microvascular invasion risk in hepatitis b virus-related hepatocellular carcinoma. Diagn Interv Radiol. 2018;24:121–127. doi: 10.5152/dir.2018.17467. [DOI] [PMC free article] [PubMed] [Google Scholar]
- 120.Zhang J, Wang Y, Dong Y, Wang Y. Computer-aided diagnosis of cervical lymph nodes on ultrasonography. Comput Biol Med. 2008;38:234–243. doi: 10.1016/j.compbiomed.2007.10.005. [DOI] [PubMed] [Google Scholar]
- 121.Bogowicz M, Riesterer O, Ikenberg K, Stieb S, Moch H, Studer G, et al. Computed tomography radiomics predicts HPV status and local tumor control after definitive Radiochemotherapy in head and neck squamous cell carcinoma. Int J Radiat Oncol Biol Phys. 2017;99:921–928. doi: 10.1016/j.ijrobp.2017.06.002. [DOI] [PubMed] [Google Scholar]
- 122.Leijenaar RT, Bogowicz M, Jochems A, Hoebers FJ, Wesseling FW, Huang SH, et al. Development and validation of a radiomic signature to predict HPV (p16) status from standard CT imaging: a multicenter study. Br J Radiol. 2018;91:20170498. doi: 10.1259/bjr.20170498. [DOI] [PMC free article] [PubMed] [Google Scholar]
- 123.Al Ajmi E, Forghani B, Reinhold C, Bayat M, Forghani R. Spectral multi-energy CT texture analysis with machine learning for tissue classification: an investigation using classification of benign parotid tumours as a testing paradigm. Eur Radiol. 2018;28:2604–2611. doi: 10.1007/s00330-017-5214-0. [DOI] [PubMed] [Google Scholar]
- 124.Wang G, He L, Yuan C, Huang Y, Liu Z, Liang C. Pretreatment MR imaging radiomics signatures for response prediction to induction chemotherapy in patients with nasopharyngeal carcinoma. Eur J Radiol. 2018;98:100–106. doi: 10.1016/j.ejrad.2017.11.007. [DOI] [PubMed] [Google Scholar]
- 125.Zhang B, Tian J, Dong D, Gu D, Dong Y, Zhang L, et al. Radiomics features of multiparametric MRI as novel prognostic factors in advanced nasopharyngeal carcinoma. Clin Cancer Res. 2017;23:4259–4269. doi: 10.1158/1078-0432.CCR-16-2910. [DOI] [PubMed] [Google Scholar]
- 126.Leijenaar RTH, Carvalho S, Hoebers FJP, Aerts HJWL, van Elmpt WJC, Huang SH, et al. External validation of a prognostic CT-based radiomic signature in oropharyngeal squamous cell carcinoma. Acta Oncol. 2015;54:1423–1429. doi: 10.3109/0284186X.2015.1061214. [DOI] [PubMed] [Google Scholar]
- 127.Bogowicz Marta, Riesterer Oliver, Stark Luisa Sabrina, Studer Gabriela, Unkelbach Jan, Guckenberger Matthias, Tanadini-Lang Stephanie. Comparison of PET and CT radiomics for prediction of local tumor control in head and neck squamous cell carcinoma. Acta Oncologica. 2017;56(11):1531–1536. doi: 10.1080/0284186X.2017.1346382. [DOI] [PubMed] [Google Scholar]
- 128.Vallières M, Kay-Rivest E, Perrin LJ, Liem X, Furstoss C, Aerts HJWL, et al. Radiomics strategies for risk assessment of tumour failure in head-and-neck cancer. Sci Rep. 2017;7:1–14. doi: 10.1038/s41598-017-10371-5. [DOI] [PMC free article] [PubMed] [Google Scholar]
- 129.Ouyang F-S, Guo B-L, Zhang B, Dong Y-H, Zhang L, Mo X-K, et al. Exploration and validation of radiomics signature as an independent prognostic biomarker in stage III-IVb nasopharyngeal carcinoma. Oncotarget. 2017;8:74869–74879. doi: 10.18632/oncotarget.20423. [DOI] [PMC free article] [PubMed] [Google Scholar]
- 130.van Dijk LV, Thor M, Steenbakkers RJHM, Apte A, Zhai TT, Borra R, et al. Parotid gland fat related magnetic resonance image biomarkers improve prediction of late radiation-induced xerostomia. Radiother Oncol. 2018;128:459–466. doi: 10.1016/j.radonc.2018.06.012. [DOI] [PMC free article] [PubMed] [Google Scholar]
- 131.Sun R, Limkin EJ, Vakalopoulou M, Dercle L, Champiat S, Han SR, et al. A radiomics approach to assess tumour-infiltrating CD8 cells and response to anti-PD-1 or anti-PD-L1 immunotherapy: an imaging biomarker, retrospective multicohort study. Lancet Oncol. 2018;19:1180–1191. doi: 10.1016/S1470-2045(18)30413-3. [DOI] [PubMed] [Google Scholar]
- 132.Colen RR, Fujii T, Bilen MA, Kotrotsou A, Abrol S, Hess KR, et al. Radiomics to predict immunotherapy-induced pneumonitis: proof of concept. Investig New Drugs. 2018;36:601–607. doi: 10.1007/s10637-017-0524-2. [DOI] [PMC free article] [PubMed] [Google Scholar]
- 133.Alilou M, Beig N, Orooji M, Rajiah P, Velcheti V, Clinic C, et al. An integrated segmentation and shape-based classification scheme for distinguishing adenocarcinomas from granulomas on lung CT. Med Phys. 2017;44:3556–3569. doi: 10.1002/mp.12208. [DOI] [PMC free article] [PubMed] [Google Scholar]
- 134.Peikert T, Duan F, Rajagopalan S, Karwoski RA, Clay R, Robb RA, et al. Novel high-resolution computed tomography-based radiomic classifier for screen-identified pulmonary nodules in the National Lung Screening Trial. PLoS One. 2018;13:1–15. doi: 10.1371/journal.pone.0196910. [DOI] [PMC free article] [PubMed] [Google Scholar]
- 135.Tu Shu-Ju, Wang Chih-Wei, Pan Kuang-Tse, Wu Yi-Cheng, Wu Chen-Te. Localized thin-section CT with radiomics feature extraction and machine learning to classify early-detected pulmonary nodules from lung cancer screening. Physics in Medicine & Biology. 2018;63(6):065005. doi: 10.1088/1361-6560/aaafab. [DOI] [PubMed] [Google Scholar]
- 136.Carter BW, Godoy MC, Erasmus JJ. Predicting malignant nodules from screening CTs. J Thorac Oncol. 2016;11:2045–2047. doi: 10.1016/j.jtho.2016.09.117. [DOI] [PubMed] [Google Scholar]
- 137.Orooji M, Alilou M, Rakshit S, Beig N, Khorrami MH, Rajiah P, et al. Combination of computer extracted shape and texture features enables discrimination of granulomas from adenocarcinoma on chest computed tomography. J Med Imaging. 2018;5:1. doi: 10.1117/1.JMI.5.2.024501. [DOI] [PMC free article] [PubMed] [Google Scholar]
- 138.Chen X, Fang M, Dong D, Wei X, Liu L, Xu X, et al. A radiomics signature in preoperative predicting degree of tumor differentiation in patients with non–small cell lung cancer. Acad Radiol. 2018;25:1548–1555. doi: 10.1016/j.acra.2018.02.019. [DOI] [PubMed] [Google Scholar]
- 139.Yuan M, Zhang Y-D, Pu X-H, Zhong Y, Li H, Wu J-F, et al. Comparison of a radiomic biomarker with volumetric analysis for decoding tumour phenotypes of lung adenocarcinoma with different disease-specific survival. Eur Radiol. 2017;27(11):4857–4865. doi: 10.1007/s00330-017-4855-3. [DOI] [PubMed] [Google Scholar]
- 140.Zhang L, Chen B, Liu X. Quantitative biomarkers for prediction of epidermal growth factor receptor mutation in non- small cell lung cancer. Transl Oncol. 2018;11:94–101. doi: 10.1016/j.tranon.2017.10.012. [DOI] [PMC free article] [PubMed] [Google Scholar]
- 141.Grossmann P, Stringfield O, El-Hachem N, Bui MM, Rios Velazquez E, Parmar C, et al. Defining the biological basis of radiomic phenotypes in lung cancer. Elife. 2017;6:e23421. doi: 10.7554/eLife.23421. [DOI] [PMC free article] [PubMed] [Google Scholar]
- 142.Rios Velazquez E, Parmar C, Liu Y, Coroller TP, Cruz G, Stringfield O, et al. Somatic mutations drive distinct imaging phenotypes in lung cancer. Cancer Res. 2017;77:3922–3930. doi: 10.1158/0008-5472.CAN-17-0122. [DOI] [PMC free article] [PubMed] [Google Scholar]
- 143.She Y, Zhang L, Zhu H, Dai C, Xie D, Xie H, et al. The predictive value of CT-based radiomics in differentiating indolent from invasive lung adenocarcinoma in patients with pulmonary nodules. Eur Radiol. 2018;28:5121–5128. doi: 10.1007/s00330-018-5509-9. [DOI] [PubMed] [Google Scholar]
- 144.Wu W, Parmar C, Grossmann P, Quackenbush J, Lambin P, Bussink J, et al. Exploratory study to identify radiomics classifiers for lung cancer histology. Front Oncol. 2016;6:1–11. doi: 10.3389/fonc.2016.00071. [DOI] [PMC free article] [PubMed] [Google Scholar]
- 145.Kirienko M, Cozzi L, Rossi A, Voulaz E, Antunovic L, Fogliata A, et al. Ability of FDG PET and CT radiomics features to differentiate between primary and metastatic lung lesions. Eur J Nucl Med Mol Imaging. 2018;45:1649–1660. doi: 10.1007/s00259-018-3987-2. [DOI] [PubMed] [Google Scholar]
- 146.Raniery J, Junior F, Koenigkam-santos M, Enrique F, Cipriano G, Todorovic A, et al. Radiomics-based features for pattern recognition of lung cancer histopathology and metastases. Comput Methods Prog Biomed. 2018;159:23–30. doi: 10.1016/j.cmpb.2018.02.015. [DOI] [PubMed] [Google Scholar]
- 147.Song So Hee, Park Hyunjin, Lee Geewon, Lee Ho Yun, Sohn Insuk, Kim Hye Seung, Lee Seung Hak, Jeong Ji Yun, Kim Jhingook, Lee Kyung Soo, Shim Young Mog. Imaging Phenotyping Using Radiomics to Predict Micropapillary Pattern within Lung Adenocarcinoma. Journal of Thoracic Oncology. 2017;12(4):624–632. doi: 10.1016/j.jtho.2016.11.2230. [DOI] [PubMed] [Google Scholar]
- 148.Fan L, Fang MJ, Li ZB, Tu WT, Wang SP, Chen WF. et al, Radiomics signature: a biomarker for the preoperative discrimination of lung invasive adenocarcinoma manifesting as a ground-glass nodule. Eur Radiol. 2018:1–9. [DOI] [PubMed]
- 149.Zhu X, Dong D, Chen Z, Fang M, Zhang L, Song J, et al. Radiomic signature as a diagnostic factor for histologic subtype classification of non-small cell lung cancer. Eur Radiol. 2018;28:2772–2778. doi: 10.1007/s00330-017-5221-1. [DOI] [PubMed] [Google Scholar]
- 150.Ma Yuan, Feng Wei, Wu Zhiyuan, Liu Mengyang, Zhang Feng, Liang Zhigang, Cui Chunlei, Huang Jian, Li Xia, Guo Xiuhua. Intra-tumoural heterogeneity characterization through texture and colour analysis for differentiation of non-small cell lung carcinoma subtypes. Physics in Medicine & Biology. 2018;63(16):165018. doi: 10.1088/1361-6560/aad648. [DOI] [PubMed] [Google Scholar]
- 151.Xue X, Yang Y, Huang Q, Cui F, Lian Y, Zhang S, et al. Use of a radiomics model to predict tumor invasiveness of pulmonary adenocarcinomas appearing as pulmonary ground-glass nodules. Biomed Res Int. 2018;2018:6803971. doi: 10.1155/2018/6803971. [DOI] [PMC free article] [PubMed] [Google Scholar]
- 152.Yuan M, Liu JY, Zhang T, Zhang YD, Li H, Yu TF. Prognostic impact of the findings on thin-section computed tomography in stage i lung adenocarcinoma with visceral pleural invasion. Sci Rep. 2018;8:1–9. doi: 10.1038/s41598-018-22853-1. [DOI] [PMC free article] [PubMed] [Google Scholar]
- 153.Liu Y, Kim J, Balagurunathan Y, Hawkins S, Stringfield O, Schabath MB, et al. Prediction of pathological nodal involvement by CT-based radiomic features of the primary tumor in patients with clinically node-negative peripheral lung adenocarcinomas. Med Phys. 2018;45:2518–2526. doi: 10.1002/mp.12901. [DOI] [PMC free article] [PubMed] [Google Scholar]
- 154.Yang X, Pan X, Liu H, Gao D, He J, Liang W, et al. A new approach to predict lymph node metastasis in solid lung adenocarcinoma: a radiomics nomogram. J Thorac Dis. 2018;10:S807–S819. doi: 10.21037/jtd.2018.03.126. [DOI] [PMC free article] [PubMed] [Google Scholar]
- 155.Coroller TTP, Grossmann P, Hou Y, Rios Velazquez E, Leijenaar RTH, Hermann G, et al. CT-based radiomic signature predicts distant metastasis in lung. Radiother Oncol. 2015;114:345–350. doi: 10.1016/j.radonc.2015.02.015. [DOI] [PMC free article] [PubMed] [Google Scholar]
- 156.Coroller TP, Agrawal V, Huynh E, Narayan V, Lee SW, Mak RH, et al. Radiomic-based pathological response prediction from primary tumors and lymph nodes in NSCLC. J Thorac Oncol. 2017;12:467–476. doi: 10.1016/j.jtho.2016.11.2226. [DOI] [PMC free article] [PubMed] [Google Scholar]
- 157.Huynh E, Coroller TP, Narayan V, Agrawal V, Hou Y, Romano J, et al. CT-based radiomic analysis of stereotactic body radiation therapy patients with lung cancer. Int J Radiat. 2016;120:258–266. doi: 10.1016/j.radonc.2016.05.024. [DOI] [PubMed] [Google Scholar]
- 158.Huang Yanqi, Liu Zaiyi, He Lan, Chen Xin, Pan Dan, Ma Zelan, Liang Cuishan, Tian Jie, Liang Changhong. Radiomics Signature: A Potential Biomarker for the Prediction of Disease-Free Survival in Early-Stage (I or II) Non—Small Cell Lung Cancer. Radiology. 2016;281(3):947–957. doi: 10.1148/radiol.2016152234. [DOI] [PubMed] [Google Scholar]
- 159.Yu W, Tang C, Hobbs BP, Li X, Koay EJ, Wistuba II, et al. Development and validation of a predictive radiomics model for clinical outcomes in stage I non-small cell lung cancer. Int J Radiat Oncol Biol Phys. 2018;102:1090–1097. doi: 10.1016/j.ijrobp.2017.10.046. [DOI] [PubMed] [Google Scholar]
- 160.Virginia BM, Laura F, Silvia R, Roberto F, Francesco F, Eva H, et al. Prognostic value of histogram analysis in advanced non-small cell lung cancer: a radiomic study. Oncotarget. 2018;9:1906–1914. doi: 10.18632/oncotarget.22316. [DOI] [PMC free article] [PubMed] [Google Scholar]
- 161.Arshad MA, Thornton A, Lu H, Tam H, Wallitt K, Rodgers N, et al. Discovery of pre-therapy 2-deoxy-2-18F-fluoro-D-glucose positron emission tomography-based radiomics classifiers of survival outcome in non-small-cell lung cancer patients. Eur J Nucl Med Mol Imaging. 2018;46:455–466. doi: 10.1007/s00259-018-4139-4. [DOI] [PMC free article] [PubMed] [Google Scholar]
- 162.Tang C, Hobbs B, Amer A, Li X, Behrens C, Canales JR, et al. Development of an immune-pathology informed radiomics model for non-small cell lung cancer. Sci Rep. 2018;8:1–9. doi: 10.1038/s41598-018-20471-5. [DOI] [PMC free article] [PubMed] [Google Scholar]
- 163.Carvalho S, Leijenaar RTH, Troost EGC, Van Timmeren JE, Oberije C, Van Elmpt W, et al. 18FDG-PET-radiomics of metastatic lymph nodes and primary tumour in NSCLC - a prospective externally validated study. PLoS One. 2018;13:e0192859. doi: 10.1371/journal.pone.0192859. [DOI] [PMC free article] [PubMed] [Google Scholar]
- 164.Mattonen SA, Palma DA, Johnson C, Louie AV, Landis M, Rodrigues G, et al. Detection of local cancer recurrence after stereotactic ablative radiation therapy for lung cancer: physician performance versus radiomic assessment. Int J Radiat Oncol Biol Phys. 2016;94:1121–8. [DOI] [PubMed]
- 165.van Timmeren JE, Leijenaar RTH, van Elmpt W, Reymen B, Oberije C, Monshouwer R, et al. Survival prediction of non-small cell lung cancer patients using radiomics analyses of cone-beam CT images. Radiother Oncol. 2017;123:363–9. [DOI] [PubMed]
- 166.Chaddad A, Desrosiers C, Toews M, Abdulkarim B. Predicting survival time of lung cancer patients using radiomic analysis. Oncotarget. 2017;8:104393–104407. doi: 10.18632/oncotarget.22251. [DOI] [PMC free article] [PubMed] [Google Scholar]
- 167.Kirienko M, Cozzi L, Antunovic L, Lozza L, Fogliata A, Voulaz E, et al. Prediction of disease-free survival by the PET/CT radiomic signature in non-small cell lung cancer patients undergoing surgery. Eur J Nucl Med Mol Imaging. 2018;45:207–217. doi: 10.1007/s00259-017-3837-7. [DOI] [PubMed] [Google Scholar]
- 168.Krafft SP, Rao A, Stingo F, Briere TM, Court LE, Liao Z, et al. The utility of quantitative CT radiomics features for improved prediction of radiation pneumonitis. Med Phys. 2018;45:5317–5324. doi: 10.1002/mp.13150. [DOI] [PubMed] [Google Scholar]
- 169.Guo J, Liu Z, Shen C, Li Z, Yan F, Tian J, et al. MR-based radiomics signature in differentiating ocular adnexal lymphoma from idiopathic orbital inflammation. Eur Radiol. 2018;28:3872–3881. doi: 10.1007/s00330-018-5381-7. [DOI] [PubMed] [Google Scholar]
- 170.Lucidarme O, Akakpo JP, Granberg S, Sideri M, Levavi H, Schneider A, et al. A new computer-aided diagnostic tool for non-invasive characterisation of malignant ovarian masses: results of a multicentre validation study. Eur Radiol. 2010;20:1822–1830. doi: 10.1007/s00330-010-1750-6. [DOI] [PubMed] [Google Scholar]
- 171.Chakraborty J, Midya A, Gazit L, Attiyeh M, Langdon-Embry L, Allen PJ, et al. CT radiomics to predict high-risk intraductal papillary mucinous neoplasms of the pancreas. Med Phys. 2018;45:5019–5029. doi: 10.1002/mp.13159. [DOI] [PMC free article] [PubMed] [Google Scholar]
- 172.Bonekamp D, Kohl S, Wiesenfarth M, Schelb P, Radtke JP, Götz M, et al. Radiomic machine learning for characterization of prostate lesions with MRI: comparison to ADC values. Radiology. 2018;289:128–137. doi: 10.1148/radiol.2018173064. [DOI] [PubMed] [Google Scholar]
- 173.Shiradkar R, Ghose S, Jambor I, Taimen P, Ettala O, Purysko AS, et al. Radiomic features from pretreatment biparametric MRI predict prostate cancer biochemical recurrence: preliminary findings. J Magn Reson Imaging. 2018;48:1626–1636. doi: 10.1002/jmri.26178. [DOI] [PMC free article] [PubMed] [Google Scholar]
- 174.Corino VDA, Montin E, Messina A, Casali PG, Gronchi A, Marchianò A, et al. Radiomic analysis of soft tissues sarcomas can distinguish intermediate from high-grade lesions. J Magn Reson Imaging. 2018;47:829–840. doi: 10.1002/jmri.25791. [DOI] [PubMed] [Google Scholar]
- 175.Wu Y, Xu L, Yang P, Lin N, Huang X, Pan W, et al. Survival prediction in high-grade osteosarcoma using radiomics of diagnostic computed tomography. EBioMedicine. 2018;34:27–34. doi: 10.1016/j.ebiom.2018.07.006. [DOI] [PMC free article] [PubMed] [Google Scholar]
- 176.Iyatomi H, Oka H, Celebi ME, Hashimoto M, Hagiwara M, Tanaka M, et al. An improved internet-based melanoma screening system with dermatologist-like tumor area extraction algorithm. Comput Med Imaging Graph. 2008;32:566–579. doi: 10.1016/j.compmedimag.2008.06.005. [DOI] [PubMed] [Google Scholar]
- 177.Liu YY, Ishikawa H, Chen M, Wollstein G, Duker JS, Fujimoto JG, et al. Computerized macular pathology diagnosis in spectral domain optical coherence tomography scans based on multiscale texture and shape features. Investig Ophthalmol Vis Sci. 2011;52:8316–8322. doi: 10.1167/iovs.10-7012. [DOI] [PMC free article] [PubMed] [Google Scholar]
- 178.Bodduluri S, Newell JD, Hoffman EA, Reinhardt JM. Registration-based lung mechanical analysis of chronic obstructive pulmonary disease (COPD) using a supervised machine learning framework. Acad Radiol. 2013;20:527–536. doi: 10.1016/j.acra.2013.01.019. [DOI] [PMC free article] [PubMed] [Google Scholar]
- 179.Bocchi L, Nori J. Shape analysis of microcalcifications using radon transform. Med Eng Phys. 2007;29:691–698. doi: 10.1016/j.medengphy.2006.07.012. [DOI] [PubMed] [Google Scholar]
- 180.Li Z, Wang Y, Yu J, Guo Y, Cao W. Deep learning based radiomics (DLR) and its usage in noninvasive IDH1 prediction for low grade glioma. Sci Rep. 2017;7:1–11. [DOI] [PMC free article] [PubMed]
- 181.Lao J, Chen Y, Li ZC, Li Q, Zhang J, Liu J, et al. A deep learning-based radiomics model for prediction of survival in glioblastoma multiforme. Sci Rep. 2017;7:1–8. [DOI] [PMC free article] [PubMed]
- 182.Ning Z, Luo J, Li Y, Han S, Feng Q, Xu Y, et al. Pattern classification for gastrointestinal stromal tumors by integration of radiomics and deep convolutional features. IEEE J Biomed Heal Informatics. 2018:1–1. [DOI] [PubMed]
- 183.Huynh BQ, Li H, Giger ML. Digital mammographic tumor classification using transfer learning from deep convolutional neural networks. J Med Imaging. 2016;3:034501. doi: 10.1117/1.JMI.3.3.034501. [DOI] [PMC free article] [PubMed] [Google Scholar]
- 184.Kirienko M, Sollini M, Silvestri G, Mognetti S, Voulaz E, Antunovic L, et al. Convolutional neural networks promising in lung cancer T-parameter assessment on baseline FDG-PET/CT. Contrast Media Mol Imaging. 2018;2018:1–6. doi: 10.1155/2018/1382309. [DOI] [PMC free article] [PubMed] [Google Scholar]
- 185.Park SH, Han K. Methodologic guide for evaluating clinical performance and effect of artificial intelligence technology for medical diagnosis and prediction. Radiology. 2018;286:800–809. doi: 10.1148/radiol.2017171920. [DOI] [PubMed] [Google Scholar]
- 186.Srinivasan GN, Shobha G. Statistical texture analysis. Proc WORLD Acad Sci Eng Technol. 2008;36:1264–1269. [Google Scholar]
- 187.Way TW, Sahiner B, Hadjiiski LM, Chan H-P. Effect of finite sample size on feature selection and classification: a simulation study. Med Phys. 2010;37:907–920. doi: 10.1118/1.3284974. [DOI] [PMC free article] [PubMed] [Google Scholar]
- 188.Chan H-P, Sahiner B, Wagner RF, Petrick N. Classifier design for computer-aided diagnosis: effects of finite sample size on the mean performance of classical and neural network classifiers. Med Phys. 1999;26:2654–2668. doi: 10.1118/1.598805. [DOI] [PubMed] [Google Scholar]
- 189.Mazurowski MA, Habas PA, Zurada JM, Lo JY, Baker JA, Tourassi GD. Training neural network classifiers for medical decision making: the effects of imbalanced datasets on classification performance. Neural Netw. 2008;21:427–436. doi: 10.1016/j.neunet.2007.12.031. [DOI] [PMC free article] [PubMed] [Google Scholar]
- 190.Brazauskas R, Logan BR. Observational studies: matching or regression? Biol Blood Marrow Transplant. 2016;22:557–563. doi: 10.1016/j.bbmt.2015.12.005. [DOI] [PMC free article] [PubMed] [Google Scholar]
- 191.Lambin P, Leijenaar RTH, Deist TM, Peerlings J, de Jong EEC, van Timmeren J, et al. Radiomics: the bridge between medical imaging and personalized medicine. Nat Rev Clin Oncol. 2017;14:749–762. doi: 10.1038/nrclinonc.2017.141. [DOI] [PubMed] [Google Scholar]
- 192.Vallieres M, Zwanenburg A, Badic B, Cheze-Le Rest C, Visvikis D, Hatt M. Responsible radiomics research for faster clinical translation. J Nucl Med. 2018;59(2):189–193. doi: 10.2967/jnumed.117.200501. [DOI] [PMC free article] [PubMed] [Google Scholar]
- 193.Zwanenburg A, Leger S, Vallières M, Löck S. Initiative for the IBS. Image biomarker standardisation initiative. arXiv:1612.07003.
Associated Data
This section collects any data citations, data availability statements, or supplementary materials included in this article.
Supplementary Materials
(DOCX 31 kb)